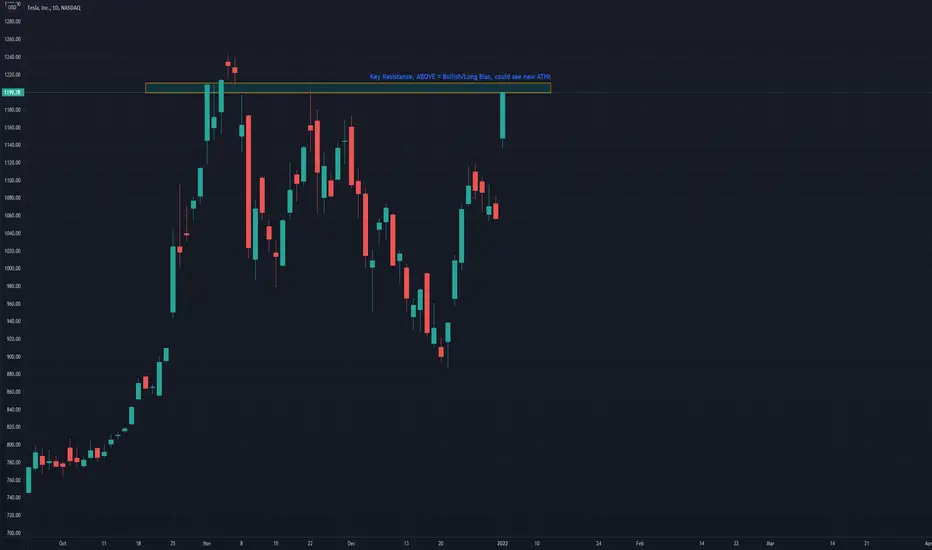
$TSLA, trading it 1/4For 1/4, intraday trading idea for options trading; For red or green market day.
Break over 1210 (entry, long), it can see 1245-1260 (exit)
#options #daytrading
Option Trading 101:
Risk what you can lose (0.5%-5%)
Watch buyers and sellers (their interactions & sentiment, ex. exhaustion of buying or selling, etc.) in strikes that you’re watching & the ticker too; this is how YOU manage YOUR trade.
Consider following and checking out my prior posts, have a great one. Not financial advice.
Options
$COIN, trading it 1/4For 1/4, intraday trading ideas for options trading; For red or green market day.
Not Touching Long Until Back Over 261 (in the short term)
Break below 250 (entry, short), it can see 239-243 (exit)
#options #daytrading
Option Trading 101:
Risk what you can lose (0.5%-5%)
Watch buyers and sellers (their interactions & sentiment, ex. exhaustion of buying or selling, etc.) in strikes that you’re watching & the ticker too; this is how YOU manage YOUR trade.
Consider following and checking out my prior posts, have a great one. Not financial advice.

$SNOW, trading it 1/4For 1/4, intraday trading ideas for options trading; For red or green market day.
Break over 335 (entry, long), it can see 345-350 (exit)
Break below 322 (entry, short), it can see 307-312 (exit)
#options #daytrading
Option Trading 101:
Risk what you can lose (0.5%-5%)
Watch buyers and sellers (their interactions & sentiment, ex. exhaustion of buying or selling, etc.) in strikes that you’re watching & the ticker too; this is how YOU manage YOUR trade.
Consider following and checking out my prior posts, have a great one. Not financial advice.


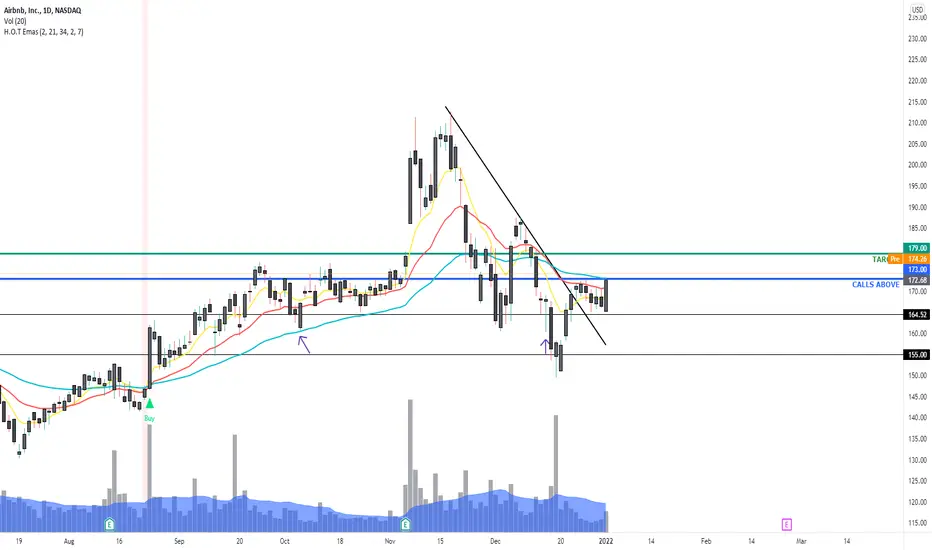
ABNB ready?Strong bullish candle yesterday (daily)
Price had already broken out of trendline, and it was consolidating.
Calls: Above PM high
Target: 180
LAZR ready ?Broke out of descending channel and is consolidating inside a rectangle.
I am watching price breaking and staying above 18.00
Calls: Above PM or 18.00
Targets: 18.81 - 20.15 - 22.10 - 23.90

$TQQQ, trading it 1/3 For 1/3, intraday trading ideas for options trading; not financial advice, 2 plans for red or green market day.
Break over 169.5 (entry, long), it can see 174-177 (exit)
Break below 165.5 (entry, short), it can see 158-161 (exit)
#options #daytrading
Option Trading 101:
Risk what you can lose (0.5%-5%)
Watch buyers and sellers (their interactions & sentiment, ex. exhaustion of buying or selling, etc.) in strikes that you’re watching & the ticker too; this is how YOU manage YOUR trade.
Consider following and checking out my prior posts, have a great one.

$LAZR | 1/3 - 1/7 $LAZR +17.5
(Over 17.5 for calls)
Rationale: On Jan 5, Luminar Technologies holds a joint press conference at CES with Volvo Cars to discuss their vision of the future of automotive safety and autonomy. Shares of Luminar have rallied in the past after media appearances.

$SNOW | 1/3 - 1/7 $SNOW +348.5
(Over 348.5 for calls)
Rationale: Pennant breakout on the daily chart

$AMD | 1/3 - 1/7 AMD 143 - 144 BOUNCE
Rationale: Bounce off trendline on the daily chart
News catalyst: AMD hosts its 2022 Product Premiere event at CES to highlight innovations and solutions featuring upcoming AMD Ryzen processors and AMD Radeon graphics.

$rblx analysisWhat a lovely bull-flag formed on the daily/4hr time frame, along with a nice 'B shaped' volume profile for the month of December (indication of buyer presence). Bull-flag + ABC correction + .618 volume profile confluence + 21/200 ema chanel = A+ setup.

$mu analysis Sometimes there is no need to get creative. Semiconductors have been hot, and $MU is one of the few that hasn't made a new high yet (although it came close, wicking into supply levels near the all time high of $96.69). The bigger picture here is that price is extended from the 21 day and closed below the 5 day last week. It seems a slight pullback is in order

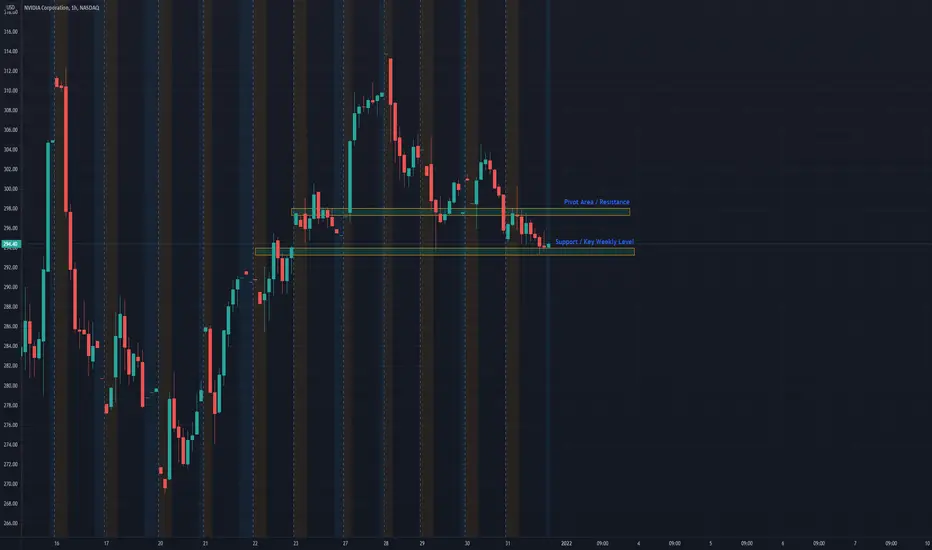
$NVDA, trading it 1/3 For 1/3, intraday trading ideas for options trading; not financial advice, 2 plans for red or green market day.
Break over 298 (entry, long), it can see 306-311 (exit)
Break below 293 (entry, short), it can see 280-285 (exit)
#options #daytrading
Option Trading 101:
Risk what you can lose (0.5%-5%)
Watch buyers and sellers (their interactions & sentiment, ex. exhaustion of buying or selling, etc.) in strikes that you’re watching & the ticker too; this is how YOU manage YOUR trade.
Consider following and checking out my prior posts, have a great one.
$BNTX; trading it 1/3 For 1/3, intraday trading ideas for options trading; not financial advice, 2 plans for red or green market day.
Break over 264 (entry, long), it can see 275-282 (exit)
Break below 251 (entry, short), it can see 233-240 (exit)
#options #daytrading
Option Trading 101:
Risk what you can lose (0.5%-5%)
Watch buyers and sellers (their interactions & sentiment, ex. exhaustion of buying or selling, etc.) in strikes that you’re watching & the ticker too; this is how YOU manage YOUR trade.
Consider following and checking out my prior posts, have a great one.

$ARKK AnalysisAfter a 37 point sell of in $ARKK from a recent pivot high ($125.86), we are starting to see some growth names base and reverse. While the overall trend on $ARKK is still down, the smaller time frames are showing signs of strength and reversal structure. ARKK

Whispers from Options - BTCWe observe weakness/Bears dominating BTC market recently. Options Sentiment Indicator is giving mixed signals (overall we see bullish sentiment from Options traders but more volume is within PUT options still).
4 Virgin VPOCs are awaiting retest and are located above current price in comparison to 1 VPOC below current price - Bullish pressure
area of 46000 is major/key level, worth observing
from Options OrderBook of contracts expiring in 26 days (28th January 2022) - there are no strong resistance levels (!!) - Bullish pressure. However major support levels (a lot of CALL orders awaiting) are relatively low - 35,36 k
on H4 we see multiple Demand Signals coming from VSA Scanner software near 46 000 level

XRT Bullish inclined Naked Puts 17 Dec Expiry (Dec Track 2)Whats The Plan/Trade/Thought
Feels like a safe position given that the market is seeming very bullish at the moment
XRT has also broken a key resistance line and that transforms it into a solid support line
XRT are retail discretionary companies and right now there seems to be alot of optimism. Consumers seem to be find paying for the current rising prices of products. I think will continue with the festive period
Feds are probably not going to increase interest rates in Dec so we can expect that to not be a concern
I Feel
Solid and Confident
Imagine Yourself Taking The Other Side
As a fact the inflation rate is high and it has already impacted wages and prices.
Prices of durable goods are high vs last year
Supply chain issues that are resulting in retailers unable to cope with demand is still not solved and this will have an impact on business that do not have ample reserves to sell
Imagine Yourself As A Neutral Observer
While inflation is a concern the market is showing a lot of bullishness
This feels very straight forward
Look For New Information
Nothing new
How Do I Feel Now
I'm confident to pull the trigger
Trade Specs
Sold 0.65, 85 Put Contracts @ Strike 89
% to Strike 12%
ATR % is Around 21%
BP used 75k
Max Gain: est $5525

VXX Bearish inclined Naked Calls 26 Nov Expiry (Nov Track 1)Whats The Plan/Trade/Thought
Market Bullish Stance
The overall market seems to be back on it's bull run. This is reflected on the SPY and NDX who have both made new highs
Sep Consumer Spending has lost momentum but still grew at 1.4%
Sep Personal income was up 0.9%
These factors, including the upcoming festive year end period. With less COVID19 restrictions should result in an increase in consumer spending with an appitite to accept raising prices (At least for this quarter)
Est price to strike is around 54% which is a pretty good buffer and is around it's previous high. This is shielded by an S&R line at 28.5
I Feel
Confident and safe
I'm happy with the risk profile and it is also 50% hedging my RVLV trade
Imagine Yourself Taking The Other Side
We could be at the bottom and a retracement is a possibility at least short term
We expected Nov's market to be bearish volatile so this bullishness might be short term
Imagine Yourself As A Neutral Observer
Strike to price distance seems safe
If we read the market for what it is now. It is bullish
While some volatility might come as we close Dec due to the US debt ceiling
Look For New Information
US debt ceiling implications and the upcoming review date on the 3 Dec will cause some market volatility. For now while the country has a short reprieve from the threat of default, Yellen said some investments in funds through December 3 will remain suspended
How Do I Feel Now
Ready to enter!
Trade Specs
Sold 70 Calls @ 0.40 - Strike 30
% to Strike 46%
ATR % is Around 12%
BP used 65k
Max Gain: est $2800

USB Bullish inclined Naked Puts 28 Jan Expiry (Jan Track 3)Whats The Plan/Trade/Thought
US Bancorp is an American bank holding company. With the Fed intending to increasing interest rates to combat the high inflation numbers. I expect banks to see an increase in their earnings from this especially near term where consumer sentiment is still bullish.
Already the Nasdaq bank index is up around 32% for the year
I Feel
The market in my opinion is in a bearish range. With drops being deeper than the recoveries. USB and a number of the financial counters like MET, TFC, BK, BAC are in a similar price pattern. Mostly near the bottom of their range.
If the range continues it will also be aligned to my near term POV on the banking sector
Imagine Yourself Taking The Other Side
On the flip side as I do feel we are market wide in a bearish sideways movement. Having USB drop and break the range is also a possibility. Will need to monitor this. Also the price action since 25 Oct 2021 has been bearish.
Imagine Yourself As A Neutral Observer
This trade is really not about up or down but really about trading on the lack of expected volatility. Do we expect defining movements in Jan?
Look For New Information
There is an Earnings release on the 19 Jan that I only realised after I entered the trade. This is very careless of me... I will need to be vigilant during that period. But generally earnings in the past three quarters have beaten estimates
How Do I Feel Now
Somewhat lukewarm with my decision. I believe the uncertainty is due to the 19 Jan Earnings I did not notice. Also while the daily chart is showing a range and I am reacting to it and not predicting a bottom. I am still apprehensive as it can break the range.
Trade Specs
Sold 160 Puts @ 0.25 - Strike 51
% to Strike 10.14%
ATR % is 94%
BP used 81K
Max Gain: est $3896

$MSFT iron condor for 33% profit, 83% PoP #tradingHigh IVR, I'm not leaving money on the table.
Max profit: $250
Probability of 50%Profit: 83%
Profit Target relative to my Buying Power: 33%
Max loss with my risk management: ~$200
Req. Buy Power: $755 (max loss without management before expiry, no way to let this happen!)
Tasty IVR: 80 (ultra high for Microsoft)
Expiry: 50 days
SETUP: IC for $MSFT, because IVR ultra high, collecting 2.5cr
* Buy 1 MSFT Jan21' 290 Put
* Sell 1 MSFT Jan21' 300 Put
* Sell 1 MSFT Jan21' 360 Call
* Buy 1 MSFT Jan21' 370 Call
SAFETY ZONES: : Prev. resistance could act as support at ~$306, prev.ATH could act as resistance at $338.
Stop/my risk management : Closing immediately if daily candle is closing out of the the box, max loss in my calculations in this case could be ~$200.
Take profit strategy: 50% of max.profit in this case with auto buy order at 1.25db
Of course I'll not wait until expiry in any case!
If you liked this article, check my other ideas.
Anyway: HIT THE LIKE BUTTON BELOW , and for fresh option ideas FOLLOW ME( @mrAnonymCrypto ) on tradingview !

$ARKF SHORT PUT for Jan21, high PoP 20% profit #ark #optionsAny kind of ETF naked PUTs are my favorite at high IVR.
My choice for today: ARK Fintech Innovation ETF
Reasons:
- high reward for Jan21 monthly expiry (mangeable with rolling) -> collecting credit
- RSI is already oversold
- breakeven point is far
- PUT strike at 0.618 fib
Max profit: $210
Probability of Profit: 89%
Profit Target relative to my Buying Power: 20%
Req. Buy Power: $1035 (max loss without management before expiry, no way to let this happen!)
Tasty IVR: 73 (very high)
Expiry: 38 days
SETUP : NAKED PUT for $ARKF, because IVR is high, for 0.7cr
* Sell 3 $ARKF JAN21'35 PUT
Management : ROLLING if daily candle is closing below of BE.
Take profit strategy : 70% of max.profit in this case with auto buy order at 0.2db
Of course I'll not wait until expiry in any case!
If you liked this article, check my other ideas.
Anyway: HIT THE LIKE BUTTON BELOW , and for fresh option ideas FOLLOW ME( @mrAnonymCrypto ) on tradingview !

Lemonade "I am shocked"Monthly in Red, Weekly in Blue and short term in Pink
I have seen so many charts but not like this, It has broken all the lows and made a new monthly Low to 40. I really want to be helpful for people who are stuck but this is just another opinion, sometimes you have to see as it is.
Where are we on this? Previously all time low was broken a couple of month before so I had to adjust to fib extension instead of retracement. Now don't take me to 100% extension because that's taking me to negative and 78% is to 14. Very bad.
What else we have? The good part, we are currently at 45 which is higher than previous low 44.11 in 2020 but will it close this month above it or below it. Very important.
Recovery structure in short term does not look promising but possibility for a fake bounce to fail. Know your levels when to get out and get in. Stop loss can be 44 or 40 depends upon the risk you can take.
In short good sign can be: Monthly candle should not make lower low and a doji is better to form a good base
and the bad sign can be: everything you see in the chart continues same way.

UPST Looks Pretttttttty good...UPST lo
Looks like it could be a big mover.. We will see. It's always great to have ones like these to have fun with!
Check out historically the performance of the stock price when certain conditions are met. Right now we are seeing a bullish trend and possibly break out of a brutal downtrend.
