Strategy & Analysis with Options Tool suite kitToday I would like to introduce you all to process of analysis step by step instruments with usage of Options Toolkit Suite. I wrote in my earlier posts what edge can give us data obtained from Options Market. So now let's jump into details and have step-by-step detailed guide. Firstly we need chart layout split to 3, as on three different timeframes we will perform analysis and monitoring for potential trade opportunities.
Process follows:
All starts on D1 timeframe looking for key levels - where we can check Eagle-eye view perspective. Here most important is Options Flow Sentiment indicator (at the bottom) where we look for blue background - it means equal Volume on CALL and PUT options aka Balance on market is set. From those moments in time we take close of the candle/bar - and this is our significant S/R Level. If there is level too close to another one, I skip drawing it just not to make chart too noisy.
Continue on D1 timeframe checking Options flow Sentiment - also looking into sentiment indicator, I check firstly for green/red background. This is self-explanatory showing advantage of Bears or Bulls camps respectively. Then I am looking where is more money on Options flow put - if green line is above red line, it means volume of CALL Options is respectively bigger than PUT ones (aka Options traders put more money on Bullish move). In reverse works the situation for Bears, where red line is above green one.
Check for Virgin VPOCs on M30 - I am looking for untested next day VPOC levels. Those levels are always retested by market = working like a magnet. The only question is when it will happen. It's convenient to know if multiple levels are below/above current price level in order to know the balance/pressure on the market. Also for Intraday Trading, if price passes one of Gamma Levels near VPOC, we can try to trade a move with target on Virgin VPOC.
Mark Demand/Supply Zone on M30 - When we see multiple Bullish/Bearish candles in row so in other words strong impulse on market, I am looking where this move began. When I identify it, first reverse candle before this impulse sets range of Zone. Ok so jumping to example: in case of strong Bullish impulse, in the place where it started I am searching for last Bearish candle before start of this impulse. This candle's High and Low are marking range of the zone. After setting up zone, I am waiting for First Retest of this Zone . In case of Demand Zone (bullish impulse) I play in case of retest Long, in case of Supply Zone (bearish impulse), I play in case of retest Short. Very often we also can observe confluence, where within Zone or in close neighbourhood we will also have present one of Gamma levels. In case of Zone fail during 1st retest, this is also major signal but in direction of breakthrough zone.
Intraday Setups on M15 - Gamma Levels are marking key levels for observation. In general breaking through Gamma level is a signal for potential trade with target on next Gamma Level. Very rarely are passed levels Extreme Low and Extreme High of the Day which are setting typical maximum expected range of the day. Breakthrough Gamma -1/+1 is a signal of anomaly and typical for Trend Day. So if this level won't hold, then I play in direction of breakthrough. Another setup is bounce from Gamma -/+ 0.5 which is often very strong Intraday Level. In case of observed bounce back, target of the trade is Pivot (mid between Gamma -0.25 and +0.25).
Additional confluence factors - I am looking not for quantity, but for quality in case of trades - that's why I take opportunities which are having in common more factors aligned in direction of trade that I plan to take. Therefore when Gamma Level is passed and I have relatively close Virgin VPOC is one additional example. Another one would be Gamma level within or in close neighbourhood of Demand/Supply Zone. Last but not least - VSA Scanner Signals. When I see before Gamma level Demand (signals below candle/bar) or Supply (signals above candle/bar), it can add me additional confluence factor or sometimes push me to avoid taking this particular trade - when I expect Bullish move but I see instead Supply signals.
Options
TSLA pennantSeeing some signs of reversal on TSLA,
As long as price stays outside of the pennant, we can see it moving higher
First big resistance will be at $1000

COIN reversal ?All BTC names have been taking a beat lately, maybe they are about to reverse?
COIN could have started the move already, $171.50 could be a good entry level.
Be aware though there is a trendline in the Daily chart ~$290

$TSLA | WEEKLY WATCHLIST 12/27$TSLA 1W
Everyone is posting the same charts about Tesla this weekend. Just remember that senpai had you covered since the BOTTOM at $900. Expecting continuation early this week into $1082-1092. If we can clear $1100, we have room to $1136 before any pullback. You were warned.

$ROKU | WEEKLY WATCHLIST 12/27$ROKU 1D
Looking really good into this week. Overhead ATH trendline is the key here. Over this, we can see accelerate to $250, $270 and $300.

$PYPL | WEEKLY WATCHLIST 12/27$PYPL 1W
Possible we get a small wedge breakout towards $220-225 this week. However afterwards, R/R favors the bears and we may be in for another leg down to complete the major corrective wave 2. Lots of uncertainty still so be sure to wait for confirmation either way.

$NVDA | WEEKLY WATCHLIST 12/27$NVDA 1D
Similar setup to $AMD here. Anticipating a small dip to mid $280s before shooting up higher towards $300+. Watching for the falling wedge breakout.

$NIO | WEEKLY WATCHLIST 12/27$NIO 1W
Although tempting, I believe I'll hold off this week on an entry. Really want to see reaction in my $25 range first before any LEAP options. Worth noting a weekly hammer candle though.

$MAR | WEEKLY WATCHLIST 12/27$MAR 1W
Safe to say I nailed this one. I'm still long LEAP options since $148 and looking for my targets of $175 and $200 to be realized into 2022.

$FB | WEEKLY WATCHLIST 12/27$FB 1D
Setup reminds me of $AAPL. Stopped at the reverse gp and has room for 1 more leg down to conclude a significant corrective phase. Huge buying opportunity there. A move over $345 invalidates my thesis.

$AMD | WEEKLY WATCHLIST 12/27$AMD 1D
Made a new local high last week, further confirming my bull thesis. Now, looking for a small pullback into the mid-high $130s for a buying opportunity to $159.

$AAPL | WEEKLY WATCHLIST 12/27$AAPL 1D
Paused last week at the reverse gp. Potential local tops here at $177 or $179 for a final wave C down to complete wave 4. A new ATH would invalidate this thesis.

$ROKU | Watchlist #4 | 12/27 - 12/31 ROKU +235
(Over $235 for calls)
Technical analysis: Bull flag breakout

$MARA | Watchlist #3 | 12/27 - 12/31 MARA +39
(Over 39 for calls)
or 38 bounce
(Bounce on 38 level for calls)
News Catalyst: "Marathon Digital to Expand Hashrate by 600% With Record Purchase of Bitcoin Miners" -
www.coindesk.com

$NKLA | 12/27 - 12/31 | Watchlist #2 NKLA +11.3
(Over 11.3 for calls)
or 10.8 bounce
(Bounce off 10.8 levels for calls)
News Catalyst: "Nikola Gets Order For 10 Nikola Tre With An Option For Up To 100" -https://insideevs.com/news/556723/nikola-tre-loi-100-trucks/

$MU | Watchlist #1 | 12/27 - 12/31 MU 94 BOUNCE
or 92.7-93 BOUNCE
Strategy:
Post earnings report rally
Buy into weakness at the bounce levels
News Catalyst: "Micron Technology (MU) shares were up nearly 5% to trade at $94.84 on Thursday, as more than 25 million shares changed hands shortly before 2:30 p.m. EST. Over the past five trading sessions, Micron has risen more than 16%, compared to a 1.7% gain for the S&P 500." - seekingalpha.com

Options Medium-term Week Review Let's jump to analyse the data from Options market and scan main markets from D1 timeframe perspective:
DAX - opposite signals from Options flow, as in general we have recently present Bullish sentiment for last 3 sessions, but Option Volume flow still points to Bearish signal (as PUT Volume aka red line is higher/above CALL Volume aka green line). Virgin VPOCs are present on both sides - so above and below current price level. On last session DAX broke significant S/R Level (identified by balance point where PUT and CALL Volume were equal - my indicator is pointing such moments in time). As long as we're above 15616, price should go in direction of Virgins on 15907 and 16165. However careful observation is required further on German Index.
S&P500 - Bullish sentiment from Options flow appeared recently and CALL Volume is increasing in comparison to PUT Volume - when green line moves above red line it will confirm fully Bullish sentiment. On the other hand we have multiple Virgin VPOCs levels below current price, what add odds to Bears Camp. Major Support Area is 4477.75-4507 zone.
Gold - from quite a long time we see Bullish sentiment from Options Flow and PUT Volume should be soon lower than CALL Volume what adds confluence to Bullish move. Major Support zone is now 1783.5-1795.3 while still we have multiple Virgin VPOCs to retest above current price Level. Gold should climb up in the area of last major top on D1, around 1875.
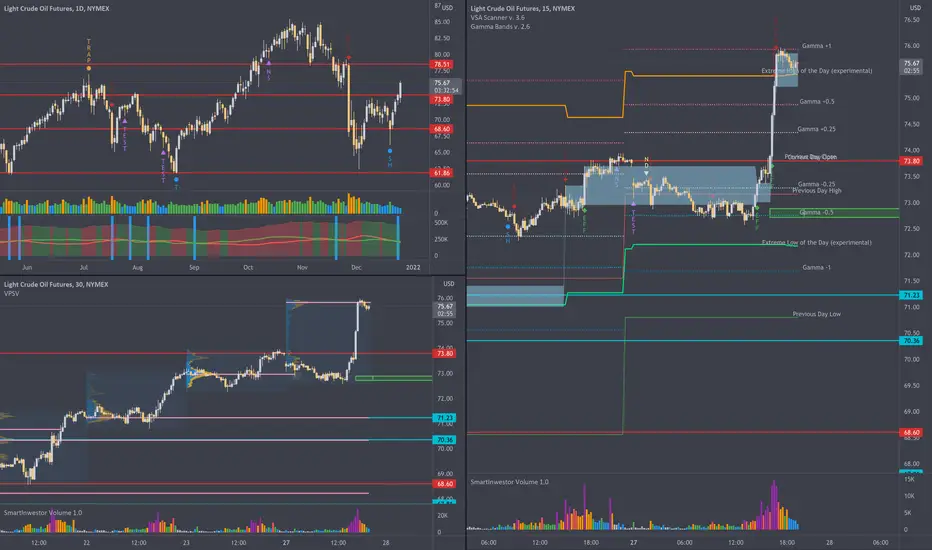
Oil - Bullish sentiment from Options flow and recently PUT Volume reached balance vs CALL Volume. It opens road for up move. Currently we're on major resistance (73.79) so small correction could appear, but overall Oil prices should continue climb up. Next major resistance is on 78.45
Just for reference, blue lines are Virgin VPOCs and red lines are major S/R Levels marked in moment of time where PUT Volume was equal to CALL Volume from Options flow.
Options are giving us a big edge, when only we can properly analyse the data coming out of this market. My tools are analysing it and display end-results in fully objective way for newbie traders as well as for experienced ones. Please bear in mind, I am not predicting future but write assumptions only that can happen but doesn't need to. Trader need to be prepared for different scenarios.

Trade Plan 27 Dec 21 onwards : Bank NiftyLevels as mentioned on the chart
Daily Followup chart
Lower long setup
Views are for ‘’EDUCATIONAL PURPOSE ONLY’’ trade at your own risk.
"Always Respect Risk"
Happy Trading
Jai Hind

possible reverse HEAD AND SHOULDERS IN NIFTY.use the 15 min candle closing to enter in trade if it closes above a line drawn
stop loss 5 %
target 17 %

$NFLX - Channel possible breakout/w a run up prior to earningsOnly thing missing here is volume on that breakout, but that can come any moment, NFLX has the tendency to run up before earning, and this could be no difference.
RSI Divergence as a positive indicator too.
Stop loss at structure.
Great risk reward trade, short hold, sell before ER
Great also for selling credit spreads

Understanding OptionsTo gain a grasp on options it is essential to understand profit/loss diagrams for the various options whilst also understanding why they display such diagrams. Understanding profit/loss diagrams can help you gain insight into arbitrage trading(which is beyond the scope of this post) and will help you hedge various types of positions. We will first discuss the difference between being long from short, and will conclude why the diagrams are the way they are.
LONG OPTIONS
When you are long an option, you are paying a specified amount of money upfront. What does this mean? This means you can only lose the amount of money that you used to initiate the trade. This is known as having limited loss. Upon paying this premium you have the opportunity to gain infinite profits and will reap such profits if the underlying asset goes in your desired direction, hence you are paying a premium to acquire greater opportunity.
SHORT OPTIONS
Being short options is quite different than being long options. Instead of paying money upfront for the opportunity of large profits, you actually receive money upfront. This is also known as having limited profits. Once you place a short position you already have your max profits set in place. If I receive money upfront then how do I make a profit? Your endeavor as an option seller is for the person on the other side of the trade to be at a loss. Options are a zero-sum game. There are those that profit off of a trader's loss and there are those that acquire that loss. When you are selling an option there is someone on the other side of the trade that is long the option. This is important because as we have learned earlier, long options have infinite profit potential. This means that as an option seller you technically face the probability of having unlimited losses. For example, if you are selling a call there is someone that has purchased the call that you sold. If their call becomes unprofitable then you can buy back the call to offset the call that you have sold, acquiring a net profit. But if their call becomes profitable then you will have to offset the call that you sold, hence buying back the call at a larger price for a net loss.
APPLYING KNOWLEDGE
Lets now take a look at the option's profit/loss diagrams above. The Long Call displays a diagram in which the underlying asset must rise for you to make a profit, with the benefit of having limited losses. The Long Put displays the need for an asset to go down to reap a profit with the added benefit of only having a limited amount that can be lost. The Short Call displays the acquiring of a limited amount of profit with the desire for the underlying to not rise or else an infinite amount of loss will be faced. The Short Put displays the acquiring of a limited amount of profit with the desire for the underlying asset to not go down or else unlimited losses can be faced.
p.s A great way to remember these diagrams is to picture them forming a diamond shape. The image above depicts that of a diamond formation which can help you form new profit/loss diagrams for advanced strategies. It is also very helpful to understand the rights and obligations that the various type of options have.

$EEM naked PUT, high PoP #option #trade #Trades #OptionsTrading The iShares MSCI Emerging Markets ETF is a good choice for today high IVR credit trade. High PoP, very predictable profit.
Reasons:
- high reward for Jan21 monthly expiry (mangeable with rolling) -> collecting credit
- breakeven point is far
- RSI is oversold.
Max profit: $92
Probability of 50%Profit: 84%
Profit Target relative to my Buying Power: 14%
Req. Buy Power: $633 (max loss without management before expiry, no way to let this happen!)
Tasty IVR: 104 (very high)
Expiry: 49 days
SETUP : NAKED PUT for $EEM, because IVR is high, for 0.92cr
* Sell 1 $EEM JAN21'46 PUT
Management : ROLLING if daily candle is closing below of BE.
Take profit strategy : 50% of max.profit in this case with auto buy order at 0.46db
Of course I'll not wait until expiry in any case!
If you liked this article, check my other ideas.
Anyway: HIT THE LIKE BUTTON BELOW , and for fresh option ideas FOLLOW ME( @mrAnonymCrypto ) on tradingview !

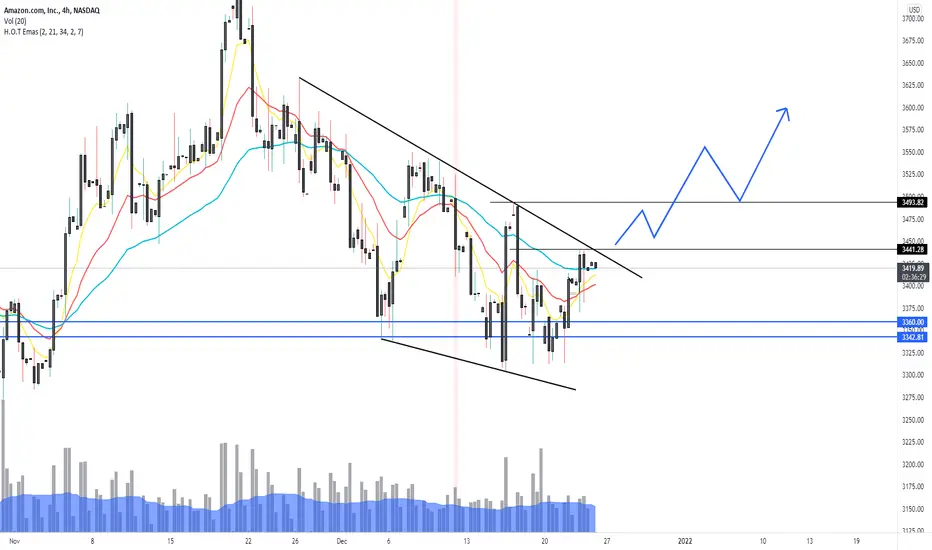
AMZN trying to breakoutAMZN is trying to break out of a pennant,
Watching price above 3441 for continuation.