11/29 - 12/03 | $MRNA | Watchlist #3$MRNA $308 or $300 bounce
(If we get below then reclaim these levels, take a position for calls)
Price targets:
308->310
300->305
Technical analysis: Bounce off pivot point around 308 area or bounce off psychological level at 300
Rationale: With increasing news of a new virus variant, vaccine stocks are rallying so there is built up potential for more momentum
Options

11/29 - 12/3 | PTON | Watchlist #2 $PTON +47
(Over $47 for calls)
Price targets: $48, $50
Technical analysis: Bounce off pivot point on the daily chart
Rationale: With increased news of a new virus variant, stay-at-home stocks could continue momentum upwards

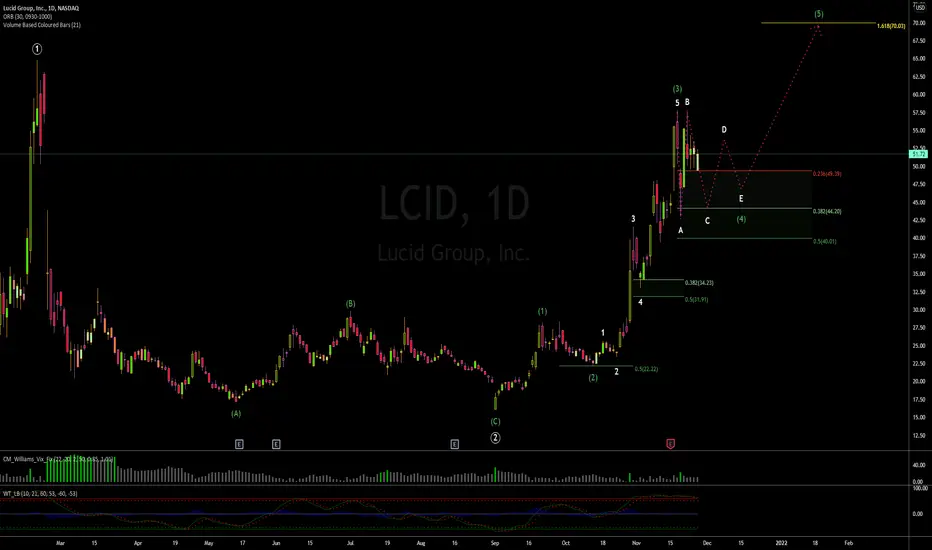
$LCID | WEEKLY WATCHLIST 11/29Following Tesla's chart very well and have been tracking the two together. Looks to be a wave C in progress. Still waiting patiently before pulling the trigger to go long on this one.
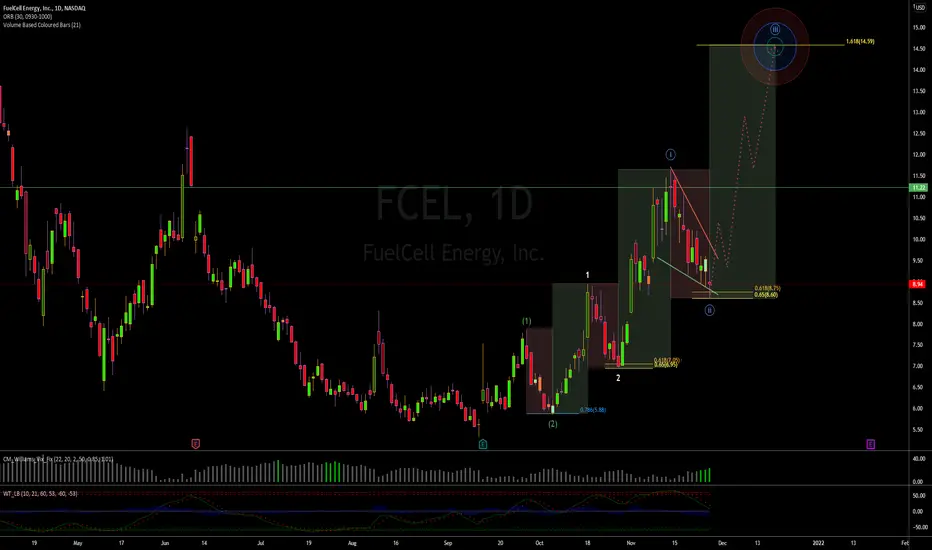
$FCEL | WEEKLY WATCHLIST 11/29Triple nested 1-2 setup sitting on falling wedge support. As long as $8.60 holds, I expect another leg higher to $14.59 by December 17th.
Yes, I am aware this is quite an aggressive prediction, however I'm using past data with how FCEL likes to behave indicated with the red/green boxes.
11/29 | QQQ | Watchlist #1 QQQ -387
(Below 387 for puts)
Price targets: $383, $375
Technical Analysis: QQQs has been in a linear regression channel for the past year so under 387 will begin retesting the bottom of the channel
Rationale: With increased news of a new covid variant, if QQQs continue to sell off, the plan is to buy and hold a $380 put for a month's expiration 12/24

$AMZN | WEEKLY WATCHLIST 11/29Like Apple, we expected Amazon to pullback while most were super bullish. A bit more uncertainty with this one, as we can call this pullback either a wave 4 (if we hold 50%) or another nested 1-2 (if we hold $3350-3440)
No longs for now.

$AAPL | WEEKLY WATCHLIST 11/29Short-term, Apple doesn't look too hot. False breakout last week while everyone was super bullish, however we saw this one coming and didn't rush in. I'm looking for a retest of the diagonal breakout which also lines up with the golden pocket. Daily Oscillators need to cool off as well.
If markets prove to be strong through the end of the year, we may get a shallower retrace for wave 2. Target above remains at $180+. Be patient friends.

Weekly Analysis 29th Nov - 4th Dec - horizon after Black FridayFriday's Black Friday introduced significant valuations also on the markets and we met with large anomalies also from the perspective of the Option flow, which we automatically analyze with our software. While we observe a strong directional movement already during the Globex session, it is not worth fighting the trend and it is much safer to try to join it wisely. Anyway, the Gamma Intraday strategy assumes that in the event of breaking the extreme level, we do not fight the trend but try to join the movement. Gamma -1 was broken in the markets during the Overnight / Globex session.
From a medium-term perspective, it's worth going back to the Virgin VPOC levels to assess the potential for moves. The market will try to retest them, the only question is when it will happen. Let's look at the situation on the main instruments:
DAX - a clear downward trend that was deepened during Friday's session. The price is close to the 14946 level, so it should be retested sooner rather than later. The remaining Virgin VPOC levels are above the current price, showing upside potential on the German index - starting at 15,909 with a potential to 16,158.
S & P500 - Friday's panic on the American stock market may only be the beginning of the sell-off. It has been known for a long time that the FED has been pumping sky-high amounts of money for a long time, which causes continuous increases in the S & P500. From the Virgin VPOCs perspective, there is a lot of potential for declines through 4471.50, 4310.25 and ending at 4234.25. This does not negate long-term gains, but it is definitely worth keeping an eye on the downside opportunities.
Gold - despite declines in the main stock exchange indices, we would expect gold to increase significantly in line with the inverse correlation. However, we saw a moderate drop in price on Friday's session and only the end showed the demand entry. Relatively close is the 1763 level, one of the Virgin VPOCs below the current gold price (at the time of writing). The growth potential of Gold looks much more interesting due to Virgin VPOC points at 1817.2 through 1863, 1875.7 with potential at 1885.2
Crude oil - a clear discount on "black gold" on Black Friday, which will surely please drivers at gas stations;) From the perspective of potential, there is a lot of room for growth, with the price reaching 81.37 and 84.22.

Volatility - Convergence, Reverse Calendar SpreadIdea for VIX:
- Spot VIX sub 17 (quickly rising), 2 point spread has appeared between spot VIX and front month, with a high degree of contango in term structure, and a significant spread between Treasury volatility (MOVE).
- Daily Roll Yield 0.10~
- Possible to either capture spread, or have a low risk bullish bias.
- Positive correlation right now with Vol and Equities. High demand.
Strategy:
- VXX-VXZ spread, reverse calendar spread, front month-spot (ES or spot VIX options) spread.
- Front month VIX, spot hedged (ES or spot VIX options).
GLHF
- DPT

S&P500 Iron Condor 60% profit 76% PoP50, high IVR for #optionsI just can't resist the very high IVR for large ETFs, like SPY.
My most common strategies these at corrections are the Iron Condors, neutral or negative delta.
SAFETY ZONES: 200MA could act as support, ATH could act as resistance.
Max profit: $375
Probability of 50%Profit: 76%
Profit Target relative to my Buying Power: 60%
Max loss with my risk management: ~$150
Req. Buy Power: $625 (max loss without management before expiry, no way to let this happen!)
Tasty IVR: 49 (ultra high for S&P500)
Expiry: 56 days
SETUP : IC for , because IVR ultra high, for 3.75cr
* Sell 1 SPY Jan21' 420 Put
* Buy 1 SPY Jan21' 430 Put
* Buy 1 SPY Jan21' 480 Call
* Sell 1 SPY Jan21' 490 Call
SETUP: IC for SPY, because IVR ultra high.
Stop/my risk management : Closing immediately if daily candle is closing out of the the box, max loss in my calculations in this case could be ~150$.
Take profit strategy: 50% of max.profit in this case with auto buy order at 1.88db.
Of course I'll not wait until expiry in any case!
If you liked this article, check my other ideas.
Anyway: HIT THE LIKE BUTTON BELOW , and for fresh option ideas FOLLOW ME( @mrAnonymCrypto ) on tradingview !

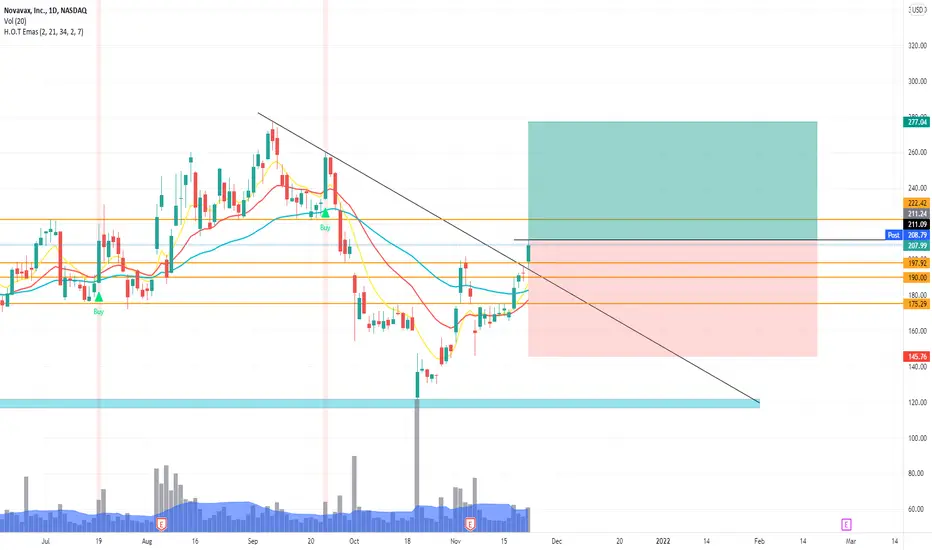
NVAX breakoutNVAX finally managed to breakout.
I will be looking for an entry tomorrow above today's high

Very Concerning Chart for the S&P FuturesWe are seeing a new variant concerning many scientists emerging in South Africa.
My opinion is leaning towards that this could be something much bigger than what the market may initially shrug off. I expect a very red day tomorrow as the implications for this are massive with the supply chain crisis and the labor shortage.
Be safe!

$AMZN | 11/26 | Watchlist #2 $AMZN +$3588 or $AMZN +3620
(Over $3588 for calls)
(Over $3620 for calls)
Price targets:
$3588 -> $3600
$3620 -> $3650
Technical analysis: Double bottom off pivot point
Rationale: Black Friday shopping

$AAPL | 11/26 | Watchlist #1 $AAPL +$162.2
(Over $162.2 for calls)
Price targets: $163, $164
Technical analysis: Bull flag on the hourly chart


$NIO | 11/25 | Watchlist #2 $NVDA +$43
(Over $43 for calls)
Price targets: $44, $44.8
Technical analysis:
- Cup and handle on the hourly chart

$GME | 11/25 | Watchlist #1 $GME +$220 / -$210
(Over $220 for calls)
(Below $210 for puts)
Price targets:
Bull case: $228
Bear case: $205
Technical analysis:
Bull case: Bounce off the trendline
Bear case: Double top on the daily chart

BBY Fib Retracement and Prediction BBY had a heavy drop for earnings on Tuesday. I was lucky enough to have grabbed some lotto puts before close and ended up making 600%. After that, I added $125 calls 12/17 around the $117.50 area at 1.95 once I saw a reversal confirmation and that it was bouncing off the 200ma on the daily. What I expect to happen tomorrow is BBY to push up to the 124.38 area and then go back down from there. If I see it resisting at the fib, I will sell my calls for profit and switch to puts. If it is able to break 124.38 and the mental barrier of 125, I will continue riding my calls until I see a reason to exit.

$RIVN will be $151 by Christmas$1.2T infrastructure bill passing
Their R1S and R1T EV pickup truck deliveries to start Jan 2022
Cybertruck keeps getting delayed and the F150 ligtning is looking more like June 2022.
EV pickup trucks are the next natural evolutionary step in transition to low carbon autonomous driving vehicles…. then comes the Tesla Semi to take over the world.

PNC BreakoutAfter a sharp retracement, PNC just brokeout today.
Watching it going into tomorrow session, above todays high.
Room to re-test ATH

Beyond Meet Monthly Put Options PlayGetting a few late December Puts at the strike of $60 I think we are going to trend over towards the 1.618 fib extension over the next few weeks.

ETH still in a downtrend till FridayEthereum is still finishing its last lag of its ABC move to the downside with a C move incoming that might hurt some leveraged traders out there. With futures expiring this Friday it would make sense for ETH to trade lower than its current price levels. My(!) max pain price based on info I have would be around 3850. So I expect ETH to be around that price point on Friday afternoon after finding support in the lower order block (yellow). If however, ETH holds in the upper order block or above this scenario is invalidated. Keep an eye on the bear flag break and the price action in the order blocks. This last move is a shake out for the leveraged traders and options traders and will scare the market into bearish sentiment and thus the perfect time for the market maker to step in to reverse the trend for (possibly) a move to a new ATH.
IMPORTANT: this is not financial advice, trade or invest based on your own risk and research.
