SE Sea Limited Options Ahead of EarningsIf you haven`t sold SE here:
Then analyzing the options chain and the chart patterns of SE Sea Limited prior to the earnings report this week,
I would consider purchasing the 60usd strike price Calls with
an expiration date of 2023-8-18,
for a premium of approximately $3.45.
If these options prove to be profitable prior to the earnings release, I would sell at least half of them.
Looking forward to read your opinion about it.
Optionsplay

ILMN Illumina Options Ahead of EarningsAnalyzing the options chain and the chart patterns of ILMN Illumina prior to the earnings report this week,
I would consider purchasing the 195usd strike price Calls with
an expiration date of 2023-9-15,
for a premium of approximately $8.15.
If these options prove to be profitable prior to the earnings release, I would sell at least half of them.
Looking forward to read your opinion about it.

SBUX Starbucks Corporation Options Ahead of EarningsIf you haven`t sold the Exposure to China news:
or reentered the past earnings:
Then analyzing the options chain and the chart patterns of SBUX Starbucks Corporation prior to the earnings report this week,
I would consider purchasing the 100usd strike price in the money Calls with
an expiration date of 2023-9-15,
for a premium of approximately $4.50.
If these options prove to be profitable prior to the earnings release, I would sell at least half of them.
I`m considering in the money calls and a longer expiration date because its options chain is just slightly bullish.
Looking forward to read your opinion about it.

ENVX Enovix Corporation Options Ahead of EarningsAnalyzing the options chain and the chart patterns of ENVX Enovix Corporation prior to the earnings report this week,
I would consider purchasing the 20usd strike price Calls with
an expiration date of 2023-9-15,
for a premium of approximately $2.55.
If these options prove to be profitable prior to the earnings release, I would sell at least half of them.
Looking forward to read your opinion about it.

NEM Newmont Corporation Options Ahead of EarningsAnalyzing the options chain of NEM Newmont Corporation prior to the earnings report this week,
I would consider purchasing the 42.5usd strike price Calls with
an expiration date of 9/15/2023,
for a premium of approximately $1.11.
If these options prove to be profitable prior to the earnings release, I would sell at least half of them.
Looking forward to read your opinion about it.

WFC Wells Fargo & Company Options Ahead of EarningsIf you haven`t sold WFC here:
or bought it here:
Then Analyzing the options chain of WFC Wells Fargo & Company prior to the earnings report this week,
I would consider purchasing the 42.5usd strike price Puts with
an expiration date of 2023-8-18,
for a premium of approximately $1.42.
If these options prove to be profitable prior to the earnings release, I would sell at least half of them.
Looking forward to read your opinion about it.

SGH SMART Global Holdings Options Ahead of EarningsAnalyzing the options chain of SGH SMART Global Holdings prior to the earnings report this week,
I would consider purchasing the 30usd strike price Calls with
an expiration date of 2023-9-15,
for a premium of approximately $1.40.
If these options prove to be profitable prior to the earnings release, I would sell at least half of them.
Looking forward to read your opinion about it.

DRI Darden Restaurants Options Ahead of EarningsAnalyzing the options chain of DRI Darden Restaurants prior to the earnings report this week,
I would consider purchasing the 160usd strike price Puts with
an expiration date of 2023-7-21,
for a premium of approximately $2.67.
If these options prove to be profitable prior to the earnings release, I would sell at least half of them.
Looking forward to read your opinion about it.

DOCU DocuSign Options Ahead of EarningsIf you haven`t sold DOCU here:
or here:
Then Analyzing the options chain of DOCU DocuSign prior to the earnings report this week,
I would consider purchasing the $57.50 strike price Puts with
an expiration date of 2023-6-16,
for a premium of approximately $4.30.
If these options prove to be profitable prior to the earnings release, I would sell at least half of them.
Looking forward to read your opinion about it.

WOOF Petco Health and Wellness Company Options Ahead of EarningsAnalyzing the options chain of WOOF Petco Health and Wellness Company prior to the earnings report this week,
I would consider purchasing the 9usd strike price Puts with
an expiration date of 2024-1-19,
for a premium of approximately $1.20
If these options prove to be profitable prior to the earnings release, I would sell at least half of them.
Looking forward to read your opinion about it.

EURCAD - FOREX OPTIONS DAYTRADING - Long ideaEURCAD - FOREX OPTIONS DAYTRADING - LONG
Buy suggestion on the pair, going for the previously indicated bullish goal of 1.5110, following the targets as displayed on the chart.
Heed your DD!

PEP PepsiCo Options Ahead Of EarningsIf you haven`t bought PEP here:
Then analyzing the options chain of PEP PepsiCo prior to the earnings report this week,
I would consider purchasing the 185usd strike price Calls with
an expiration date of 2023-5-19
for a premium of approximately $3.60.
If these options prove to be profitable prior to the earnings release, I would sell at least half of them, I expect a retracement afterwards.
I am interested to hear your thoughts on this strategy.

GBPNZD - Bullish Stance despite initial bearish pressureGBPNZD -
Despite the current bearish pressure on the pair due to the asset's allegedly impending Double Top formation, recent estimates indicate that the 2.0045 level is the best for buying again. However, since a trial is under progress, prices might not reach that point before purchasing picks back up.
Though it appears to be a double top, technically it actually isn't; at least, it's not suited for trading decisions, thus the so-called double top formation is destined to fail at some point...
To summarize, buy the dips on the pair with an eye toward the 2.089xxxx level as a long-term target.
Heed your DD!

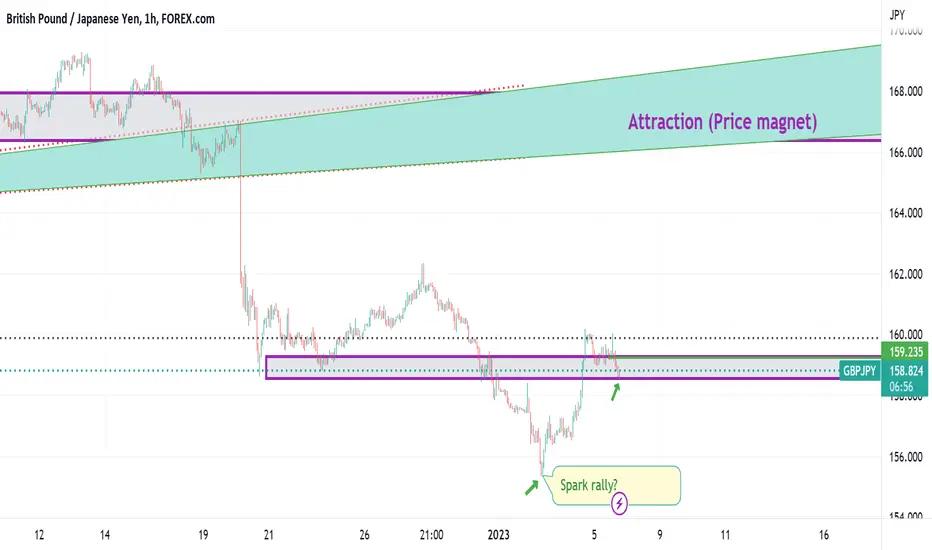
Try Longs - GBPJPYGBPJPY Options Forex
Longs in the air on the pair, following the existing stance from related ideas attahed!
Heed your DD!
FAST Fastenal Company Options Ahead Of EarningsLooking at the FAST Fastenal Company options chain ahead of earnings , I would buy the $52.5 strike price In the Money Puts with
2023-8-18 expiration date for about
$3.80 premium.
If the options turn out to be profitable Before the earnings release, i would sell at least 50%.
Looking forward to read your opinion about it.

LW Lamb Weston Holdings Options Ahead Of EarningsLooking at the LW Lamb Weston Holdings options chain ahead of earnings , I would buy the $100 strike price Puts with
2023-5-19 expiration date for about
$2.30 premium.
If the options turn out to be profitable Before the earnings release, i would sell at least 50%.
Looking forward to read your opinion about it.

NKE NIKE Options Ahead Of EarningsIf you haven`t sold NKE here:
or reentered here:
Then you should know that looking at the NKE NIKE options chain ahead of earnings, I would buy the $115 strike price Puts with
2023-3-24 expiration date for about
$2.40 premium.
If the options turn out to be profitable Before the earnings release, I would sell at least 50%.
Looking forward to read your opinion about it.

Gold XAUUSD Sell FFF
Gold/USD Spot - XAUUSD - Options - FX
Crazy Francis getting furious for a FF Fakey on Gold with deep projection for 1815 eventually; with intial TP at 1915 - 1909 levels with SL above 1945. Currently pricing at 1937.
Just a vista, here. Observe your DD!

SNBR Hedged Options StrategyPopular smart bed company Sleep Number sells beds, mattresses, pillows and bedding related products directly to customers via 600+ retail stores, telephone order, and e-commerce. Adjustable temperature, firmness, motion sensing and automatic contouring, even snoring prevention technology are part of their luxury product catering to an aging population in the middle of a health and wellness boom -- with sleep as an increasingly buzzier part of the conversation. Americans buy 16+ million new mattresses a year, spending an average of ~$1000 per unit, making it a $12.55 billion industry. More people are relocating due to job/work-from-home opportunities and changing real estate trends (opting to buy a new mattress instead of moving an old one) -- the projected steady growth could become a surge. SNBR reports earnings Wednesday after market close, and posted beats for the previous 2 Q's. Here's one argument for the stock being undervalued.
Technically minded investors might also see some promising chart patterns forming as well, and a buying opportunity after a major selloff in the last two years. However, with its recent loss of CFO and announcement that chip shortages were a challenge, an investment in SNBR would not be without uncertainty.
Here's an options investing strategy that offers both downside protection and upside potential. Make a fixed 12% (22% annualized) at maturity as long as SNBR does not fall more than 23%. Further protection: SNBR can fall 31% through expiration before you start to lose any money.
Hedged like this:
Sell 2 $25 puts
Exp 9/15/23
Capital requirement: $4472

BKI hedged options strategyBlack Knight, Inc. provides integrated software, hosting, data, and analytics services for the mortgage industry. Subsidiaries include mortgage and home equity loan application platform MSP, customer account app Servicing Digital, retention and liquidation app Loss Mitigation, loan origination systems Empower and LoanCatcher, and investor/broker community LoanSifter PPE. Black Knight also offers property ownership and lien data, automated valuation models, collateral risk scores, multiple listing service, and eSign, eClosing, and remote online notarization (RON) solutions, with plans to integrate with Wolters Kluwer's eNote and eVault for complete digitization of the mortgage application and closing process.
TA-oriented investors will note a few optimistic patterns forming, as well as the CCI indicating an uptrend. But BKI also faced opposition and anti-trust regulation when it announced that it would join mortgage technology industry giant Intercontinental Exchange ICE (owner of Ellie Mae as well as the NYSE). With increased interest rates and housing inflation, will the mortgage industry take a hit?
After earnings results were released Tues morning, here's a strategy that offers some downside protection while maintaining growth potential.
Make a 10% yield (26% annualized) unless BKI falls more than 14% to below $54.59.
Start to lose only if BKI falls by more than 19% to below $51.76 as of 7/21/23.
Buy 1 $40 put
Sell 2 $55 puts
Exp 7/21/23
Capital requirement: $6,352

EOG Resources Options Ahead of EarningsLooking at the EOG Resources options chain ahead of earnings , I would buy the $125 strike price Calls with
2023-3-17 expiration date for about
$2.60 premium.
If the options turn out to be profitable Before the earnings release, I would sell at least 50%.
Looking forward to read your opinion about it.

GOLD XAUUSD Sell prep, Caution!XAUUSD GOLD FOREX COMMODITIES METALS OPTIONS
Despite the asset's recent price decline, signs of strength have emerged. However, estimates imply that another bearish leg could occur, targeting the 1815 Francis Sell objective and perhaps falling below 1800.
A bearish move similar to that of November 2020 could be in progress, and if so, it would aim for below the 1800 level. In any case, there will be an explosion, and it would not be desirable to enter into a heated argument with furious ....
Heed your DD!

CSCO Cisco Systems Options Ahead of EarningsAfter my last Price Target was reached:
Now looking at the CSCO Cisco Systems options chain ahead of earnings , I would buy the $45 strike price Puts with
2023-4-21 expiration date for about
$1.57 premium.
If the options turn out to be profitable Before the earnings release, I would sell at least 50%.
Looking forward to read your opinion about it.
