Ethereum Struggles to Complete above the 0.786 Bearish 5-0 ZoneWhile on the intra-bar price action on ETH has gotten pretty excited above the 0.786 it is still worth considering that ETH has not completed any bars above the 0.786 since the breakout and that at a moments noticed much of the current price action above the main 0.786 PCZ could later find itself being filtered out of the Renko charts as a whole depending on how many Average True Ranges above the 0.786 PCZ ETH possible move.
Based on the fact that the current candle is simply still in the projection phase I'd caution longs here and remain accumulative of longer dated puts. There is also a 2x leveraged ETF of ETH called ETHU which has OTM monthly call options trading at 20-40 dollar premiums. I'd consider farming off of those premiums in the form of Bear Vertical Spreads as a way to hedge off the costs of holding the long puts.
Overall, we are still trading at the PCZ of the Bearish 5-0 which seems to also be in the similar shape of a Bearish Head and Shoulders pattern; the measure move of which could take ETH down to around $355 upon the break of $1,600
Optionsstrategies

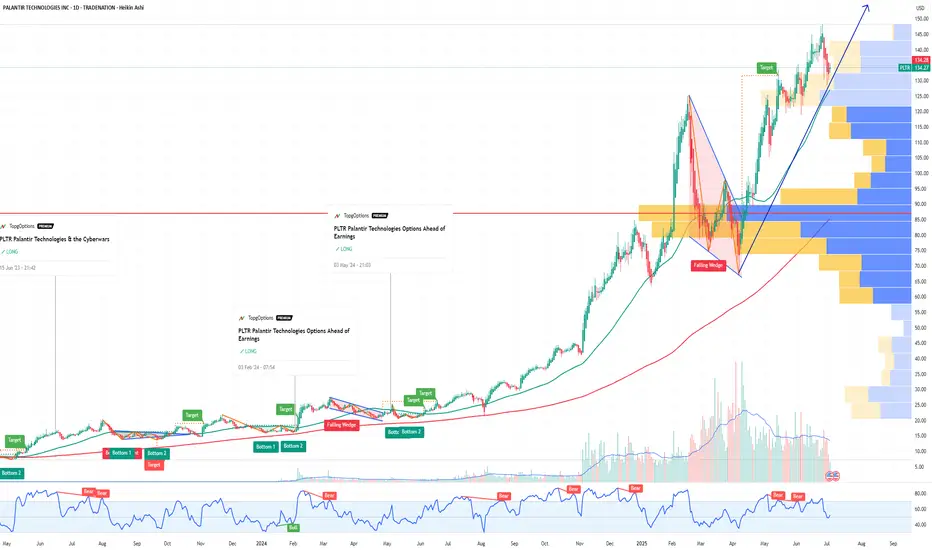
Why Palantir (PLTR) Could Be the NVDA of Government AI If you haven`t bought PLTR before the massive rally:
Palantir Technologies (PLTR) is proving it’s more than just another AI hype play — it’s becoming a core piece of the secure AI infrastructure for governments and large enterprises worldwide.
Key Bullish Arguments
1) Strong Government Moat
PLTR’s deep relationship with the U.S. government, NATO, and allies provides sticky, long-term revenue streams. In an age of geopolitical tension, this is exactly the type of mission-critical AI spending that stays funded.
2) Expanding Commercial Footprint
The commercial segment is no longer a side project. Palantir’s Foundry and Apollo platforms help enterprises deploy AI at scale — securely, in-house, and without sending sensitive data to open systems. Recent deals in healthcare, energy, and critical infrastructure show they’re broadening their customer base.
3) Profitability & Balance Sheet
Palantir is GAAP profitable for six consecutive quarters, with strong free cash flow and zero debt. For a growth stock in AI, this gives it rare staying power if macro conditions tighten.
4) Technical Strength
The stock broke out above ~$125–$130 support and is now testing key resistance in the $140–$148 range. Weekly momentum remains bullish, and institutional accumulation (A/D line) remains strong.
5) AI Tailwinds Remain
While the general AI trade has cooled for some names, PLTR’s unique moat in secure and domain-specific AI makes it more defensible than generic “AI SaaS” stocks. New contracts or AI platform updates could reignite momentum this summer.
Possible Summer Catalysts
New multi-year government deals — especially in defense and cybersecurity.
Major commercial partnerships — especially in healthcare or energy.
AI platform upgrades — more integrations with LLMs or domain-specific AI.
Inclusion in AI-focused ETFs — or further index rebalancing inflows.
Disclosure: I am part of Trade Nation's Influencer program and receive a monthly fee for using their TradingView charts in my analysis.
JD Options Ahead of EarningsIf you haven`t bought JD before the recent rally:
Now analyzing the options chain and the chart patterns of JD prior to the earnings report this week,
I would consider purchasing the 32.50usd strike price Calls with
an expiration date of 2026-1-16,
for a premium of approximately $3.10.
If these options prove to be profitable prior to the earnings release, I would sell at least half of them.
Disclosure: I am part of Trade Nation's Influencer program and receive a monthly fee for using their TradingView charts in my analysis.

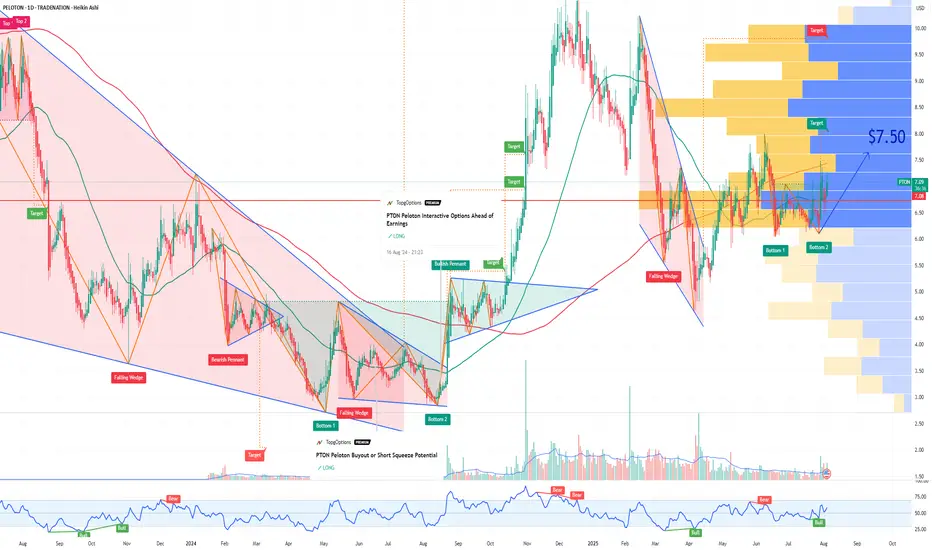
PTON Peloton Interactive Options Ahead of EarningsIf you haven`t bought the dip on PTON:
Now analyzing the options chain and the chart patterns of PTON Peloton Interactive prior to the earnings report this week,
I would consider purchasing the 7.50usd strike price Calls with
an expiration date of 2025-8-8,
for a premium of approximately $0.46.
If these options prove to be profitable prior to the earnings release, I would sell at least half of them.
Disclosure: I am part of Trade Nation's Influencer program and receive a monthly fee for using their TradingView charts in my analysis.
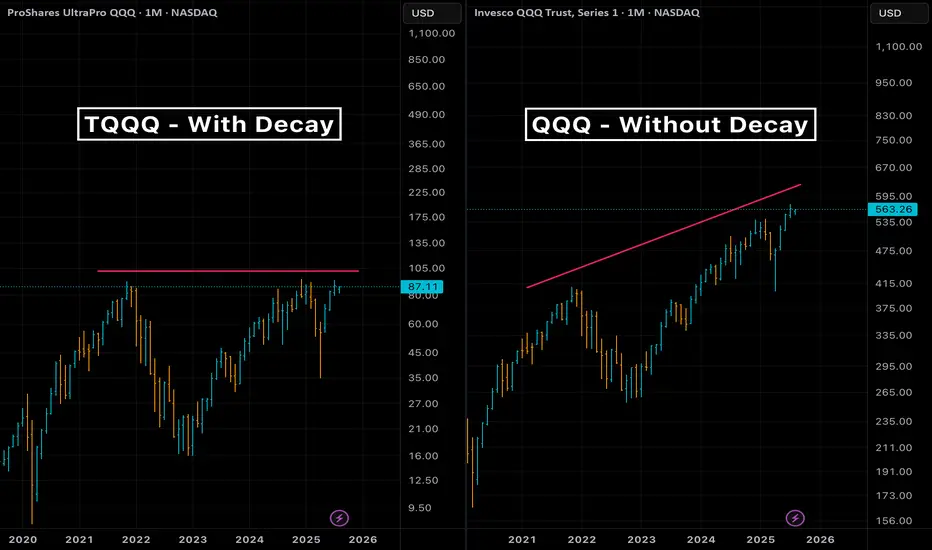
Turning leveraged ETF decay into preyWelcome to this guide on harnessing the natural decay in leveraged ETFs as a strategic edge, rather than fighting against it. We’ll assume you have a basic understanding of options and are comfortable using at-the-money (ATM) strikes as a conservative reference point—advanced users can tailor strike selection to their own edge.
Overview of Leveraged ETFs
What they are and how they reset
• Leveraged ETFs (e.g. NASDAQ:TQQQ , NASDAQ:SQQQ ) aim to deliver a constant multiple (×2 or ×3) of daily returns of an index.
• Inverse ETFs provide –2× or –3× daily exposure without using options.
• Daily reset and compounding create path dependency, leading to “decay” over multi-day holds.
The Decay Mechanism
A quick reminder
• Volatility drag (aka “gamma decay”) causes leveraged ETFs to underperform their stated multiple over longer horizons in sideways or choppy markets.
• The longer you hold beyond one day, the more cumulative leak you face.
Using Decay as a Tailwind
• Rather than avoiding decay, structure trades to benefit from it when your directional bias is robust.
• Combine traditional technical setups with the telescoping of leverage + decay to magnify returns on the correct market view.
• Small notional capital can control large effective exposure via a leveraged ETF + ATM option.
Strategy Execution
• To short the market : buy long puts on a bullish leveraged ETF (e.g. NASDAQ:TQQQ puts).
• To go long the market : buy long puts on an inverse leveraged ETF (e.g. NASDAQ:SQQQ puts).
• Use ATM options for defined risk and to capture both directional move and extra tailwind from ETF decay.
• Position size example: controlling $10k of market exposure might only require $200–$500 in option premium, depending on expiry.
Time Horizon for Decay Tailwind
• Empirically, decay compounds meaningfully over more than one trading day.
• Short-term horizons (2–5 trading days) often capture a useful drift without excessive market risk.
• Back-test your preferred ETF to find the sweet spot for your volatility regime.
High-Volume ETFs to Watch
Bear (inverse) ETFs:
• AMEX:BITI • AMEX:LABD • NASDAQ:SQQQ • AMEX:TZA • AMEX:SOXS • AMEX:SPXS
Bull (long) ETFs:
• AMEX:BITU • AMEX:LABU • NASDAQ:TQQQ • AMEX:TNA • AMEX:SOXL • AMEX:SPXL
Closing Thoughts & Disclaimers
This tutorial highlights how to position decay as a tailwind when your outlook aligns with market direction. Leveraged instruments and options carry amplified risks—only trade with capital you can afford to lose and always define your risk parameters before entry.
Opening (IRA): SMH September 19th 260 Covered Call... for a 253.21 debit.
Comments: One of the higher IV ETF's at the top of my board. Selling the -75 delta call against shares to emulate the delta metrics of a 25 delta short put, but with the built-in defense of the short call.
Metrics:
Break Even/Buying Power Effect: 253.21
Max Profit: 6.79 ($679)
ROC at Max: 2.68%
50% Max: 3.39 ($339)
ROC at 50% Max: 1.34%

MSFT Microsoft Corporation Options Ahead of EarningsIf you haven`t bought MSFT when they announced the 49% stake in OpenAI:
Now analyzing the options chain and the chart patterns of MSFT Microsoft Corporation prior to the earnings report this week,
I would consider purchasing the 550usd strike price Calls with
an expiration date of 2025-12-19,
for a premium of approximately $14.75.
If these options prove to be profitable prior to the earnings release, I would sell at least half of them.
Disclosure: I am part of Trade Nation's Influencer program and receive a monthly fee for using their TradingView charts in my analysis.

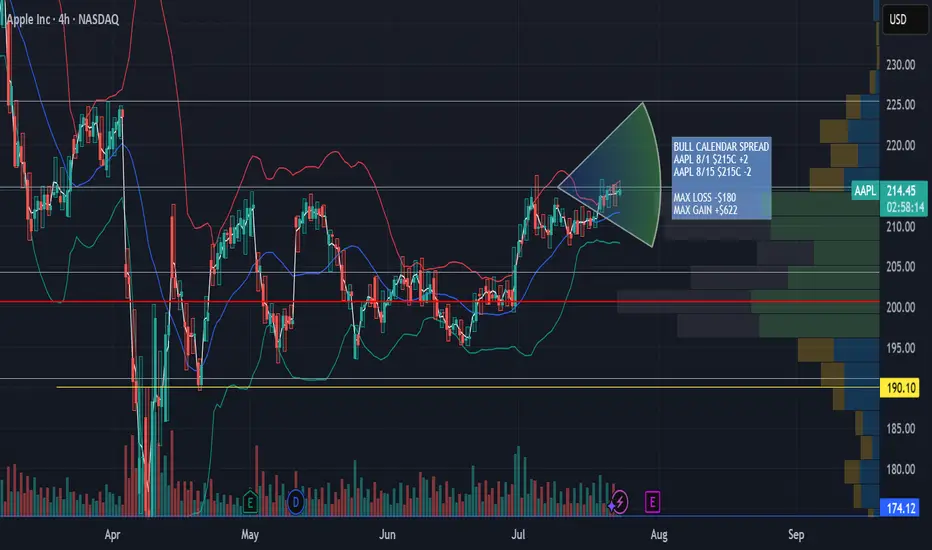
AAPL Aug 1st - Aug 8th 215 Calendar Call SpreadAAPL Aug 1st - Aug 8th 215 Calendar Call Spread
AAPL earnings after market close 7/31/25. Looking for an upward move into earnings with resistance at $225 then retesting support at $215. This zone falls between the .5 and .618 fib retracement. Great risk/ reward ratio 3.5:1
CHTR Charter Communications Options Ahead of EarningsIf you haven`t bought CHTR before the previous earnings:
Now analyzing the options chain and the chart patterns of CHTR Charter Communications prior to the earnings report this week,
I would consider purchasing the 387.5usd strike price Calls with
an expiration date of 2025-7-25,
for a premium of approximately $22.55.
If these options prove to be profitable prior to the earnings release, I would sell at least half of them.
Disclosure: I am part of Trade Nation's Influencer program and receive a monthly fee for using their TradingView charts in my analysis.

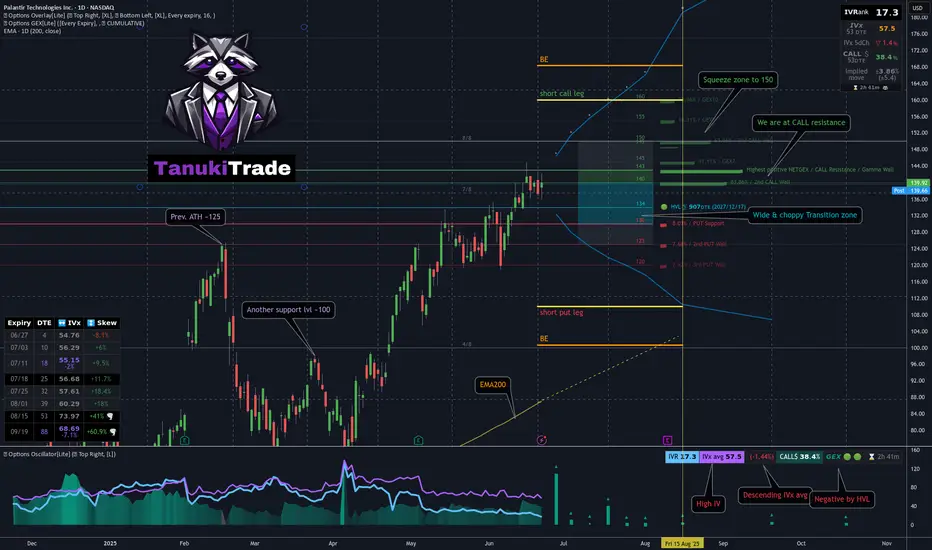
Jade Lizard on PLTR - My 53DTE Summer Theta PlayMany of you — and yes, I see you in my DMs 😄 — are trading PLTR, whether using LEAPS, wheeling, or covered calls.
I took a closer look. And guess what?
📈 After a strong move higher, PLTR was rejected right at the $143 call wall — pretty much all cumulative expiries cluster resistance there
Using the GEX Profile indicator, scanning all expirations:
After a brief dip, the market is repositioning bullish
Squeeze zone extends up to 150
The most distant GEX level is sitting at 160
On the downside, 130 is firm support, with some presence even at 120 — the market isn’t pricing in much risk below that
📉 From a technical standpoint:
We’re near all-time highs
125 (previous ATH) and 100 are key support levels
The OTM delta curve through August is wide, and the call side is paying well — with a current call pricing skew
🔬 IVx is at 57, trending lower + call pricing skew📉 IV Rank isn't particularly high, but the directional IVx matters more here
💡 Summer Theta Play: Jade Lizard on PLTR
Since I’ll be traveling this summer and don’t want to micromanage trades, I looked for something low-touch and high-confidence — and revisited an old favorite: the Jade Lizard.
If you're not familiar with the strategy, I recommend checking out Tastytrade's links and videos on Jade Lizards.
🔹 Why this setup?
Breakeven sits near $100, even with no management
On TastyTrade margin:~$1800 initial margin ~$830 max profit
53 DTE — plenty of time for theta to work
Earnings hit in August — I plan to close before then
Covers all bullish GEX resistance zones
Quickly turns profitable if IV doesn’t spike
Highly adjustable if needed
My conclusion: this strategy covers a much broader range than what the current GEX Profile shows across all expirations — so by my standards, I consider this to be a relatively lower-risk setup compared to most other symbols right now with similar theta strategies.
🔧 How would I adjust if needed?
If price moves up:
I’d roll the short put up to collect additional credit
Hold the call vertical as long as the curve supports it
If price drops:
Transition into a put ratio spread
Either extend or remove the call vertical depending on conditions
🛑 What’s the cut loss plan?
I have about 20% wiggle room on the upside, so I’m not too worried — but if price rips through 160 quickly, I’ll have to consider early closure.
If that happens, the decision depends on time:
If late in the cycle with low DTE:→ Take a small loss & roll out to next month for credit
If early with lots of DTE remaining:→ Consider converting to a butterfly, pushing out the call vertical for a small debit→ Offset this with credit from rolling the put upward
As always — stay sharp, manage your risk, and may the profit be with you.
See you next week!– Greg @ TanukiTrade
DG Trading Setup: Capitalizing on RangeDollar General has experienced a stabilization phase following its Q1 2025 results, with same-store sales increasing 2.4% and revenue growing 5.3% to $10.4 billion. The company has regained traction in the discount retail space, mitigating previous challenges related to shrink and operational inefficiencies.
Institutional Flow & Market Positioning
Recent institutional flow highlights large orders in DG’s 115 call and 110 put, signaling either:
- A range-bound setup, where smart money expects the stock to stay between $110-$115 in the near term.
- Potential volatility, with institutions hedging both directions ahead of an unexpected move.
Considering the ATR (18) and standard deviation (7.353), this aligns with a low-breakout probability, making range-based strategies the optimal play. The absence of earnings between now and July further supports sideways movement expectations.
Options Trade Setup: Iron Condor
To capitalize on premium decay and IV contraction, I’m structuring an iron condor:
- Sell 115 Call / Buy 120 Call
- Sell 110 Put / Buy 105 Put
This strategy ensures limited risk while collecting premium in a high-probability range trade.

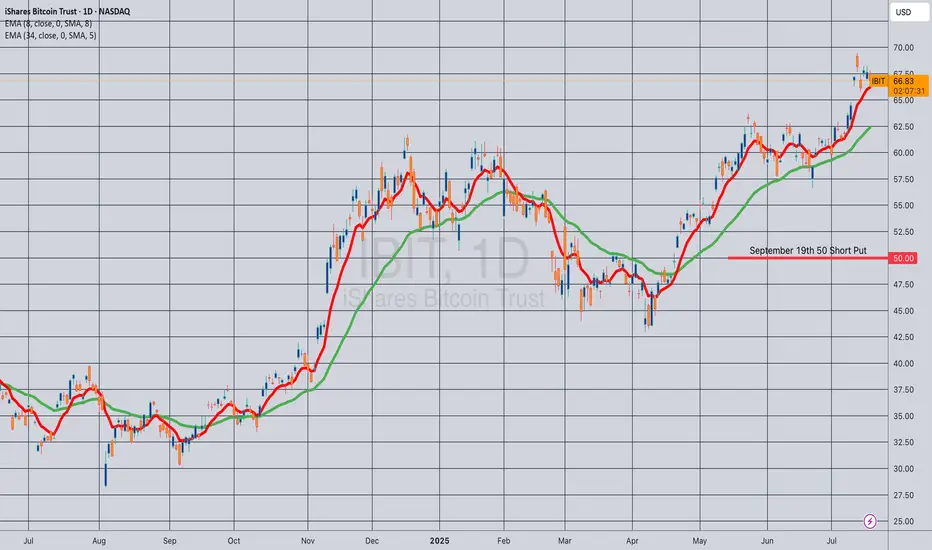
Opening (IRA): IBIT September 19th 50 Short Put... for a .52 credit.
Comments: Laddering out/adding at strikes better than what I currently have on, targeting the strike paying around 1% of the strike price in credit.
Will generally look to roll up at 50% max at > 45 DTE (Days 'Til Expiration).
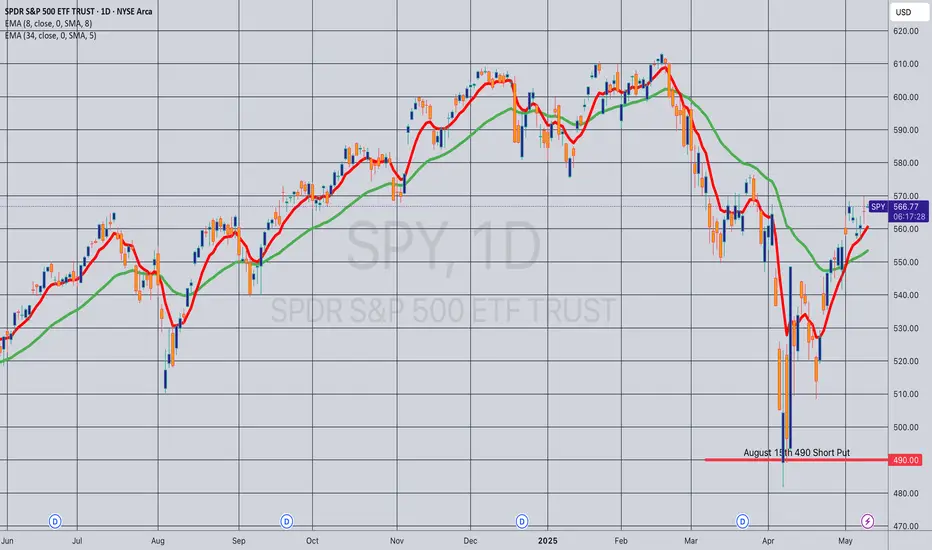
Opening (IRA): SPY August 15th 490 Short Put... for a 5.00 credit.
Comments: Laddering out, targeting the strike paying around 1% of the strike price in credit ... .
Will generally look to roll up to the shortest duration <16 delta strike paying 1% of the strike price if in profit.
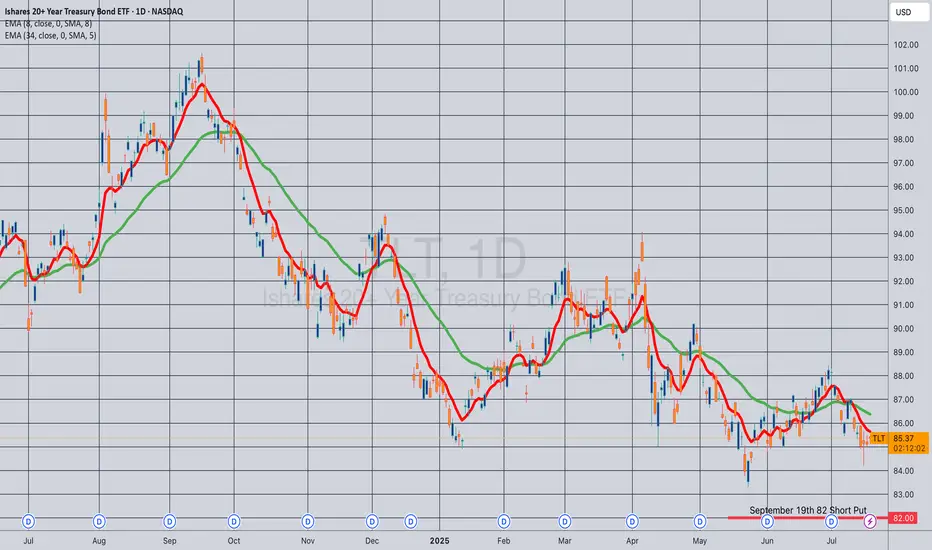
Opening (IRA): TLT September 19th 82 Short Put... for a .90 credit.
Comments: Adding to my position at strikes slightly better than what I currently have on ... .
Opening (IRA): IBIT July 25th 48 Short Put... for a .48 credit.
Comments: The highest 30-day IV on my ETF board (aside from USO and UNG). Laddering out, targeting the strike paying around 1% of the strike price in credit.

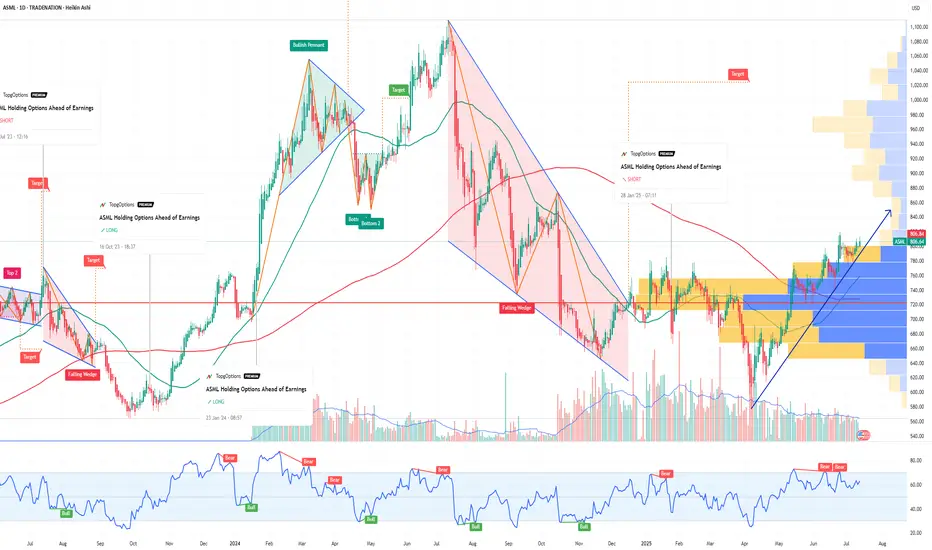
ASML Holding Options Ahead of EarningsIf you haven`t bought the dip on ASML:
Now analyzing the options chain and the chart patterns of ASML Holding prior to the earnings report this week,
I would consider purchasing the 800usd strike price Calls with
an expiration date of 2025-7-25,
for a premium of approximately $32.00.
If these options prove to be profitable prior to the earnings release, I would sell at least half of them.
Disclosure: I am part of Trade Nation's Influencer program and receive a monthly fee for using their TradingView charts in my analysis.
MP Materials Options Ahead of EarningsIf you haven`t bought MP before the previuos earnings:
Now analyzing the options chain and the chart patterns of MP Materials prior to the earnings report this week,
I would consider purchasing the 25usd strike price Calls with
an expiration date of 2025-6-20,
for a premium of approximately $2.97.
If these options prove to be profitable prior to the earnings release, I would sell at least half of them.

Opening (IRA): TLT Sept 19th 83 Short Put... for an .88 credit.
Comments: Camping out with a strike slightly below the 52-week low, where the options contract is paying a smidge more than 1% of the strike price in credit.
I don't really need more TLT, but wouldn't mind being assigned more at a lower price than the stock element of my covered calls.

Opening (IRA): IBIT July 18th 51 Short Put... for a .59 credit.
Comments: One of the higher IV ETF's on my board at the moment. A starter position, targeting the strike paying around 1% of the strike price in credit.
Will look to ladder out at intervals ... .

06/30 Weekly Gamma Exposure Outlook🧠 SPX Weekly Outlook — Gamma Breakout + Short Week Setup
The bulls finally broke through after weeks of painful grinding — and they did so with force.
📈 Thursday & Friday brought a textbook gamma squeeze as SPX sliced through the long-standing 6100 call wall , triggering sharp upside acceleration.
We are now firmly in positive Net GEX territory.
🔺 Entire GEX structure has shifted higher.
🎯 New squeeze zone at 6225 , with major call resistance near 6200 .
🔍 What Just Happened?
📊 The 6060–6120 zone acted as a tough resistance range for weeks — until last week’s breakout.
💥 Put skew collapsed , suggesting downside hedges are being unwound.
📉 VIX and IV keep dropping , confirming a shift toward lower-volatility environment .
🧲 Strong Net GEX across expiries created sustained upward dealer pressure → we’re in long gamma mode .
✅ Bullish Bias — But Stay Tactical
We're in a bullish gamma regime , so dips are likely to be bought.
Key pullback zone to watch: 6125–6060 .
🛠️ Strategy Ideas:
• Wait for a 6060–6125 retest before re-entering longs
• Use shorter-DTE bull put spreads or 0DTE gamma scalps above 6130+
• Scale out or trim risk near 6200–6225
⚠️ Risks to Watch
We’re overextended short-term.
🚨 Losing 6130–6125 could spark a quick flush to 6050 .
Bearish signals to monitor:
• IV spike or renewed put buying
• Loss of 6100 = no-man’s land without confirmation
• Consider short-term debit put spreads if breakdown confirms
🗓️ Short Trading Week Note
🇺🇸 U.S. markets closed Friday, July 5 for Independence Day.
This compresses flows into 4 sessions. Expect:
📌 Early week dealer hedging
📌 Possible positioning unwind on Thursday
💡 Weekly Trade Idea — Structure in Place
💼 Setup:
• Put Butterfly below spot
• 3x Call Diagonal Spreads above spot (5pt wide)
• Slight net negative delta , 11 DTE
🎯 Why it works:
• Leverages IV backwardation
• Profits from time decay
• Favors a stable or modestly bullish week
• Takes advantage of horizontal skew (July 11 vs July 14)
💰 Profit Target: 10–20% return on ~$1,730 risk.
Take profits before time decay kills the center valley — don’t overstay. 🏃💨
📌 Final Thoughts:
The 6100 breakout was technically & gamma-structurally significant ,
but big moves often retest before continuing.
Let price breathe.
Stay aligned with gamma exposure profile. 🔄

Opening (IRA): SPY July 18th 495 Short Put... for a 5.13 credit.
Comments: Targeting the <16 delta strike paying around 1% of the strike price in credit.
Max Profit: 5.13
ROC at Max as a Function of Strike Price: 1.04%
Will generally look to roll up if the short put is in profit at 45 DTE or greater, add at intervals if I can get in at strikes better than what I currently have on at the June 513's and July 495's, and/or consider a "window dressing" roll (i.e., a roll down to a strike that is paying about the same in credit) to milk the last drops out of the position.

Opening (IRA): SMH August 15th 215 Short Put... for a 2.50 credit.
Comments: A starter position in the semiconductor ETF on a smidge of weakness here, targeting the strike paying around 1% of the strike price in credit.
Will generally look to add at intervals if I can get it at a strike better than what I currently have on.

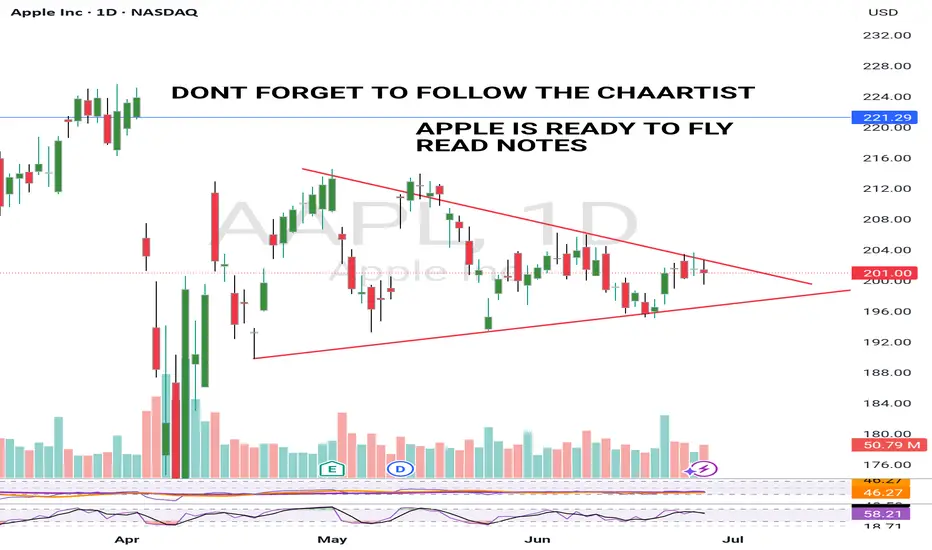
APPLE BULLISH 26 JUNE 2025Apple looks ready to breakout.It is really well squeezed now and ready to form a Green candle.
Breakout is an expectation so dont trade blindly.
I will upload video analysis Asap.
I am bullish and my price target is a minimum $220 from here.
NOTE: RISK MANAGEMENT IS A MUST