Opening (IRA): SOXL March 21st 23 Covered Call... for a 20.87 debit.
Comments: High IVR/IV. Adding to my position at a break even better than what I currently have on. Selling the -75 call against shares to emulate the delta metrics of a 25 delta short put, but with the built-in defense of the short call.
Metrics:
Buying Power Effect/Break Even: 20.87
Max Profit: 2.13
ROC at Max: 10.21%
50% Max: 1.07
ROC at 50% Max: 5.11%
Will generally look to take profit at 50% max, add at intervals (assuming I can get in at a break even better than what I currently have on), and/or roll out the short call in the event take profit is not hit.
Optionsstrategies

Opening (IRA): TQQQ March 21st 71 Covered Call... for a 67.75 debit.
Comments: Starter position, selling the -75 delta call against shares to emulate the delta metrics of a 25 delta short put, but with the built-in defense of the short call.
Metrics:
Buying Power Effect/Break Even: 67.75/share
Max Profit: 3.25
ROC at Max: 4.80%
50% Max: 1.63
ROC at 50% Max: 2.40%
Will generally look to take profit at 50% max, add at intervals (assuming I can get in at break evens/strikes better than what I currently have on), and/or roll out short call if my take profit is not hit.

Opening (IRA): INTC Feb 21st 15/19/20/24 Skinny IC... for a 2.04 credit.
Comments: High IVR/IV (91.4/69.7) earnings announcement volatility contraction play. Going "skinny"/"almost iron fly" here. For purposes of take profit, treating it as an iron fly, where I generally look to take profit at 25% max.
Metrics:
Max Profit: 2.04
Buying Power Effect/Max Loss: 1.96
25% Max: .51
ROC at 25% Max: 25.0%

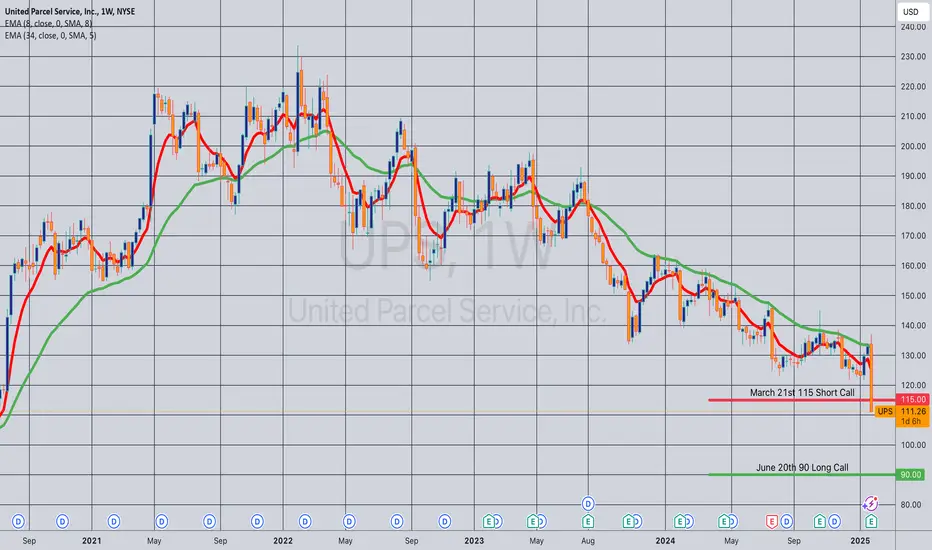
Opening (IRA): UPS June 20th 90C/March 21st -115C... for a 19.60 debit.
Comments: Buying the back month 90 delta call and selling a front month that pays for at least all of the extrinsic in the long such that the break even is at or below where the stock is currently trading.
Metrics:
Buying Power Effect: 19.60
Break Even: 109.60/share
Max Profit: 5.40
ROC at Max: 27.6%
I generally look to take profit on these at 110% of what I put them on for and/or roll out the short call if my take profit isn't hit.
Opening (IRA): TAN February 21st 32 Covered Call... for a 31.17 debit.
Comments: Still in the top 5 underlyings for IV on my ETF board, with 30-day at 35.0%. Adding at strikes better than what I currently have on after exiting the 33's at 50% max. Selling the -75 delta call against stock to emulate the delta metrics of a 25 delta short put, but with the built-in defense of the short call.
Metrics:
Buying Power Effect/Break Even: 31.17/share
Max Profit: .83
ROC at Max: 2.66%
50% Max: .42
ROC at 50% Max: 1.33%
Will generally look to take profit at 50% max.

Opening (IRA): TNA March 21st 38 Covered Call... for a 36.24 debit.
Comments: Adding in at strikes better than what I currently have on, selling the -75 delta call against shares to emulate the delta metrics of a 25 delta short put, but with the built-in defense of the short call.
Metrics:
Buying Power Effect/Break Even: 36.24/share
Max Profit: 1.76
ROC at Max: 4.86%
50% Max: .88
ROC at 50% Max: 2.43%
Will generally look to take profit at 50% max, add at intervals (assuming I can get in at break evens/strikes better than what I currently have on), and/or roll out short call should my take profit not hit.

Opening (IRA): SOXL March 21st 20 Covered Call... for a 17.96 debit.
Comments: High IVR/IV plus weakness. Adding at strikes better than what I currently have on, selling the -75 delta call against shares to emulate the delta metrics of a 25 delta short put, but with the built-in defense of the short call.
Metrics:
Buying Power Effect/ Break Even: 17.96/share
Max Profit: 2.04
ROC at Max: 11.36%
50% Max: 1.02
ROC at 50% Max: 5.68%

Opening (IRA): IBIT March 21st 50 Covered Call... for a 47.78 debit.
Comments: High IVR/IV. Selling the -75 call against shares to emulate the delta metrics of a 25 delta short put, but with the built-in defense of the short call.
Metrics:
Buying Power Effect/Break Even: 47.78
Max Profit: 1.22
ROC at Max: 2.55%
50% Max: .61
ROC at 50% Max: 1.28%
Will generally look to take profit at 50% max, add at intervals (assuming I can get in at a break even better than what I currently have on), and/or roll out the short call in the event take profit is not hit.

Opening (IRA): TSLA February 21st 330/340/460/470 Iron Condor... for a 3.35 credit.
Comments: High IVR/IV earnings announcement volatility contraction play.
Metrics:
Max Profit: 3.35
Buying Power Effect: 6.65
ROC at Max: 50.4%
50% Max: 1.68
ROC at 50% Max: 25.2%

Opening (IRA): TQQQ March 21st 69 Covered Call... for a 65.42 debit.
Comments: High IV + weakness. Selling the -75 call against shares to emulate the delta metrics of a 25 delta short put, but with the built-in defense of the short call.
Metrics:
Buying Power Effect/Break Even: 65.42
Max Profit: 3.58
ROC at Max: 5.47%
50% Max: 1.79
ROC at 50% Max: 2.74%
Will generally look to take profit at 50% max, add at intervals (assuming I can get in at a break even better than what I currently have on), and/or roll out the short call in the event take profit is not hit.

MSFT Microsoft Corporation Options Ahead of EarningsIf you haven`t bought MSFT when they reported 49% stake in OpenAI:
Now analyzing the options chain and the chart patterns of MSFT Microsoft Corporation prior to the earnings report this week,
I would consider purchasing the 430usd strike price Calls with
an expiration date of 2025-2-21,
for a premium of approximately $15.35.
If these options prove to be profitable prior to the earnings release, I would sell at least half of them.

Opening (IRA): XBI January 17th 92 Covered Call... for a 90.47 debit.
Comments: IVR/IV isn't fantastic here at 11.1/26.3%, but there is some IV skew to take advantage of on the call side -- 31.34% at the 92 call relative to 26.62% at the 92 put.
Selling the -75 delta call against shares to emulate the delta metrics of a 25 delta short put to take advantage of the IV skew and the built-in defense of the short call. From a charting standpoint, the break even sets up nicely with the "RFK, Jr. low" in November.
Metrics:
Buying Power Effect/Break Even: 90.47
Max Profit: 1.53
ROC at Max: 1.69%
50% Max: .77
ROC at 50% Max: .85

Opening (IRA): TMF Feb 28th 35 Covered Call... for a 33.98 debit.
Comments: High IVR/IV at 40.7/44.2, which is no surprise, since this is a bullish 3 x leveraged 20 year paper exchange-traded fund. It does have a dividend that pays out quarterly in March, June, September, and December (annualized yield of 4.71%).
Selling the -75 delta call against shares to emulate the delta metrics of a 25 delta short put, but with the built-in defense of the short call. Using the February 28th expiry to keep things in that 45 DTE wheelhouse and will look to add at intervals, assuming I can get in at strikes/break evens better than what I currently have on.
Metrics:
Buying Power Effect/Break Even: 33.98/share
Max Profit: 1.02
ROC at Max: 3.00%
50% Max: .51
ROC at 50% Max: 1.50%
Will generally look to take profit at 50% max, roll in-profit short call out to reduce my break even.

Opening (IRA): TLT April 17th 82 Covered Call... for an 80.60 debit.
Comments: Laddering out at strikes better than what I currently have on (Feb 87's, March 84's). Selling the -75 delta call against shares to emulate the delta metrics of a 25 delta short put, but with the built-in defense of the short calls. Plus, gotta be in shares to grab that divvy.
Metrics:
Break Even/Buying Power Effect: 80.60/shares
Max Profit: 1.40
ROC at Max: 1.74% (excluding dividends)
Ordinarily, I take profit at 50% max, but will wait until the dividend immediately preceding the monthly expiry drops before considering taking profit.

Opening (IRA): TLT February 21st 87 Covered Call... for a 85.97 debit.
Comments: Going long at or near November lows, selling the -75 call against shares to emulate the delta metrics of a 25 delta short put, with the built-in defense of the short call. I'm also looking to snag the January and potentially the February dividends here. This is a bit longer-dated than I ordinarily like to go, but I'm not doing a ton here besides waiting for January setups to come in/be managed.
The obvious variant is to sell the standard -30 delta against: TLT Feb 21st 94 covered call, 89.72 debit, 4.28 max. 4.77% ROC at max where the short call is paying >1% of the strike price in credit.
Metrics:
Buying Power Effect/Break Even: 85.97/share
Max Profit (ex. dividends): 1.03
ROC at Max: 1.20%
50% Max: .52
ROC at 50% Max: .60%
Will generally look to take profit at 50% max after at least the January dividend drops.

Opening (IRA): TLT March 21st 84 Covered Call... for an 82.72 debit.
Comments: Laddering out into 2025 at strikes/break evens better than what I currently have on, looking to snag January, February and potentially March dividends ... .
Metrics:
Buying Power Effect/Break Even: 82.72/share
Max Profit: 1.28
ROC at Max: 1.55%
50% Max: .64
ROC at 50% Max: .77%

Opening (IRA): EWZ Feb 28th 22.5 Short Put... for a .51 credit.
Comments: After closing my Feb 17th 23 for a small profit, opening up a position at a strike slightly lower than what I just had on, attempting to pick up shares at the lowest price the market will allow. Had to use the weeklies to get into the 22.5.

Full ARKK Reverse Gamma Scalping PositionThe basic essence of reverse gamma scalping is to do additive and subtractive delta adjustments over time to keep delta fairly neutral so that theta can do its dirty work.
Shown here is my full ARKK position that started as a delta neutral iron condor to which (a) I layered in an additional iron condor as a delta adjustment trade; (b) mixed and matched profitable put side with profitable call side to reduce units and/or risk; and (c) did an additive long delta short put vertical as a delta adjustment. Rather than continue showing each of these additive/subtractive delta adjustments as separate trades, I'm setting out the full banana here.
I've collected a net 3.22 in credits on a buying power effect of 11.78, and the position has a delta/theta ratio of -2.09/6.00. With 36 days to go, I'll primarily look at doing profitable subtractive adjustments first; then additive ones.

Opening (IRA): USO February 21st 79/April 17th 107 PMCP** -- Poor Man's Covered Put
Comments: Shorting USO on strength using a long put diagonal/Poor Man's Covered Put, buying the back month 90 delta put and selling the front month 30 that pays for all of the extrinsic in the long.
Metrics:
Buying Power Effect: 22.96 debit
Break Even: 84.04
Max Profit: 5.04
ROC at Max: 21.95%
50% Max: 2.52
ROC at 50% Max: 10.98%
Will generally look to take profit at 50% max, roll out the short put on approaching worthless.

Opening (IRA): XBI February 28th 82 Covered Call... for an 80.54 debit.
Comments: Adding to my position at a strike/break even better than what I currently have on. Going with the February 28th, since the March monthly remains someone long in duration.
Metrics:
Buying Power Effect/Break Even: 80.54/share
Max Profit: 1.46
ROC at Max: 1.81%
50% Max: .73
ROC at 50% Max: .92%
Will generally look to take profit at 50% max, roll out short call on take profit test.

COFORGE Options Trading Strategy: Breakout and Momentum-BasedIn this post, we’ll explore a couple of options strategies for COFORGE using the data for strike price 9000 . By closely monitoring the price action and key option data, we can make informed decisions that align with market trends. Here’s how we can approach trading this stock’s options effectively:
Key Option Data Breakdown
Call Short Covering: Indicates that the market sentiment is bullish as traders are closing their call positions, signaling a potential upward movement.
Put Writing: A strong sign of bullishness as traders are actively writing puts, expecting the price to stay above the 9000 strike.
Call and Put LTP (Last Traded Price):
Calls LTP: 278.8 (indicating that calls are gaining traction).
Puts LTP: 100.7 (a lower LTP for puts suggests lower demand).
Open Interest (OI) and Change in OI:
Calls OI Change: -47,850 (indicating a reduction in call positions due to short covering).
Puts OI Change: +123,975 (signifying an increase in put writing, which reinforces the bullish sentiment).
Strategy 1: Buying the Call or Put Based on the First 5-Minute Candle
This strategy involves observing the price movement in the initial 5 minutes after the market opens and deciding whether to buy a call or put, depending on the price action and option data.
When to Buy the Call or Put:
If the first 5-minute candle shows a bullish move, consider buying the call option as the market sentiment appears to be in favor of upward movement.
If the first 5-minute candle shows a bearish move, consider buying the put option. However, given the overall data showing strong put writing, this could be less likely.
Why It Works:
The first 5 minutes are crucial for gauging market sentiment, and with the data indicating strong bullishness (due to call short covering and put writing), a call option is likely to perform well.
Considerations:
This strategy requires watching for clear momentum during the first 5 minutes. If the market remains indecisive, it may be better to stay on the sidelines to avoid wasting premium.
Strategy 2: Breakout Strategy – Buy Calls or Puts on the Break of Highs
This strategy involves waiting for a breakout of the call or put’s high price. The breakout indicates a shift in momentum, and we’ll enter the trade based on whichever direction triggers first.
When to Buy the Call:
Watch for the call’s high price (389.85). If the call option breaks this level, it signals that the upward momentum is gaining strength. Buy the call to capitalize on the breakout.
When to Buy the Put:
If the call option doesn’t break its high and the price starts to show weakness, consider buying the put once it breaks its high (360.6). However, the data suggests that the market bias is bullish, so a call breakout is more likely.
Why It Works:
Breakouts are powerful signals of market momentum. Since the data shows heavy put writing, the call option is more likely to break its high first. This creates an opportunity to buy calls in a bullish trend.
Considerations:
Always monitor the volume and the price action for confirmation of the breakout. If both calls and puts test their highs without clear direction, consider waiting for a clearer signal.
Conclusion:
Given the strong bullish sentiment reflected in the options data—call short covering and put writing—the most reliable strategy is Strategy 2. Watch for a call breakout above 389.85 or a put breakout above 360.6 (if the call fails to break its high). The bullish bias suggests that the call option is more likely to outperform, but a breakout in either direction can trigger the strategy.
Pro-Tip: Set a stop loss just below the breakout level to manage risk effectively. The market sentiment is heavily tilted towards bullishness, so a call option breakout is the most probable outcome.

Gold → A Bear Wedge Pattern is forming. What's Next?OANDA:XAUUSD consolidating above the 2715 level, while simultaneously a bearish wedge pattern maintains the recent upward trend. Theoretically, the price will break the support level, creating a breakout at the 2715 zone.
On the H1 timeframe, the support zone of 2715-2715 has formed and price is moving towards reacting at this support area. If buyers maintain this zone, price may retest the upper boundary of the rising channel or the important psychological level of 2748 before further decline. However, a breakthrough below this level will lead to an earlier price drop. Additionally, the USD is also consolidating above the support zone, creating a corresponding reaction in the gold market.
Resistance levels: 2738, 2748, 2758
Support levels: 2716, 2703, 2693
I expect a correction following the false break of the 2715 level. Price consolidation below this level will lead to a deeper decline.

Opening (IRA): XBI February 21st 85 Covered Call... for an 83.01 debit.
Comments: Adding at strikes/break evens better than what I currently have on, selling the -75 delta call against shares to emulate the delta metrics of a 25 delta short put, but with the built-in defense of the short call.
Metrics:
Buying Power Effect/Break Even: 83.01/share
Max Profit: 1.99
ROC at Max: 2.40%
50% Max: 1.00
ROC at 50% Max: 1.20%
Will generally look to take profit at 50% max, roll out short call on take profit point test.
