SPY (S&P500) - Price Testing Support Trendline - Daily ChartSPY (S&P500 ETF) price has just closed below $600 and is currently under a support trendline.
If price cannot breakout above the $600 and $605 resistance level this month, a pullback could occur down to the support zone.
SPY price could potentially pullback to various levels of support due to:
-USA domestic conflict
-International military conflicts
-Technical chart bearish divergence
-USA federal reserve interest rate news
-Government and corporate news
Support Levels: $595, $590, $585, $580.
Resistance Levels: $600, $605, $610, $615.
The 50EMA/200EMA Golden Cross is still on-going, and support prices of $580 and $568 have yet to be tested significantly.
Optionsstrategies

Opening (IRA): SMH July 18th 195 Short Put... for a 2.23 credit.
Comments: Adding at a strike better than what I currently have on at the 205 ... .

[06/09] [GEX] Weekly SPX OutlookLast week’s outlook played out quite well — as anticipated, SPX hit the 6000 level, closing exactly there on Friday. This was the realistic target we highlighted in last week's idea.
🔭 SPX: The Bigger Outlook
It's difficult to say whether the rising SPX trend will continue. We're still in the "90-day agreement period" set by the administration, and so far, the market has shown resilience, avoiding deeper pullbacks like the one we saw in April.
With VIX hovering around 17–18, we’ve reached a zone where further SPX upside would require volatility. For the index to continue rising meaningfully, it needs to reverse the current bearish macro environment, and that can only happen with strong buying momentum — not a slow grind.
The parallel downward channel drawn a few weeks ago is still technically valid. Even a short 100-point squeeze would fit within this structure before a larger move down unfolds.
GEX levels give us useful clues heading into Friday. We're currently in a net positive GEX zone across all expirations, giving bulls a structural advantage, just like last week.
As of Monday’s premarket, SPX spot is at 6009.The Gamma Flip zone is between 5975–5990, with a High Volume Level (HVL) at 5985.
🔍 Let’s zoom in with our GEX levels — this gives us a deeper view than our GEX Profile indicator for TradingView alone.
🐂 🟢 If SPX moves higher, the following are logical profit-taking zones:
6050 (Delta ≈ 33)
6075 (Delta ≈ 25)
6100 (Delta ≈ 17)
🎯 Targeting above 6100 currently feels irrational — for instance, the next major gamma squeeze zone is at 6150, but that corresponds to a delta 6 level (≈94% chance the price closes below it), so I won’t aim that high yet.
🐻🔴 In a bearish scenario:
5975 and 5950 are the first nearby support zones (Deltas 30 and 38).
If momentum picks up, 5900 becomes reachable quickly, even if it's technically a 17-delta distance — because that’s deep in the negative GEX zone.
📅 Don’t forget: On Wednesday premarket, we’ll get Core Inflation Rate data — a key macro risk that could shake things up, regardless of TSLA drama fading.
📌 SPX Weekly Trading Plan Conclusion
Whatever your bias, keep cheap downside hedges in place. We've been rising for a long time, and even if SPX breaks out of the descending channel temporarily, resistance and the gamma landscape may pull price back swiftly.

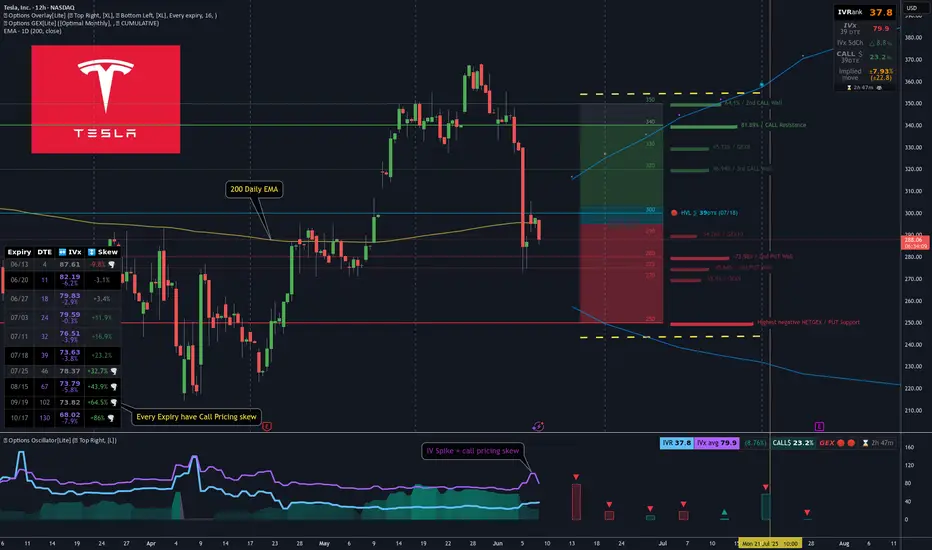
[GEX] TSLA Breakdown & Options Trade Idea for 39DTELast week, TSLA dropped hard, likely due to political tensions. Let’s not forget — just a month ago, their EVs were showcased at the White House entrance...
In the span of 30 hours, TSLA fell -22% (see red line below), while SPX barely reacted. Why? Because both realized and implied volatility dropped — remember VIX is around 17/18.
This sharp TSLA drop already seemed overdone, which helped fuel the +5% bounce on Friday.Most TSLA options positions are near-term and still show negative sentiment — but further expirations grow increasingly bullish.
🔍 If you use options GEX matrix , you’ll see the bearish hedging flow gradually turns more neutral-to-bullish.
Most cumulative support/resistance zones lie between 250–340, with spot currently just under the chop zone.
🧠 TSLA Trade Idea
It’s been a while since I posted a neutral Iron Condor, but TSLA might be an exception.
Despite last week’s IV spike, call pricing skew still dominates across expirations — as seen in our Options Overlay indicator.This tells me the market doesn’t fear TSLA crashing below 200. So, I’m aiming to capture premium on the July 18th expiry without day trading.
I’m thinking of something simple, well-manageable in either direction.To refine leg placement, I use visual GEX zones.
🐻🔴 Downside:
Strong put support at 250
Gradual support layers up to 280
🐂 🟢 Upside:
Target area: 340–350 for the July 18 expiry.
📅 Closing the Trade:I'll consider closing or adjusting at 21 DTE or when 50% max profit is hit — per TastyTrade’s studies.
🔁 Rolling Plan:IF short delta on one side drops below ~14 and price pulls away, I’ll roll the untested side to collect more credit.
🧑🏫 I’ll likely post trade management live in Discord for educational purposes.
~~~~~~~~~~~~~~~~~~~~~~~~~~~~~~~~~~~
🦋 Bonus Idea: TSLA Broken Wing Butterfly
If you think TSLA has more downside, a Put Broken Wing Butterfly — like the one shown in my previous YT video — is also a great way to structure this trade using the same GEX levels.
There’s no single way to use Gamma Exposure — it’s the most actionable hedging signal we have. Combine it with your knowledge of strategies and you can trade almost any scenario.
One thing’s for sure — this market moves faster than ever.A single day of internal conflict wiped -22% off TSLA…The next morning, the market already moved on, so as always:
Trade Safe Out There!
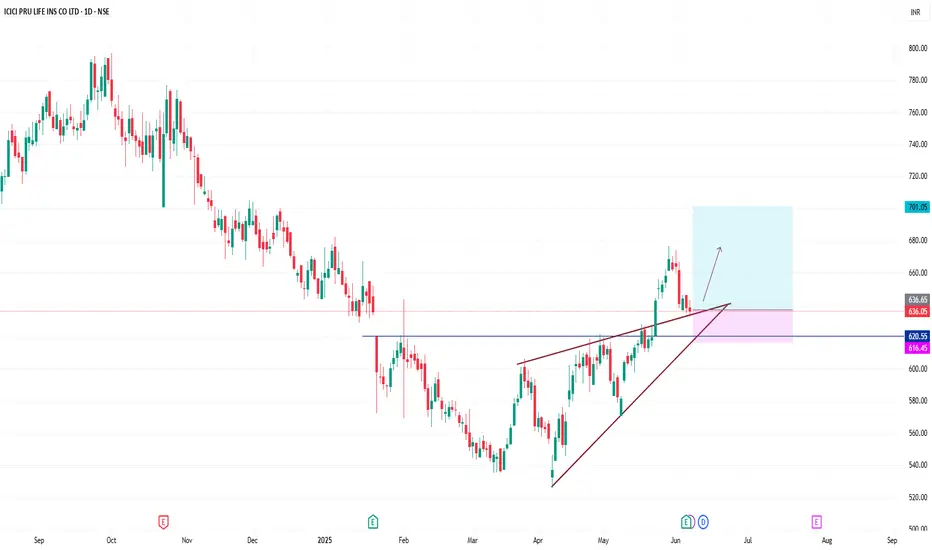
ICICI PRU LIFE INSDaily timeframe, its a swing trade, trendline breakout and retest, stoploss below 620 and target is 700, add your watchlist and observ this stock.
Gold Update – Will Buyers Drive It to 3,485 USD?Great to see all traders again in today’s gold price discussion at the end of the trading session. LyngridTrading here!
Yesterday, gold dropped sharply, with the metal falling by 600 pips during the US session. However, by this morning, it quickly regained its upward momentum, supported by buying pressure around the 3,340 USD support zone.
Specifically, gold regained its momentum after the latest data on the US labor market was just released, showing that the number of initial state unemployment claims rose to 247,000 (seasonally adjusted) by the end of May 2025, according to the announcement from the U.S. Department of Labor. This figure is higher than expected, reflecting a weakening US labor market, which has increased expectations that the Fed will soon cut interest rates to support the economy.
From a technical perspective, as previously analyzed, gold holds a strong short-term technical advantage from the support zone around 3,340 USD. If buying pressure continues, there will be nothing stopping it from rising to 3,485 USD, in line with the idea scheduled at the same time yesterday.

XAUUSD: Bullish Structure Still Intact?Dear friends,
To begin this post, I want you to understand why I want to connect with the global TradingView community. Simply put, I want to share the value I have and listen to more perspectives from all of you. This helps build a stronger, more united community.
And what about you. What do you think of OANDA:XAUUSD hovering around 3,370 USD?
Let’s explore it together!
OANDA:XAUUSD is moving within a very clear ascending channel, with price action consistently respecting both the upper and lower boundaries. This indicates that the bullish structure is still being maintained and the buyers remain in control. The recent upward momentum further reinforces the belief that this trend could continue.
The price is currently approaching a key support zone, marked by the lower boundary of the channel and a previous demand area. If this zone holds, it could offer a strong re-entry opportunity for buyers. The projected bullish target is 3,485 USD, which aligns with the upper boundary of the channel and represents a reasonable upside objective. This is the area I will closely monitor to find a trend-following buy entry, as long as bullish momentum remains intact.
Of course, I do not dismiss the opposite scenario. Failure to hold this dynamic support may suggest that bullish momentum is weakening and could shift the short-term trend to neutral or bearish.
Let me know your thoughts or if you see it differently!

Navigating MSTR’s Price Swings: A Smart Options ApproachOverview
MicroStrategy (MSTR) has continued to capture market attention due to its aggressive Bitcoin strategy and significant stock price volatility. In 2025, MSTR surged 41% in one quarter but also reported a massive $4.22 billion net loss in Q1, raising concerns about long-term financial stability. Analysts remain divided, setting price targets ranging from $200 to $650, largely dependent on Bitcoin’s performance and broader market conditions.
Key Developments Impacting MSTR
✔ Bitcoin Exposure: MSTR maintains a large Bitcoin position, making its stock highly correlated to BTC’s price movements.
✔ AI Integration: The company is investing in AI-driven products, which could provide diversification outside of Bitcoin.
✔ Institutional View: Analysts remain split on MicroStrategy’s valuation due to its uncertain revenue model.
✔ Macro Volatility: Market-wide sentiment, interest rates, and crypto regulations will influence MSTR’s trajectory.
Options Strategy for the Week
🚀 Iron Condor Setup for June 6 Expiration
To capitalize on MSTR’s volatility while managing risk, an Iron Condor strategy is structured within a controlled range:
- Inner Range: Sell Calls at 395 and Puts at 335
- Coverage: Buy Calls at 415 and Puts at 315
✅ Objective: Profiting from sideways price movement while minimizing exposure to extreme volatility.
✅ Risk Management: If MSTR breaks above 415 or below 315, the long positions hedge against excessive losses.

Opening (IRA): SPY August 15th 502 Short Put... for a 5.10 credit.
Comments: Adding at a strike better than what I currently have on in August at the 535 strike, targeting the <16 delta paying around 1% of the strike price in credit.

06/02 Weekly GEX Analysis - 6000 Looks EasyThe biggest event last week was undoubtedly the court ruling involving Trump. The market responded with optimism, and on Thursday premarket, SPX surged toward the 6000 level — only to get instantly rejected. That strong rejection suggests this is a firm resistance zone.
From the GEX expiry matrix, it's clear that the market is hedging upward for this week, but downward for next week. To me, this indicates that while the near-term GEX sentiment remains slightly bullish, the market may be preparing for a pullback or retest in the medium term.
This week, SPX has already entered a GEX zone surrounded by positive strikes — up to around the 6000 level. That makes 6000 an “easy target” for bulls, and we’ll likely see profit-taking here, just like we did last Thursday premarket.
⚠️ However, if we look more closely at the weekly net open interest:
...we can see a strong bullish net OI build-up starting to emerge around the 6100 level — a price zone that currently feels distant and even unreachable. But if the 6000 resistance breaks, we could see a fast gamma-driven squeeze up to 6050 and possibly 6100 before the next wave of profit-taking kicks in.
As is often the case during bullish moves, the market seems blind to the bigger picture — no one’s looking down, only up. The mood is greedy, and momentum favors the bulls... for now.
Never underestimate FOMO — but also never underestimate Trump. He’s unlikely to accept the court’s decision on tariffs quietly. Any new negative headline could shake the market, no matter where price is sitting…

RBRK Rubrik Options Ahead of EarningsAnalyzing the options chain and the chart patterns of RBRK Rubrik prior to the earnings report this week,
I would consider purchasing the 90usd strike price Calls with
an expiration date of 2025-6-20,
for a premium of approximately $5.60.
If these options prove to be profitable prior to the earnings release, I would sell at least half of them.

Opening (IRA): SPY September 19th 500 Short Put... for a 5.02 credit.
Comments: Adding at intervals at strikes better than what I currently have on, targeting the <16 delta strike paying around 1% of the strike price in credit. Will look to manage positions as I come to them.

[05/27] Weekly GEX Outlook for SPX⚠️ Unbalanced GEX & Institutional Hedging – A Closer Look
I haven’t seen such an asymmetric GEX setup in quite a while — and it’s definitely not a pretty one 😬. The current profile suggests a highly skewed positioning in the market:
📍 Massive upside expectation:
It feels like the market is almost exclusively preparing for a move toward 6000.
🛑 Limited downside protection:
Below the current level, there's very little hedging in place — especially unusual with Friday’s expiry approaching.
🔻 Current Key Zone: 5925-5930
The largest put open interest is sitting right around 5925, which is also close to spot.
Below that? Things get murky. The GEX profile becomes fragmented and mixed, with no clear put support until much lower.
Interestingly, most of the current downside hedging is clustered around the 5900–5925 range, which includes ITM puts — not OTM, as you’d typically expect from retail.
🧠 Institutional Footprint vs. Retail
This hedging pattern — closer to ATM rather than deep OTM — suggests institutional players are managing downside risk with precision.
In contrast, retail traders don’t seem to be actively hedging the downside with OTM puts, which is a notable shift from typical behavior in high-IV weeks like this.
🔼 What to Watch: The 5930 Breakout
If SPX can break and hold above 5930, it enters a clear, call-dominated zone.
From there, the path to 6000 looks much cleaner, with lighter resistance and the potential for a gamma-driven push 📈.
The details show the same picture when examining more details:
SPX conclusion
😬 In short: we’re at a tipping point.
Below 5900, hedging is tactical and institutional.
Above 5900, the path is open to 6000 — but only if bulls can take control at 5930!

NVDA GEX Earnings Outlook by OptionsNVDA reports earnings this Wednesday, and it’s a big deal. A major move could impact both the indexes and broader tech sector.
The OTM 16 delta curve essentially overlaps with both the GEX profile and the expected probability zone — signaling strong confluence.
📈 Rising IV with falling call skew: Volatility is rising into earnings, while the call skew is dropping — a sign of growing interest in downside hedging/speculation.
🔷 Key inflection zone (129): Above 129, the market is unlikely to surprise. Below it, however, a domino effect could trigger increased volatility and put-side flows.
Implied move into earnings is 6.62%, reflecting binary risk expectations from the options market.
Strong gamma squeeze territory exists between 140–145, with significant call wall buildup around 140.
The nearest expiry shows a positive net GEX — supporting short-term mean-reversion or hedging flow stability above 129, at least until the earnings print.
🔴 Downside risk scenario:
In the event of a downward move, the market is most heavily hedged around the 125 level, which aligns with the deepest put support.
💡 Wheeling Opportunity Idea
ONLY IF you want to own NVDA long-term around the $130 level (even if it drops short/mid-term), this might be a great time to start the wheeling strategy.
Because earnings inflate volatility, you can sell a near-term cash-secured put (CSP) for solid premium — even on a 53DTE (July) option.
Based on current GEX levels, we’re seeing:
-Support (squeeze zone) around $125
-Call resistance around $140
-A potential upside squeeze extending to $145-$150
These align roughly with ~20 delta OTM options, so the premium is attractive.
How would I personally start this:
Sell a CSP for May 30 with the intention to get assigned if NVDA drops.
If I do get assigned, I’m happy to own shares.
Then, I sell a 60DTE covered call right after to collect another round of premium.
If I’m not assigned, I sell a new 45–60DTE put the following week — still benefiting from the relatively high IV.
👉 Remember: High IV = synthetic time value. With this two-step method, you can harvest premium twice in quick succession.
I used the same technique with NASDAQ:INTC , and it’s been performing well.
💥 ONLY IF you want to own NVDA long-term around the $130 level (even if it drops short/mid-term)!


ZS Zscaler Options Ahead of EarningsIf you haven`t bought the dip on ZS:
Now analyzing the options chain and the chart patterns of ZS Zscaler prior to the earnings report this week,
I would consider purchasing the 250usd strike price Puts with
an expiration date of 2026-1-16,
for a premium of approximately $29.30.
If these options prove to be profitable prior to the earnings release, I would sell at least half of them.
Disclosure: I am part of Trade Nation's Influencer program and receive a monthly fee for using their TradingView charts in my analysis.

Opening (IRA): SPY September 19th 510 Short Put... for a 5.21 credit.
Comments: Laddering out, targeting the <16 delta strike paying around 1% of the strike price in credit.
Still looking to add in shorter intervals at strikes better than what I have on, but we've been in a grind-up ... .

Opening (IRA): SPY June 20th 490 Short Put... for a 5.26 credit.
Comments: Targeting the strike that is both at 16 delta or below and that is paying 1% of the strike price in credit ... .
Metrics:
Buying Power Effect/Break Even: 484.72
Max Profit: 5.26
ROC at Max: 1.09%
Will generally look to ladder out at intervals, assuming I can get in at prices better than what I currently have on, roll out at 50% max ... .

[𝟬𝟱/𝟭𝟮] 𝗪𝗲𝗲𝗸𝗹𝘆 𝗦𝗣𝗫 𝗚𝗘𝗫 𝗣𝗹𝗮𝘆𝗯𝗼𝗼𝗸🔍 IF/THEN QUICK GAMMA PLAYBOOK
IF > 5825 THEN path to 5900 → stall/profit-taking likely
IF > 5900 THEN path to first 5950, then 6000 → gamma squeeze extension zone
IF < 5825 THEN path to 5700 → test of transition zone support
Chop Zone: — re-entry = short-term balance/testing zone
IF < 5700 THEN path to 5500 → gamma flush / dealer unwind risk
🧭 𝗘𝗫𝗧𝗘𝗡𝗗𝗘𝗗 𝗭𝗢𝗡𝗘 𝗠𝗔𝗣/b]
✅ Gamma Flip Level
5700 → This is the confirmed Gamma Flip level = High Volatility Zone = HVL. We are comfortably above it, confirming positive gamma environment.
🧱 Major Call Walls / Resistance to upside from here
5900 → Significant call resistance zone (highlighted across GEX, profile, and /matrix command). 5825–5900 = Current rally zone → expected stall at 5900 (Profit-taking zone)5950 → Next mid-large positive gamma wall to the upside, mid-station between mounts. Dealers short gamma, adding fuel to breakout.6000 → Positive Gamma squeeze continuation target. Gamma squeeze intensifies → likely extends to 6000.🟦 Transition / Chop Zone
5700–5825 → Previous chop range. Retrace could test this before renewed upside.Currently outside and breaking up from this zone, indicating trend initiation.
Balance zone from prior structure.
Expect fade setups if price dips back in.
Needs catalyst or strong sell flow to re-enter meaningfully.
🛡️ Major Put Supports to the downside
5700 → = HVL, also aligned with pTrans and Put support.Dealer unwind risk, downside opens.5500 → Key level if the 5700 zone fails — “total denial zone” of current FOMO.
-----------------------------
This week’s SPX setup remains decisively bullish from a gamma perspective. The GEX profile shows strong positive gamma, with institutional and dealer hedging flows firmly positioned to support continued upside—especially into Friday’s OPEX. The environment is ideal for a controlled melt-up: volatility is softening, implied volatility is trending lower, and there’s no sign of panic in the options market.
Put pricing skew is also declining, which suggests reduced fear and a shift toward more aggressive call buying—another sign of bullish sentiment. Dealer positioning implies that any upward momentum is likely to be chased and hedged into, reinforcing the trend.
However, traders should stay alert: if SPX slips back below 5825, we may see a pause or retracement back into the 5700–5825 transition zone. Only a decisive break below 5700 would flip the gamma regime back to negative and open the door to real downside volatility.

Weekly Market Wrap: Nifty Dips 340 Points Amid Global TensionsThis week, the Nifty 50 ended on a cautious note, closing at 24,008, down 340 points from the previous week's close. The index traded within a tight range, hitting a high of 24,526 and a low of 23,935—well within my anticipated levels of 24,900 to 23,800.
Silver Lining: Despite ongoing geopolitical tensions and negative news flow—including war-related developments—bulls managed to defend the critical psychological support of 24,000. That’s a sign of resilience in an otherwise shaky environment.
What’s Ahead?
For the upcoming week, expect high volatility. I see Nifty moving between 24,600 and 23,200. A weekly close below 23,800 could spell trouble for bulls, potentially opening the door for a drop toward major support zones at 23,200 and 23,000.
Technical Outlook:
Monthly & Daily Timeframes: Weak
Weekly Timeframe: Still bullish
So, while long-term charts show vulnerability, the weekly trend gives hope. I'm staying cautiously bullish—but will only turn aggressive once the monthly chart flips positive. Until then, it’s time to stay vigilant, not impulsive.
Global Cues: S&P 500 Holding Up Amid Uncertainty
The S&P 500 closed at 5,659, just 30 points down from the previous week, forming a doji candle—a clear sign of indecision. As long as the index holds above 5,532, there's no major cause for concern.
Bearish Trigger: Below 5,532, expect downside pressure toward 5,458 and 5,392, which could spill over into already fragile emerging markets like India.
Bullish Breakout: Above 5,770, bulls gain momentum, with potential upside targets of 5,821, 5,850, and 5,900. A rally here could bring relief to global equities, including Indian markets.

Tag ‘n Turn → Bear Mode EngagedV-Shape Reversal Confirms Short Bias
You ever see a setup pull a fakeout, tease a breakout, then pivot perfectly back into your system?
That was yesterday.
The Tag ‘n Turn gave us another clean swing exit off the upper Bollinger Band, and while I was ready to defer the next entry, a tidy little V-shaped reversal handed us the confirmation we needed. We’re back bearish. Levels are set. Now we let the market do its thing.
---
SPX Market View
Let’s unpack the sequence.
Price ran up into the upper Bollinger Band and triggered the final legs of our overnight swings. That was the cash-out point – system clean, profits booked.
But I wasn’t diving into the next setup just yet.
Why?
Because it looked like the start of a Bollinger breakout – the kind that breaks the pinch and rips higher. So I paused. Waited.
Then came the V-shaped reversal – clear as day within 2 hours.
Entry happened late in the day, around the same level the mechanical Tag ‘n Turn would have fired. No edge lost. Just added confirmation.
Now? The system is officially bearish again, with a firm rejection at highs and a sharp drive lower that flipped the tone of the day and the bias on the chart.
Today’s key levels:
5620 = GEX flip zone
Also where we bounced up post-FOMC
5680 = resistance zone – could mark today’s top
We’re back in the pre-FOMC chop zone.
The plan:
Bearish until price tells us otherwise
Hedge levels marked
No chase
Wait for price to hit our zone
Let the system print
Expert Insights:
Jumping the gun on reversals – wait for structure, not assumptions.
Chasing breakouts too early – pinch points often fake before they break.
Skipping levels – 5620 and 5680 matter. Mark them or risk regret.
Overmanaging overnight trades – exits were planned. Trust the system.
Forcing direction changes – confirmation > prediction. The system knows.
Satirical cartoon showing confirmation over prediction.
Rumour Has It…
Word is the SPX reversal was caused by a rogue intern at the Fed who mistook the breakout chart for a bowl of ramen and tried to stir it with a mouse. After rebooting TradingView, they accidentally submitted a bearish policy note to Bloomberg. The market reversed out of pure confusion.
This is entirely made-up satire. Probably!
Breaking scoops courtesy of the Financial Nuts Newswire-because who needs sanity?
---
Fun Fact
The term “V-shaped reversal” originated in early floor trading days when chalkboard analysts would literally sketch a V on the board as a real-time note to floor brokers. That visual shorthand became one of the most recognized intraday patterns in trading – a pattern that still works in a world of tickers, bots, and zero-DTE.

WULF TeraWulf Options Ahead of EarningsIf you haven`t bought WULF before the rally:
Now analyzing the options chain and the chart patterns of WULF TeraWulf prior to the earnings report this week,
I would consider purchasing the 2usd strike price Puts with
an expiration date of 2026-1-16,
for a premium of approximately $0.43.
If these options prove to be profitable prior to the earnings release, I would sell at least half of them.

SPY - support & resistant areas for today May 5 2025These are Support and Resistance lines for today, May 5th, 2025, and will not be valid for the next day. Mark these in your chart by clicking grab this below.
Yellow Lines: Heavily S/R areas, price action will start when closing in on these.
White Lines: Are SL, TP or Mid Level Support and Resistance Areas, these are traded if consolidation take place on them.
Silver Lines: An Area where price action could happen and do work on a choppy day.
