[𝟬𝟱/𝟭𝟮] 𝗪𝗲𝗲𝗸𝗹𝘆 𝗦𝗣𝗫 𝗚𝗘𝗫 𝗣𝗹𝗮𝘆𝗯𝗼𝗼𝗸🔍 IF/THEN QUICK GAMMA PLAYBOOK
IF > 5825 THEN path to 5900 → stall/profit-taking likely
IF > 5900 THEN path to first 5950, then 6000 → gamma squeeze extension zone
IF < 5825 THEN path to 5700 → test of transition zone support
Chop Zone: — re-entry = short-term balance/testing zone
IF < 5700 THEN path to 5500 → gamma flush / dealer unwind risk
🧭 𝗘𝗫𝗧𝗘𝗡𝗗𝗘𝗗 𝗭𝗢𝗡𝗘 𝗠𝗔𝗣/b]
✅ Gamma Flip Level
5700 → This is the confirmed Gamma Flip level = High Volatility Zone = HVL. We are comfortably above it, confirming positive gamma environment.
🧱 Major Call Walls / Resistance to upside from here
5900 → Significant call resistance zone (highlighted across GEX, profile, and /matrix command). 5825–5900 = Current rally zone → expected stall at 5900 (Profit-taking zone)5950 → Next mid-large positive gamma wall to the upside, mid-station between mounts. Dealers short gamma, adding fuel to breakout.6000 → Positive Gamma squeeze continuation target. Gamma squeeze intensifies → likely extends to 6000.🟦 Transition / Chop Zone
5700–5825 → Previous chop range. Retrace could test this before renewed upside.Currently outside and breaking up from this zone, indicating trend initiation.
Balance zone from prior structure.
Expect fade setups if price dips back in.
Needs catalyst or strong sell flow to re-enter meaningfully.
🛡️ Major Put Supports to the downside
5700 → = HVL, also aligned with pTrans and Put support.Dealer unwind risk, downside opens.5500 → Key level if the 5700 zone fails — “total denial zone” of current FOMO.
-----------------------------
This week’s SPX setup remains decisively bullish from a gamma perspective. The GEX profile shows strong positive gamma, with institutional and dealer hedging flows firmly positioned to support continued upside—especially into Friday’s OPEX. The environment is ideal for a controlled melt-up: volatility is softening, implied volatility is trending lower, and there’s no sign of panic in the options market.
Put pricing skew is also declining, which suggests reduced fear and a shift toward more aggressive call buying—another sign of bullish sentiment. Dealer positioning implies that any upward momentum is likely to be chased and hedged into, reinforcing the trend.
However, traders should stay alert: if SPX slips back below 5825, we may see a pause or retracement back into the 5700–5825 transition zone. Only a decisive break below 5700 would flip the gamma regime back to negative and open the door to real downside volatility.
Optionsstrategies

Weekly Market Wrap: Nifty Dips 340 Points Amid Global TensionsThis week, the Nifty 50 ended on a cautious note, closing at 24,008, down 340 points from the previous week's close. The index traded within a tight range, hitting a high of 24,526 and a low of 23,935—well within my anticipated levels of 24,900 to 23,800.
Silver Lining: Despite ongoing geopolitical tensions and negative news flow—including war-related developments—bulls managed to defend the critical psychological support of 24,000. That’s a sign of resilience in an otherwise shaky environment.
What’s Ahead?
For the upcoming week, expect high volatility. I see Nifty moving between 24,600 and 23,200. A weekly close below 23,800 could spell trouble for bulls, potentially opening the door for a drop toward major support zones at 23,200 and 23,000.
Technical Outlook:
Monthly & Daily Timeframes: Weak
Weekly Timeframe: Still bullish
So, while long-term charts show vulnerability, the weekly trend gives hope. I'm staying cautiously bullish—but will only turn aggressive once the monthly chart flips positive. Until then, it’s time to stay vigilant, not impulsive.
Global Cues: S&P 500 Holding Up Amid Uncertainty
The S&P 500 closed at 5,659, just 30 points down from the previous week, forming a doji candle—a clear sign of indecision. As long as the index holds above 5,532, there's no major cause for concern.
Bearish Trigger: Below 5,532, expect downside pressure toward 5,458 and 5,392, which could spill over into already fragile emerging markets like India.
Bullish Breakout: Above 5,770, bulls gain momentum, with potential upside targets of 5,821, 5,850, and 5,900. A rally here could bring relief to global equities, including Indian markets.

Tag ‘n Turn → Bear Mode EngagedV-Shape Reversal Confirms Short Bias
You ever see a setup pull a fakeout, tease a breakout, then pivot perfectly back into your system?
That was yesterday.
The Tag ‘n Turn gave us another clean swing exit off the upper Bollinger Band, and while I was ready to defer the next entry, a tidy little V-shaped reversal handed us the confirmation we needed. We’re back bearish. Levels are set. Now we let the market do its thing.
---
SPX Market View
Let’s unpack the sequence.
Price ran up into the upper Bollinger Band and triggered the final legs of our overnight swings. That was the cash-out point – system clean, profits booked.
But I wasn’t diving into the next setup just yet.
Why?
Because it looked like the start of a Bollinger breakout – the kind that breaks the pinch and rips higher. So I paused. Waited.
Then came the V-shaped reversal – clear as day within 2 hours.
Entry happened late in the day, around the same level the mechanical Tag ‘n Turn would have fired. No edge lost. Just added confirmation.
Now? The system is officially bearish again, with a firm rejection at highs and a sharp drive lower that flipped the tone of the day and the bias on the chart.
Today’s key levels:
5620 = GEX flip zone
Also where we bounced up post-FOMC
5680 = resistance zone – could mark today’s top
We’re back in the pre-FOMC chop zone.
The plan:
Bearish until price tells us otherwise
Hedge levels marked
No chase
Wait for price to hit our zone
Let the system print
Expert Insights:
Jumping the gun on reversals – wait for structure, not assumptions.
Chasing breakouts too early – pinch points often fake before they break.
Skipping levels – 5620 and 5680 matter. Mark them or risk regret.
Overmanaging overnight trades – exits were planned. Trust the system.
Forcing direction changes – confirmation > prediction. The system knows.
Satirical cartoon showing confirmation over prediction.
Rumour Has It…
Word is the SPX reversal was caused by a rogue intern at the Fed who mistook the breakout chart for a bowl of ramen and tried to stir it with a mouse. After rebooting TradingView, they accidentally submitted a bearish policy note to Bloomberg. The market reversed out of pure confusion.
This is entirely made-up satire. Probably!
Breaking scoops courtesy of the Financial Nuts Newswire-because who needs sanity?
---
Fun Fact
The term “V-shaped reversal” originated in early floor trading days when chalkboard analysts would literally sketch a V on the board as a real-time note to floor brokers. That visual shorthand became one of the most recognized intraday patterns in trading – a pattern that still works in a world of tickers, bots, and zero-DTE.

WULF TeraWulf Options Ahead of EarningsIf you haven`t bought WULF before the rally:
Now analyzing the options chain and the chart patterns of WULF TeraWulf prior to the earnings report this week,
I would consider purchasing the 2usd strike price Puts with
an expiration date of 2026-1-16,
for a premium of approximately $0.43.
If these options prove to be profitable prior to the earnings release, I would sell at least half of them.

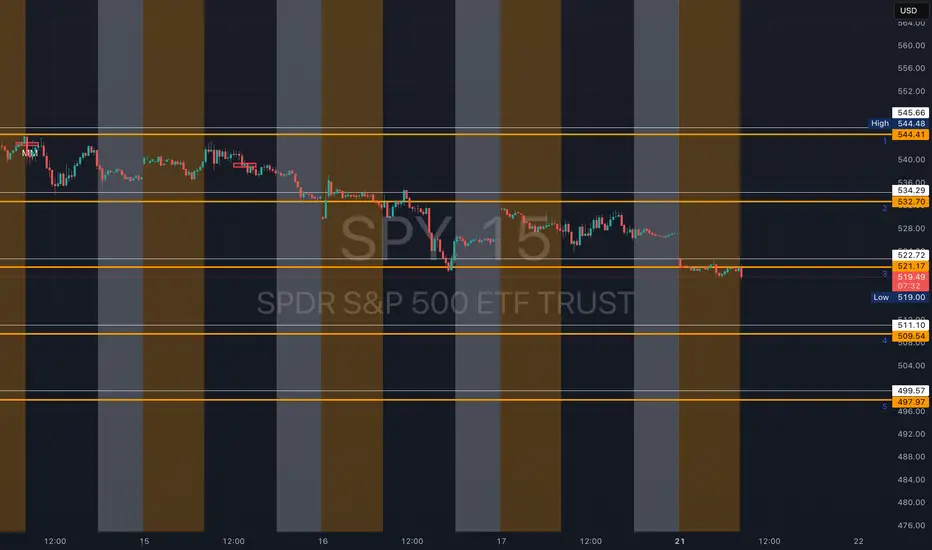
SPY - support & resistant areas for today May 5 2025These are Support and Resistance lines for today, May 5th, 2025, and will not be valid for the next day. Mark these in your chart by clicking grab this below.
Yellow Lines: Heavily S/R areas, price action will start when closing in on these.
White Lines: Are SL, TP or Mid Level Support and Resistance Areas, these are traded if consolidation take place on them.
Silver Lines: An Area where price action could happen and do work on a choppy day.

Weekly Market Wrap Nifty, Mid & Small Caps, and S&P 500 OutlookNifty ended the week on a strong bullish note, closing at 24,346, up by 307 points from the previous week. The index traded within a tight range, hitting a high of 24,589 and a low of 24,054, aligning perfectly with my projected range of 24,650–23,400.
📌 Key Technical Levels to Watch:
Nifty closed just below a crucial Fibonacci resistance at 24,414.
A daily close above 24,414 next week could open the door for a sharp move towards the next major resistance at 24,770.
While my system suggests a broader range of 24,900–23,800, I personally hope for a healthy consolidation to cool off some momentum—paving the way for a stronger, faster rally in the coming weeks.
Caution Zone:
A break below 23,800 might signal the return of bears, potentially dragging the index down to test critical support at 23,200/23,100.
Midcap & Smallcap Watch:
I’ve received a lot of queries about Midcap and Smallcap indices, and here’s the honest truth—they remain in a 'no-trade' zone. Despite Nifty's strength, the rally hasn’t lifted most Mid & Small Cap stocks.
👉 Investors holding quality, fundamentally strong stocks in these segments should stay calm, but avoid high PE or overvalued stocks until we get a clear monthly buy signal on the charts.
🌍 Global Markets – S&P 500 Analysis:
The S&P 500 closed the week at 5,686, just above the strong Fibonacci level of 5,637. Sustaining above this level could lead to a rally toward 5,770/5,821. However, a failure to hold this support might trigger a 2–3% pullback, which could ripple across global markets, including India.
📣 Bottom Line:
Nifty bulls need a close above 24,414 to push higher.
Mid & Small Cap space remains tricky—stay selective.
Watch global cues, especially from the US, for broader market direction.
Stay nimble, stay informed. ✅

04/28 Weekly GEX AnalysisDETAILED IMAGE:
Here’s what the charts and indicators are showing right now until Friday.
We are approaching a key breakout zone.
🐂 🟢 IF the market breaks above the white bearish daily trendline, the next bullish target could be between 5515–5680.
🟦 ⚖️ The chop area is between 5435–5515.
Expect more back-and-forth moves here if the breakout fails.
🐻🔴 Watch out: if the price drops below 5435 or 5425, there’s little support left.
This could trigger a sharp sell-off ("Bearish Armageddon" scenario).
GEX profiles remain positive 🟢 across all near expirations — for now — suggesting that underlying support still exists, but we need to monitor any changes closely.
IVRank is still relatively high (30.9), meaning options are priced with a decent amount of implied volatility.
🟢Short-term sentiment is currently bullish, with some speculative activity picking up.
This suggests that traders are expecting less volatility over the next month compared to what we saw in the past week.
However, if we look at institutional positions focused on longer-term expirations (especially beyond 30 days on SPX/AM maturities), the picture remains bearish 🔴 or at least highly volatile.
These players are still strongly hedging against downside risks.
This confirms the broader point:
Even though price action managed to recover to pre-tariff-announcement levels — with very low trading volume — we’re not out of the woods yet.
Until we can break and hold above the key resistance bearish trend with HIGH BUY VOLUME (aka. momentum), we shouldn't expect a strong, stable GEX profile across all expirations like we had in the past.

Can Uber pool its way to a new all-time high?Unbelievable strength the past two weeks. Once we see some strength above 75.4, it should pick up a little bit of momentum. Long bias. Not financial advice.

AMZN Amazon Options Ahead of EarningsIf you haven`t bought AMZN before the previous rally:
Now analyzing the options chain and the chart patterns of AMZN Amazon prior to the earnings report this week,
I would consider purchasing the 210usd strike price Calls with
an expiration date of 2025-6-20,
for a premium of approximately $3.75.
If these options prove to be profitable prior to the earnings release, I would sell at least half of them.
Disclosure: I am part of Trade Nation's Influencer program and receive a monthly fee for using their TradingView charts in my analysis.

One kick towards 54250Bank Nifty Technical Outlook – 30th April
On 30th April, Bank Nifty continued to trade with a higher low, maintaining its recent structure of higher highs and higher lows. This indicates short-term strength; however, caution is warranted.
Despite the bullish structure, any adverse geopolitical event—such as developments involving PoK or Pakistan—could act as a strong negative trigger. In such a scenario, Bank Nifty may reverse sharply and head towards the downside gap zones around 54,250, 53,700, and potentially 52,300.
The broader trend remains vulnerable to news-driven volatility. Monitoring price action near key support zones is crucial.
#banknfity #niftybank #nifty50 #nifty

Nifty Wkly Market Outlook: Bulls Regain Momentum Amid key brkoutThe Indian benchmark index Nifty 50 ended the week on a strong note, closing at 24,039, marking a robust gain of nearly 200 points from last week's close. During the week, Nifty made a high of 24,365 and a low of 23,847, trading perfectly within the anticipated range of 24,414 – 23,200, as projected in our previous analysis.
Importantly, the index managed to secure a weekly close above the psychological resistance level of 24,000, signaling a possible continuation of bullish momentum. As we head into the next trading week, the bulls are expected to have the upper hand, provided Nifty stays above 23,700. A daily close below 23,700, however, could shift sentiment in favor of the bears, exposing key support zones at 23,400 and 23,200.
Looking ahead, traders and investors should watch for price action within the broader range of 24,650 to 23,400. If the bulls manage to break and sustain above the critical Fibonacci resistance level of 24,414, we could see an upside move toward 24,650 and even 24,770.
On the global front, the S&P 500 index also delivered a strong performance, closing at 5,525, up a significant 250 points from the previous week. As highlighted earlier, the bullish W pattern on the charts has played out well, driving momentum higher.
If the S&P 500 sustains above the key breakout level of 5,551, it could potentially rally further to test resistance at 5,638, 5,670, and 5,715. However, a break below 5,391 may invite selling pressure, dragging the index down to test supports at 5,368, 5,327, or even 5,246, which could trigger a negative ripple effect across global markets.
Key Takeaways:
Nifty bullish above 24,000; watch 24,414 for breakout confirmation.
S&P 500 bullish continuation above 5,551; potential to test 5,715.
Bearish reversal levels to monitor: 23,700 for Nifty and 5,391 for S&P 500.

Opening (IRA): TLT June 20th 79 Short Put... for a 1.61 credit.
Comments: High IVR. Starting to ladder out here, selling the 25 delta put ... .
Since I'm interested in acquiring more shares at 85 or below, I may let this run to expiry or approaching worthless (e.g., .05) ... . Can't believe it breaks 84.50 (which would be correspondent with a 5% yield on the 10-year T note), but you never know in this environment.

Quick correctionI bough some puts form 05/02 strike 242.5. I think is going to respect that resistance in short term. I'll take the loss if it breaks up that resistance. Also SPY is hitting a resistance zone. We might see a pull back soon.

Opening (IRA): SPY May 16th 385 Short Put... for a 4.04 credit.
Comments: High IVR, >21 IV. Sticking a little pickle in here, targeting the strike paying around 1% of the strike price in credit which is quite a bit out of the money at the 8 delta.
Metrics:
Buying Power Effect/Break Even: 380.96
Max Profit: 4.04
ROC at Max: 1.06%
50% Max: 2.02
ROC at 50% Max: .54%

Opening (IRA): TLT May 16th 84 Short Put... for a 1.59 credit.
Comments: High IVR; back in range of 52-week lows. Working both ends of the stick in 20 year+ paper with a covered call on one end of the stick, short puts on the other ... .
Metrics:
Buying Power Effect: 82.41/contract
Max Profit: 1.59
ROC at Max: 1.93%
50% Max: .80
ROC at 50% Max: .96%
Since I want to potentially pick up additional shares at a lower price, I will run this to expiry or approaching worthless (e.g., .05).

CHTR Charter Communications Options Ahead of EarningsAnalyzing the options chain and the chart patterns of CHTR Charter Communications prior to the earnings report this week,
I would consider purchasing the 360usd strike price Calls with
an expiration date of 2025-9-19,
for a premium of approximately $22.35.
If these options prove to be profitable prior to the earnings release, I would sell at least half of them.

SPY - support & resistant areas for today April 21 2025These are Support and Resistance lines for today, April 21, 2025, and will not be valid for the next day. Mark these in your chart by clicking grab this below.
Yellow Lines: Heavily S/R areas, price action will start when closing in on these.
White Lines: Are SL, TP or Mid Level Support and Resistance Areas, these are traded if consolidation take place on them.
SPY - support & resistant areas for today April 16 2025These are Support and Resistance lines for today April 16 2025 and will not be valid for next day. Mark these in your chart by clicking grab this below.
Yellow Lines: Heavily S/R areas, price action will start when closing in on these.
White Lines: Are SL, TP or Mid Level Support and Resistance Areas, these are traded if consolidation take place on them.

Nifty50 Wkly Anlysis – Strong Reversal, But Volatility AheadThe Indian stock market closed the week on an interesting note. The Nifty 50 index ended at 22,828, just 70 points lower than last week's close, after forming a significant bullish reversal from a low of 21,743 to a high of 22,923.
As we mentioned in last week's market outlook, a base formation was underway—and this week's price action confirmed it. With the next week being truncated due to market holidays on Monday and Friday, traders should expect increased volatility and sideways movement.
Key Technical Levels:
Support: 22,200 – This is 50% of this week's candle; a break may bring bearish momentum.
Resistance: 23,400 – A close above this could ignite a rally toward 23,900, 24,100, and possibly 24,414.
On the global front, the S&P 500 respected the 4,800 support level, rebounding sharply to close at 5,363. However, underlying market weakness remains, so it's a sell-on-rise situation in U.S. equities.
Pro Tip:
Indian investors should keep an eye out for quality, fundamentally strong stocks. Any correction in the market may offer excellent long-term buying opportunities.

GEX Analysis & Options “Game Plan”🔶 Short- and longer-term perspective in a high IV, negative GEX environment
🔶 KEY LEVELS & RANGES
Spot: 221
Gamma Flip / Transition: around 250 (the turquoise zone on the chart)
– This zone typically marks a “power shift.” If price decisively breaks above 250 and holds, market makers’ gamma positioning could flip from neutral/negative to positive.
Put Support: 200
– A large negative gamma position has accumulated here, making 200 a strong support level. If it breaks, the downside may accelerate.
Call Resistance: 400
– A major long-term “call wall” where a significant amount of OTM calls are concentrated. It’s more relevant to LEAPS; currently far from spot, so not a realistic short-term target.
Call Resistance #2: 300
– A medium-term bullish objective, still above the 200-day MA. You’d need to be strongly bullish to aim for ~300 by May (e.g., going for a 16-delta OTM call).
Short-Term / Intermediate GEX Levels:
– There are gamma clusters around 220–230 and 250–260 . These areas often see higher volatility, possible bounces, or stalls (chop) due to hedging flows.
🔶 WHATEVER SCENARIO – SHORT TERM (0–30 DAYS)
A) Upside Continuation / Rebound
– If TSLA closes above 225–230 , the next target is 240–250 (transition / gamma flip).
– If it breaks above 250 and holds (e.g., successful retest), market makers may shift to “long gamma,” fueling a quicker move to 260–270 .
– Resistance: 250, 300, with an extreme LEAPS-level at 400.
B) Downside Move / Bearish Break
– If price dips below ~220 and sustains, the next targets are 210–200 (major put wall / negative gamma).
– If 200 fails, negative gamma may magnify the sell-off. It’s an extreme scenario but still on the table given high IV and macro/geopolitical risks.
– Support: 210, 200 — likely stronger buying interest near 200, possibly a short-term bounce.
– The options chain suggests near-term hedging via puts for this scenario.
C) Chop / Sideways
– If TSLA stays in 210–230 , market makers (short options) might benefit from high IV/time decay.
– Negative GEX, however, can trigger sudden moves in either direction; caution is advised.
🔶 LONGER-TERM FOCUS (6–12 MONTHS, LEAPS)
NET GEX = -61.97M (negative territory) suggests longer-dated positioning is also put-heavy or carries notable negative gamma.
HVL / pTrans = 250 is a key pivot; cTrans+ = 400 is distant call resistance. Between these levels, there’s a mix of put/call dominance.
If Tesla undergoes a fresh growth phase (AI, robotaxi, energy storage, etc.) and clears 250/300 , 400 could become the next significant call wall — but that’s more of a multi-month horizon.
🔶 STRATEGY IDEAS (High IV Environment)
1. Short-Term Bearish
– If you’re bearish and expecting TSLA to test 220–210, consider a bear put spread or net credit put butterfly (lower debit) to leverage high IV.
– Targeting 200, but keep in mind negative gamma may accelerate downside movement.
2. Medium-Term “Contra” Bullish (bounce to 250)
– If GEX suggests a bounce off 210–220, consider a bull call spread (e.g., 220/240) or a net debit call butterfly (220/240/250).
– Be mindful of sudden swings, as we remain in negative gamma territory.
3. Longer-Term Bullish (>3–6 months)
– A call butterfly with upper strikes around 300–350 offers capped debit and higher potential payoff if a bigger rally materializes.
– A diagonal spread (selling nearer-dated calls, buying further-out calls) exploits elevated front-end IV.
4. Neutral / Range-Bound
– If TSLA stays in 200–250 , you could use Iron Condors (e.g., 200/260) to benefit from time decay and any IV collapse.
– Exercise caution: negative gamma can generate abrupt, directional moves, making a neutral stance riskier than usual.
🔶 ADDITIONAL NOTES & “BIG PICTURE”
High IV & Negative GEX: TSLA has a track record of large swings. Negative GEX can intensify sell-offs, while forced hedging might trigger rapid rebounds.
Preferred Structures: With expensive premiums, spreads (vertical, diagonal) and butterfly configurations generally fare better than plain long options (less vulnerable to time decay).
Potential Catalysts: AI announcements, Autopilot breakthroughs, new product lines, and macro changes can swiftly alter market dynamics. Keep tracking GEX updates and news flow; TSLA tends to respond dramatically to fresh developments.
🔶 Bottom line: From 221 spot, watch 210–200 on the downside and 240–250 on the upside short term. Medium-term bullish target = 300 , while 400 remains a far LEAPS scenario. High IV + negative gamma = fast, potentially volatile moves — so risk management and spread-based approaches are crucial.

04/07 GEX + Historic VIX Highs: Extreme Volatility with OptionsWow, where to begin? We’ve just come through a week that even the most thorough analysts found surprising.
Last Friday’s brutal sell-off triggered such a massive margin call rally that even the hedge funds were forced to exit gold—which is usually considered a safe haven—on Friday.
The VIX is at a historic high — no joke. We last saw levels like this during the 2008 crisis and the COVID panic in 2020.
📌 High IV = High Theta
When implied volatility (IV) is high, theta (the time decay of options) is also high. This means that maintaining long put protection becomes extremely expensive. From a broker’s hedging perspective, if they are short expensive put options, they can gradually buy back their futures positions over time (all else being equal). As IV rises, this buyback becomes increasingly attractive for them.
Let’s look at our weekly SPY analysis using GEX Profile (Gamma Exposure) indicator first:
It’s definitely not a cheerful chart!
* Below 520: We have strikes dominated by puts. The largest negative GEX “profit-taking zone” sits at 490. If price reaches that level and the support fails (the previous major bottom from April 2024), we could move even further down into a very wide negative squeeze zone, possibly as far as 445.
* HVL zone: 520–546: A choppy area around the gamma flip.
* Above 546: This would signal a +10-15% rally, putting us in a positive gamma zone. However, such a scenario currently seems unlikely—at least based on the gamma levels we see right now.
I won’t sugarcoat it: we’re at levels now where the market could easily move 10% in either direction. So, in my view, forget about conservative option strategies with flat delta exposure.
🤔 What Can We Do?
Important: This analysis reflects my personal opinion only. It’s primarily for those looking to speculate in this highly uncertain environment. If you’re holding put options strictly as a hedge, then this may not be directly relevant to you. In these conditions, the number one rule is to survive—hedges are meant to protect assets or guard against margin calls, not to make profit.
Currently, IV (implied volatility) and VIX are at historic highs. For them to stay this elevated, we’d need new negative headlines and further major market drops. While that could certainly happen, statistically it becomes less and less likely as time goes on.
Buying Put Options …. no way?
First off, there are plenty of challenges if you plan to buy put options right now—most of all their cost. Put options are nearly twice as expensive as calls in many cases.
Does this mean I recommend selling puts or put spreads? I’m not saying you shouldn’t, but be aware: this isn’t for the faint-hearted or for beginners (the risk is high!). It might be worth exploring butterfly or vertical debit spread strategies, as our goal remains the same as always: to maximize the risk–reward ratio.
🐂 If You’re Bullish
This might sound like a ninja move, but one possibility is to buy call butterfly spreads. Yes, the market could still drop—that’s absolutely possible. But statistically, it’s becoming less likely that we’ll see another huge leg down without some form of rebound.
- Slight Move Up: In the event of a mild rise, call spreads and call butterfly strategies can significantly outperform a simple long call. The short legs in a spread/fly offset high theta costs and mitigate the negative effects of falling IV.
- Even with a +10% Move: A long call is often still not the best choice in this environment—even if the option goes deep in the money.
Where Call Spread/Butterfly Can Fail
If stocks rally 15–20% or more and IV also increases (which would be unprecedented in just a few days).
If the market crashes and VIX spikes above 100 (IV would skyrocket, raising the cost of all options further).
Cheap Bullish Calendar Spread
In a situation like this, even a cheap calendar spread can be a good play — the risk is relatively low, especially if managed well and the breakeven range is wide. Of course, if implied volatility drops, the spread could narrow, but that would likely come with a market rally, which theta can help capitalize on.
🐻 If You’re Bearish
I strongly advise against buying single-leg puts, even on a 0DTE (zero-days-to-expiration) basis. If you’re convinced the market will keep dropping, I’d only consider debit spreads, aiming for a solid risk–reward ratio (in my case, I look for at least 1:2 risk-to-reward).
⚖️ If You Want to Stay Neutral / Omni bullish
If you prefer not to pick a direction, you could try to capitalize on historically high IV with a May-expiration Iron Condor. This is the classic TastyTrade approach, with the caveat that you must monitor GEX levels and IV daily and adjust the far side as needed.
Risk Management: If the spot price threatens one of your short strikes, you probably shouldn’t wait around in this volatile environment. It’s usually better to close the position and take a small loss than to hope for a reversal—hoping can become very expensive!
Conclusion
The market is extremely volatile, and expensive options mean traditional strategies may not work as well as they usually do. Stay cautious, manage risk meticulously, and don’t be afraid to close out losing trades quickly. As always, surviving to trade another day is the most important rule.

Nifty Wkly Outlook: Market Volatility, Supprt Lvls & Possible
Nifty ended the week at 22,904, marking a significant decline of 600 points from the previous week’s close. The index reached a high of 23,565 and a low of 22,857. As anticipated, the dragonfly doji formation from last week, coupled with concerns over Trump’s new tariff measures taking effect from April 2nd, contributed to global market jitters. These factors spooked investors and led to heightened volatility across the board.
My initial forecast for Nifty's trading range this week was 24,000-23,000, but the lower end of that range was breached by 150 points, indicating increased downside pressure. Looking ahead, there is potential for Nifty to find support around the 22,600/22,400 zone, where it may consolidate and form a base to attempt a rebound towards the 24,000 level. However, if the index were to break below the critical support level of 21,964 (which, frankly, seems unlikely), a deeper correction towards 19,700 could unfold. * That said, I believe most of the negative news has already been priced in, and we could see a market recovery within the next 10-15days, depending on how the bulls respond to this pullback .*
In the global markets, the S&P 500 has closed below its 100-week exponential moving average (WEMA) at 5,074, and if it falls below this week’s low of 5,069, we could see a further slide towards 4,750/4,800, representing a 6% drop from current levels. Should Nifty also correct by 6% from its current position, this aligns with a potential support zone around 21,900/22,000, making it an interesting technical level to watch.
It will be crucial to monitor if the wounded bulls can stage a comeback or if the market will continue its downward trajectory. Stay tuned!

Opening (IRA): XBI May 16th -91C/October 17th 60C LCD*... for a 26.56 debit.
Comments: Back in to XBI on weakness, buying the back month 90 delta and selling the front month that pays for all of the extrinsic in the long. (The back month 60C is shown at the 80 so that it fits on the chart).
Metrics:
Buying Power Effect: 26.56
Break Even: 86.56
Max Profit: 4.44
ROC at Max: 16.72%
50% Max: 2.22
ROC at 50% Max: 8.36%
Will generally look to take profit on the setup as a unit at 50% max, roll out the short call at 50% max to reduce my downside break even.
* -- Long call diagonal.
