BANK NIFTY INTRADAY LEVELS FOR 14 MAY 2024BUY ABOVE - 47900
SL - 47730
TARGETS - 48050,48220,48460
SELL BELOW - 47730
SL - 47900
TARGETS - 47560,47400,47200
NO TRADE ZONE - 47730 to 47900
Previous Day High - 47900
Previous Day Low - 47000
Based on price action major support & resistance's are here, the red lines acts as resistances, the green lines acts as supports. If the price breaks the support/resistance, it will move to the next support/resistance line. White lines indicates previous day high & low, high acts as a resistance & low acts as a support for next day.
Trendlines are also significant to price action. If the price is above/below the trendlines, can expect an UP/DOWN with aggressive move.
Please NOTE: this levels are for intraday trading only.
Disclaimer - All information on this page is for educational purposes only,
we are not SEBI Registered, Please consult a SEBI registered financial advisor for your financial matters before investing And taking any decision. We are not responsible for any profit/loss you made.
Request your support and engagement by liking and commenting & follow to provide encouragement
HAPPY TRADING 👍
Optionsstrategies

NIFTY INTRADAY LEVELS FOR 14 MAY 2024BUY ABOVE - 22130
SL - 22070
TARGETS - 22180,22240,22300
SELL BELOW - 22070
SL - 22130
TARGETS - 22020,21960,21900
NO TRADE ZONE - 22070 to 22130
Previous Day High - 22130
Previous Day Low - 21820
Based on price action major support & resistance's are here, the red lines acts as resistances, the green lines acts as supports. If the price breaks the support/resistance, it will move to the next support/resistance line. White lines indicates previous day high & low, high acts as a resistance & low acts as a support for next day.
Trendlines are also significant to price action. If the price is above/below the trendlines, can expect an UP/DOWN with aggressive move.
Please NOTE: this levels are for intraday trading only.
Disclaimer - All information on this page is for educational purposes only,
we are not SEBI Registered, Please consult a SEBI registered financial advisor for your financial matters before investing And taking any decision. We are not responsible for any profit/loss you made.
Request your support and engagement by liking and commenting & follow to provide encouragement
HAPPY TRADING 👍

Opening (IRA): SMH July 19th 189/199/255/265 Iron Condor... for a 2.23 credit.
Comments: A small engagement trade in the semiconductor ETF (31.5% 30-Day IV).
Going somewhat wide here with the deltas, with the short option legs camped out at 16 delta on both sides. I generally like to collect one-third the width of the wings in credit for these, but am going a little more long-dated than usual, so want to give it a smidge more room to be wrong.
The assumption here is neutral, with the bet being that it slops around between my short option strikes. I'll generally look to take profit at 50% max and/or adjust sides on approaching worthless or on side test.
Metrics:
Buying Power Effect: 7.77
Max Profit: 2.23
ROC at Max: 28.70%
ROC at 50% Max: 14.35%
Delta/Theta: .37/3.01

Opening (IRA): ARKK May 17th 44 Monied Covered Call... for a 43.00 debit.
Comments: High IVR/IV at 52.7/38.7.
Going monied here, buying a Johnny one lot and selling the -75 delta call against to emulate the delta metrics of a 25 delta short put to take advantage of elevated IV on the call side and to have built-in position defense via the short call. This is slightly shorter duration than I like to go (39 DTE), but I also don't have a ton on here, so scrounging around for decent IV underlyings. Cathie also doesn't pay divvies but once a year in December, so there's no point in hanging around in the stock for any period of time.
Will generally look to take profit at 50% max on the whole shebang (stock + short call) and/or roll out the short call if it hits 50% max to reduce cost basis further.
Metrics:
Buying Power Effect/Cost Basis In Stock/Break Even: 43.00/share
Max Profit: 1.00
ROC at Max as a Function of Buying Power Effect: 2.33%
ROC at 50% Max: 1.16%
As previously noted in my other monied covered call posts, this only makes sense in a cash secured environment where you don't get BP relief going short put. On margin, short put will be the most BP efficient.

Rolling (IRA): XBI May 17th 88 Short Call to June 21st 88... for a 1.25 credit.
Comments: Rolling out the short call aspect of my XBI covered call at ~50% max to the June expiry for a 1.25 credit.
Cost basis now 85.94 (See Post Below) minus 1.25 or 84.69.

BANK NIFTY INTRADAY LEVELS FOR 13/05/2024BUY ABOVE - 47560
SL - 47400
TARGETS - 47730,47900,48050
SELL BELOW - 47400
SL - 47560
TARGETS - 47200,47000,46800
NO TRADE ZONE - 47400 to 47560
Previous Day High - 47900
Previous Day Low - 47400
Based on price action major support & resistance's are here, the red lines acts as resistances, the green lines acts as supports. If the price breaks the support/resistance, it will move to the next support/resistance line. White lines indicates previous day high & low, high acts as a resistance & low acts as a support for next day.
Trendlines are also significant to price action. If the price is above/below the trendlines, can expect an UP/DOWN with aggressive move.
Please NOTE: this levels are for intraday trading only.
Disclaimer - All information on this page is for educational purposes only,
we are not SEBI Registered, Please consult a SEBI registered financial advisor for your financial matters before investing And taking any decision. We are not responsible for any profit/loss you made.
Request your support and engagement by liking and commenting & follow to provide encouragement
HAPPY TRADING 👍

NIFTY INTRADAY LEVELS FOR 13/05/2024BUY ABOVE - 22070
SL - 22020
TARGETS - 22120,22180,22240
SELL BELOW - 22020
SL - 22070
TARGETS - 21960,21900,21850
NO TRADE ZONE - 22020 to 22070
Previous Day High - 22120
Previous Day Low - 21960
Based on price action major support & resistance's are here, the red lines acts as resistances, the green lines acts as supports. If the price breaks the support/resistance, it will move to the next support/resistance line. White lines indicates previous day high & low, high acts as a resistance & low acts as a support for next day.
Trendlines are also significant to price action. If the price is above/below the trendlines, can expect an UP/DOWN with aggressive move.
Please NOTE: this levels are for intraday trading only.
Disclaimer - All information on this page is for educational purposes only,
we are not SEBI Registered, Please consult a SEBI registered financial advisor for your financial matters before investing And taking any decision. We are not responsible for any profit/loss you made.
Request your support and engagement by liking and commenting & follow to provide encouragement
HAPPY TRADING 👍

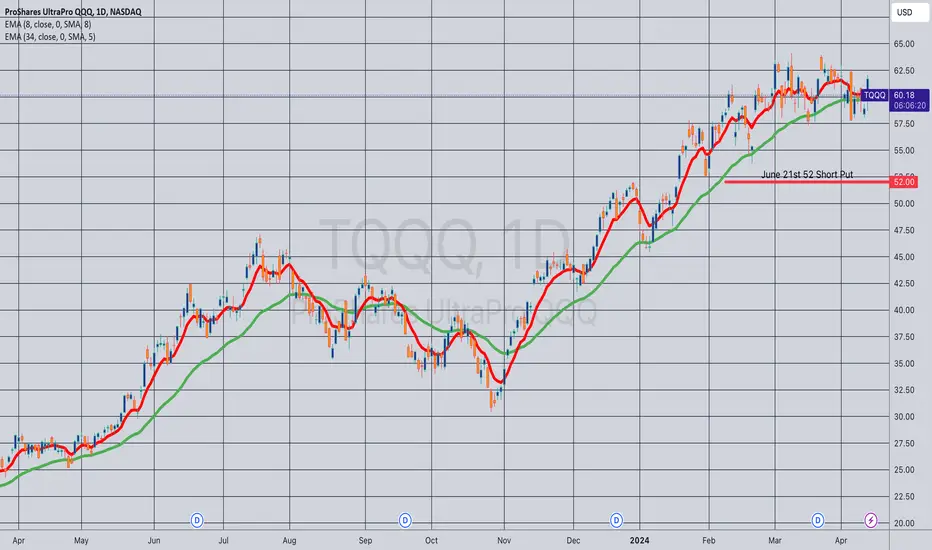
Opening (IRA): TQQQ June 21st 52 Short Put... for a 2.49 credit.
Comments: Adding to my TQQQ position on weakness ... . This is a bit longer-dated than I like to go with shorter duration premium selling, which I like to keep in that 45 DTE wheelhouse, but May has now only 35 days in it, and I like to stick to monthlies in all but the most options liquid underlyings.
Will generally look to take profit at 50% max. I'm fine with being assigned, then proceeding to sell call against if that occurs.
Metrics:
BPE/Break Even: 49.51
Max Profit: 2.49 ($249)
ROC at Max Profit: 5.03%
ROC at 50% Max: 2.51%
Delta/Theta: 24.36/3.37
Opened (IRA): TQQQ May 17th 55 Monied Covered CallBought a one lot of shares and sold an in-the-money -75 delta call to emulate a 25 delta short put to take advantage of call IV skew and to have built-in pro via the short call.
Metrics:
Break Even/Cost Basis in Shares: 52.71
Max Profit: 2.29 ($229)
ROC %-age at Max: 4.34%
ROC %-age at 50% Max: 2.17%
Will generally look to take profit at 50% max, add at intervals at a strike/cost basis better than what I currently have on should weakness present itself.

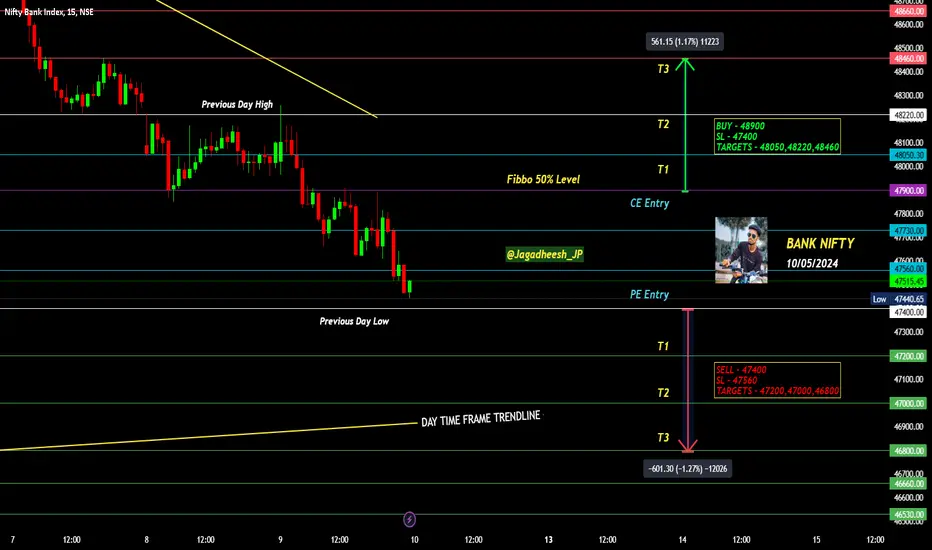
BANK NIFTY INTRADAY LEVELS FOR 10/05/2024BUY ABOVE - 48900
SL - 47400
TARGETS - 48050,48220,48460
SELL BELOW - 47400
SL - 47560
TARGETS - 47200,47000,46800
NO TRADE ZONE - 47400 to 47900
Previous Day High - 48220
Previous Day Low - 47400
Based on price action major support & resistance's are here, the red lines acts as resistances, the green lines acts as supports. If the price breaks the support/resistance, it will move to the next support/resistance line. White lines indicates previous day high & low, high acts as a resistance & low acts as a support for next day.
Trendlines are also significant to price action. If the price is above/below the trendlines, can expect an UP/DOWN with aggressive move.
Please NOTE: this levels are for intraday trading only.
Disclaimer - All information on this page is for educational purposes only,
we are not SEBI Registered, Please consult a SEBI registered financial advisor for your financial matters before investing And taking any decision. We are not responsible for any profit/loss you made.
Request your support and engagement by liking and commenting & follow to provide encouragement
HAPPY TRADING 👍
NIFTY INTRADAY LEVELS FOR 10/05/2024BUY ABOVE - 22070
SL - 22020
TARGETS - 22120,22180,22240
SELL BELOW - 21960
SL - 22020
TARGETS - 21900,21850,21800
NO TRADE ZONE - 21960 to 22070
Previous Day High - 22300
Previous Day Low - 21960
Based on price action major support & resistance's are here, the red lines acts as resistances, the green lines acts as supports. If the price breaks the support/resistance, it will move to the next support/resistance line. White lines indicates previous day high & low, high acts as a resistance & low acts as a support for next day.
Trendlines are also significant to price action. If the price is above/below the trendlines, can expect an UP/DOWN with aggressive move.
Please NOTE: this levels are for intraday trading only.
Disclaimer - All information on this page is for educational purposes only,
we are not SEBI Registered, Please consult a SEBI registered financial advisor for your financial matters before investing And taking any decision. We are not responsible for any profit/loss you made.
Request your support and engagement by liking and commenting & follow to provide encouragement
HAPPY TRADING 👍

Technical Analysis: EURUSD potential Double Bottom EURUSD is looking quite bearish right now. Many of our Indicators are showing signs the price may continue to drop for a few days.
Our Sell Momentum has yet to end and our Momentum and Fear & Greed Index oscillators are only showing Bearish sell pressure on this current bar. This means that the price could pull back out of this dump and continue upwards; only time will tell. However, it’s not looking good in the short term.
EURUSD’s overall trend is downwards and it looks like it may test its current bottom quite soon. This could be a great thing for bullish price movement if it only touches the bottom pivot and doesn’t crash through; as it would signify a double bottom.
We will conclude with, EURUSD is looking quite bearish in the short term with strong bullish potential if the double bottom occurs.

BANK NIFTY INTRADAY LEVELS FOR 09/05/2024BUY ABOVE - 48220
SL - 48050
TARGETS - 48460,48660,48800
SELL BELOW - 47900
SL - 48050
TARGETS - 47730,47560,47400
NO TRADE ZONE - 47900 to 48220
Previous Day High - 48220
Previous Day Low - 47900
Based on price action major support & resistance's are here, the red lines acts as resistances, the green lines acts as supports. If the price breaks the support/resistance, it will move to the next support/resistance line. White lines indicates previous day high & low, high acts as a resistance & low acts as a support for next day.
Trendlines are also significant to price action. If the price is above/below the trendlines, can expect an UP/DOWN with aggressive move.
Please NOTE: this levels are for intraday trading only.
Disclaimer - All information on this page is for educational purposes only,
we are not SEBI Registered, Please consult a SEBI registered financial advisor for your financial matters before investing And taking any decision. We are not responsible for any profit/loss you made.
Request your support and engagement by liking and commenting & follow to provide encouragement
HAPPY TRADING 👍

NIFTY INTRADAY LEVELS FOR 09/05/2024BUY ABOVE - 22350
SL - 22300
TARGETS - 22420,22470,22510
SELL BELOW - 22240
SL - 22300
TARGETS - 22200,22160,22100
NO TRADE ZONE - 22240 to 22350
Previous Day High - 22350
Previous Day Low - 22200
Based on price action major support & resistance's are here, the red lines acts as resistances, the green lines acts as supports. If the price breaks the support/resistance, it will move to the next support/resistance line. White lines indicates previous day high & low, high acts as a resistance & low acts as a support for next day.
Trendlines are also significant to price action. If the price is above/below the trendlines, can expect an UP/DOWN with aggressive move.
Please NOTE: this levels are for intraday trading only.
Disclaimer - All information on this page is for educational purposes only,
we are not SEBI Registered, Please consult a SEBI registered financial advisor for your financial matters before investing And taking any decision. We are not responsible for any profit/loss you made.
Request your support and engagement by liking and commenting & follow to provide encouragement
HAPPY TRADING 👍

BANK NIFTY INTRADAY LEVELS FOR 08/05/2024BUY ABOVE - 48460
SL - 48220
TARGETS - 48660,48800,48970
SELL BELOW - 48220
SL - 48460
TARGETS - 48120,47940,47730
NO TRADE ZONE - 48220 to 48460
Previous Day High - 49970
Previous Day Low - 48220
Based on price action major support & resistance's are here, the red lines acts as resistances, the green lines acts as supports. If the price breaks the support/resistance, it will move to the next support/resistance line. White lines indicates previous day high & low, high acts as a resistance & low acts as a support for next day.
Trendlines are also significant to price action. If the price is above/below the trendlines, can expect an UP/DOWN with aggressive move.
Please NOTE: this levels are for intraday trading only.
Disclaimer - All information on this page is for educational purposes only,
we are not SEBI Registered, Please consult a SEBI registered financial advisor for your financial matters before investing And taking any decision. We are not responsible for any profit/loss you made.
Request your support and engagement by liking and commenting & follow to provide encouragement
HAPPY TRADING 👍

NIFTY INTRADAY LEVELS FOR 08/05/2024BUY ABOVE - 22350
SL - 22300
TARGETS - 22420,22470,22510
SELL BELOW - 22240
SL - 22300
TARGETS - 22200,22160,22100
NO TRADE ZONE - 22240 to 22350
Previous Day High - 22510
Previous Day Low - 22240
Based on price action major support & resistance's are here, the red lines acts as resistances, the green lines acts as supports. If the price breaks the support/resistance, it will move to the next support/resistance line. White lines indicates previous day high & low, high acts as a resistance & low acts as a support for next day.
Trendlines are also significant to price action. If the price is above/below the trendlines, can expect an UP/DOWN with aggressive move.
Please NOTE: this levels are for intraday trading only.
Disclaimer - All information on this page is for educational purposes only,
we are not SEBI Registered, Please consult a SEBI registered financial advisor for your financial matters before investing And taking any decision. We are not responsible for any profit/loss you made.
Request your support and engagement by liking and commenting & follow to provide encouragement
HAPPY TRADING 👍

RBLX Roblox Corporation Options Ahead of EarningsIf you haven`t bought RBLX before the previous earnings:
Then analyzing the options chain and the chart patterns of RBLX Roblox Corporation prior to the earnings report this week,
I would consider purchasing the 40usd strike price Calls with
an expiration date of 2024-7-19,
for a premium of approximately $3.60.
If these options prove to be profitable prior to the earnings release, I would sell at least half of them.

Options Blueprint Series: Ratio Spreads for the Advanced TraderIntroduction to Ratio Spreads on E-mini Dow Jones Futures
In the dynamic world of options trading, Ratio Spreads stand out as a sophisticated strategy designed for traders looking to leverage market nuances to their advantage. Regular options on the E-mini Dow Jones Futures are a popular choice (YM).
Defining the E-mini Dow Jones (YM) Futures Contract
Before delving into the specifics of Ratio Spreads, understanding the underlying contract on which these options are based is crucial. The E-mini Dow Jones Futures, symbol YM, offers traders exposure to the 30 blue-chip companies of the Dow Jones Industrial Average in a smaller, more accessible format. Each YM contract represents $5 per index point.
Key Contract Specifications:
Point Value: $5 per point of the Dow Jones Industrial Average.
Trading Hours: Sunday - Friday, 6:00 PM - 5:00 PM (Next day) ET with a trading halt from 5:00 PM - 6:00 PM ET daily.
Margins: Varied based on broker but generally lower than the full-sized contracts, providing a cost-effective entry for various trading strategies. CME Group suggests $8,400 per contract at the time of this publication.
Ratio Spread Margins: Often require a careful calculation as they involve multiple positions. Traders must consult with their brokers to understand the specific margin requirements for entering into ratio spreads using YM futures. Margins for Ratio Spreads are often equal to the margin requirement when trading the outright futures contract.
Understanding Ratio Spreads
Ratio Spreads involve buying and selling different amounts of options at varying strike prices, but within the same expiration period. This strategy is typically employed to exploit expected directional moves or stability in the underlying asset, with an additional emphasis on benefiting from time decay.
Types of Ratio Spreads:
Call Ratio Spread: Involves buying calls at a lower strike price and selling a greater number of calls at a higher strike price. This setup is generally used in mildly bullish scenarios.
Put Ratio Spread: Consists of buying puts at a higher strike price and selling more puts at a lower strike price, suitable for mildly bearish market conditions.
Mechanics:
Execution: Traders initiate these spreads by first determining their view on the market direction. For a bullish outlook, a call ratio spread is suitable; for a bearish view, a put ratio spread would be applicable.
Objective: The primary goal is to benefit from the premium decay of the short positions outweighing the cost of the long positions. This is enhanced if the market moves slowly towards the strike price of the short options or remains at a standstill.
Risk Management: It's crucial to manage risks as these spreads can lead to limited losses if the market moves against the trader, or surprisingly to many, to unlimited losses if the market moves sharply in the desired direction. Proper stop-loss settings, adjustments and continual market analysis are imperative.
Focused Strategy: Bullish Call Ratio Spread
In the context of the E-mini Dow Jones, considering the current upward trend with potential slow advancement due to overhead UFO (UnFilled Orders) Resistances, a Bullish Call Ratio Spread can be particularly effective. This strategy allows traders to capitalize on the gradual upward movement while keeping a lid on risks associated with faster, unexpected spikes.
Strategy Setup:
Selecting Strikes: Choose a lower strike where the long calls are bought and a higher strike where more calls are sold. The selection depends on the resistance levels indicated by the UFOs.
Position Sizing: Typically, the number of calls sold is higher than those bought, maintaining a ratio that aligns with the trader's risk tolerance and market outlook.
Market Conditions: Best implemented when expecting a gradual increase in the market, allowing time decay to erode the value of the short call positions advantageously.
Real-time Market Example: Bullish Call Ratio Spread on E-mini Dow Jones Futures
Given the current market scenario where the Dow Jones Index is experiencing a bullish breakout, it’s crucial to align our options trading strategy to take advantage of potential slow upward movements signaled by overhead UFO Resistances. This setup suggests a favorable environment for a Bullish Call Ratio Spread, aiming to maximize the benefits of time decay while managing risk exposure effectively.
Setting Up the Bullish Call Ratio Spread:
1. Selection of Strike Prices:
Long Calls: Choose a strike price near the current market level (Strike = 39000).
Short Calls: Set the higher strike prices right at or above the identified UFO Resistances (Strike = 41000). The rationale here is that these levels are expected to cap the upward movement, thus enhancing the likelihood that these short calls expire worthless or decrease in value, maximizing the time decay benefit.
2. Ratio of Calls:
Opt for a ratio that reflects confidence in the bullish movement but also cushions against an unexpected rally. A common setup might be 1 long call for every 2 short calls.
Execution:
Trade Entry: Enter the trade when you observe a confirmed break above a minor resistance or a pullback that respects the upward trend structure.
Monitoring: Regularly monitor the price action as it approaches the UFO Resistances. Adjust the position if the market shows signs of either stalling or breaking through these levels more robustly than anticipated.
Trade Management:
Adjustments: If the market advances towards the higher strike more quickly than expected, consider buying back some short calls to reduce exposure.
Risk Control: Implement stop-loss orders to mitigate potential losses should the market move sharply against the position. This could be set at a level where the market structure changes from bullish to bearish.
This real-time scenario provides a practical example of how advanced traders can utilize Bullish Call Ratio Spreads to navigate complex market dynamics effectively, leveraging both market sentiment and technical resistance points to structure a potentially profitable trade setup.
Advantages of Ratio Spreads in Options Trading
Ratio Spreads offer a strategic advantage in options trading by balancing the potential for profit with a controlled risk management approach. Here are some key benefits of incorporating Ratio Spreads into your trading arsenal:
1. Maximizing Time Decay
Optimized Premium Decay: By selling more options than are bought, traders can capitalize on the accelerated decay of the premium of short positions. This is particularly advantageous in markets exhibiting slow to moderate price movements, as expected with the current Dow Jones trend influenced by UFO resistances.
2. Cost Efficiency
Reduced Net Cost: The cost of purchasing options is offset by the income received from selling options, reducing the net cost of entering the trade. This can provide a more affordable way to leverage significant market positions without a substantial upfront investment. The Net Debit paid is 403.4 (690 – 143.3 – 143.3) = $2,017 since each YM point is worth $5.
Note: We are using the CME Group Options Calculator in order to generate fair value prices and Greeks for any options on futures contracts.
3. Profit in Multiple Market Conditions
Versatile Profit Scenarios: Depending on the setup, Ratio Spreads can be profitable in a stagnant, slightly bullish, or slightly bearish market. The key is the strategic selection of strike prices relative to expected market behavior, enabling profits through slight directional moves while protected against losses from significant adverse moves.
4. Flexible Adjustments
Scalability and Reversibility: Given their structure, Ratio Spreads allow for easy scaling or reversing positions depending on market movements and trader outlook. This flexibility can be a critical factor in dynamic markets where adjustments need to be swift and cost-effective.
Risk Management in Ratio Spreads
While Ratio Spreads offer several benefits, they are not without risks, particularly from significant market moves that can lead to potentially unlimited losses. Here’s how to manage those risks:
Stop-Loss Orders: Setting stop-losses at predetermined levels can help traders exit positions that move against them, preventing larger losses.
Position Monitoring: Regular monitoring and analysis are crucial, especially as the market approaches or reaches the strike price of the short options.
Adjustments: Being proactive about adjusting the spread, either by buying back short options or by rolling the positions to different strikes or expiries, can help manage risk and lock in profits.
Conclusion
Ratio Spreads, particularly in the format of Bullish Call Ratio Spreads demonstrated with E-mini Dow Jones Futures, offer a sophisticated strategy that balances potential profit with manageable risks. This approach is suited for traders who have a nuanced understanding of market dynamics and can navigate the complexities of options with strategic finesse.
When charting futures, the data provided could be delayed. Traders working with the ticker symbols discussed in this idea may prefer to use CME Group real-time data plan on TradingView: www.tradingview.com This consideration is particularly important for shorter-term traders, whereas it may be less critical for those focused on longer-term trading strategies.
General Disclaimer:
The trade ideas presented herein are solely for illustrative purposes forming a part of a case study intended to demonstrate key principles in risk management within the context of the specific market scenarios discussed. These ideas are not to be interpreted as investment recommendations or financial advice. They do not endorse or promote any specific trading strategies, financial products, or services. The information provided is based on data believed to be reliable; however, its accuracy or completeness cannot be guaranteed. Trading in financial markets involves risks, including the potential loss of principal. Each individual should conduct their own research and consult with professional financial advisors before making any investment decisions. The author or publisher of this content bears no responsibility for any actions taken based on the information provided or for any resultant financial or other losses.

GOLD - Bearish Correction Incoming!Gold / XAUUSD has potential for a small bullish pump over the next few days; followed by a bearish correction.
We have some Buy Signal Momentum currently going; it hasn't ended yet but this current bar is displaying it; this implies now is still considered to be a good time to buy but may not be tomorrow! The buy rating started at 1☆ and is closing at a 2☆; this may imply a push back to the $2474 region.
Gold has consolidated for quite awhile meaning that it's RSI has had some time to cool down and is now relatively neutral at 55; however our YinYang RSI is still saying quite overvalued and that a dump is underway.
Conclusion: A small pump may occur over the next few days; however we don't think this is long term. We believe Gold may get rejected ~2474 and continue in a downtrend towards the 2190 region.

IBKR Interactive Brokers Group Options Ahead of EarningsAnalyzing the options chain and the chart patterns of IBKR Interactive Brokers Group prior to the earnings report this week,
I would consider purchasing the 135usd strike price Calls with
an expiration date of 2024-9-20,
for a premium of approximately $2.20.
If these options prove to be profitable prior to the earnings release, I would sell at least half of them.

Opening (IRA): SPY September 20th 445 Short Put... for a 4.64 credit.
Comments: Targeting the <16 delta strike paying around 1% of the strike price in credit to emulate dollar cost averaging into the broad market.
Was starting to get somewhat worried that we would never have decent IV again. This ain't great, but I'll take it ... . Will generally look to take profit at 50% max.

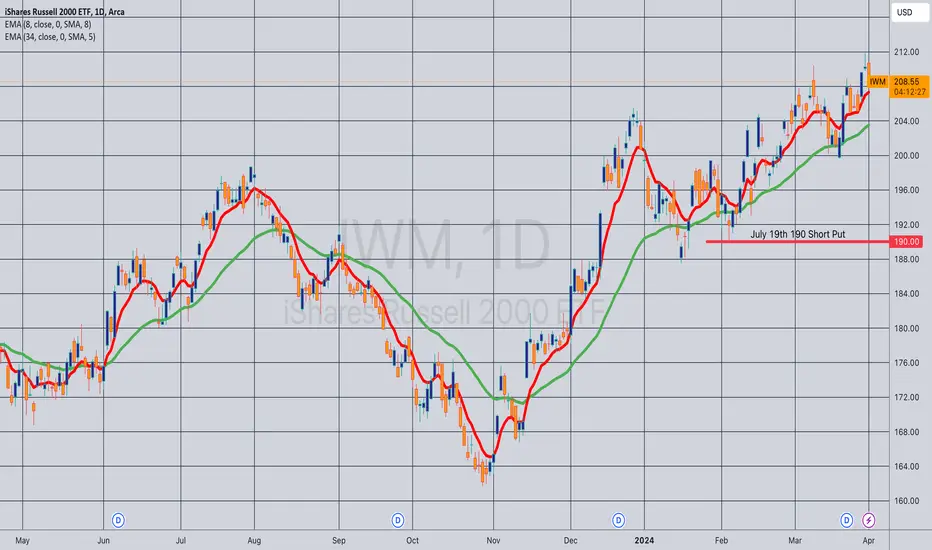
Opening (IRA): IWM July 19th 190 Short Put... for a 2.33 credit.
Comments: Targeting the shortest duration <16 delta strike paying around 1% of the strike price in credit to emulate dollar cost averaging into the broad market. (This is actually at the 18 delta, but it was either the 190 or the 185 where I wanted to pitch my tent from a delta standpoint).
Starting to slowly deploy third quarter rungs here in broad market (IWM, QQQ, SPY) while I piddle around with shorter duration higher IV sector ETF stuff.
BANK NIFTY INTRADAY LEVELS FOR 07/05/2024BUY ABOVE - 48970
SL - 48800
TARGETS - 49130,49300,49480
SELL BELOW - 48800
SL - 48970
TARGETS - 48660,48500,48400
NO TRADE ZONE - 48800 to 48970
Previous Day High - 49300
Previous Day Low - 48800
Based on price action major support & resistance's are here, the red lines acts as resistances, the green lines acts as supports. If the price breaks the support/resistance, it will move to the next support/resistance line. White lines indicates previous day high & low, high acts as a resistance & low acts as a support for next day.
Trendlines are also significant to price action. If the price is above/below the trendlines, can expect an UP/DOWN with aggressive move.
Please NOTE: this levels are for intraday trading only.
Disclaimer - All information on this page is for educational purposes only,
we are not SEBI Registered, Please consult a SEBI registered financial advisor for your financial matters before investing And taking any decision. We are not responsible for any profit/loss you made.
Request your support and engagement by liking and commenting & follow to provide encouragement
HAPPY TRADING 👍
