Opening (IRA): UNG March 21st 18/June 20th 35 LPD*... for a 15.04 debit.
Comments: Fading this natural gas move here with a long put diagonal, buying the back month -90 delta put and selling the front month 25. The 35 long put is shown at the 21 strike due to the 35 being off the chart.
Metrics:
Max Profit: 1.96
Buying Power Effect: 15.04
ROC at Max: 13.03%
Break Even: 19.96 relative to 19.68 spot
Will generally look to take profit at 110% of what I put it on for, roll out the short put on approaching worthless.
* -- Long put diagonal.
Optionsstrategies

Opening (IRA): TTD May 16th -70C/October 17th 32.5C LCD*... for a 26.10 debit.
Comments: At or near 52-week lows. Buying the back month 90 delta and selling the front month that pays for all of the extrinsic in the long. (The October 17th 32.5C is shown at the 50 strike to fit it on the chart).
Metrics:
Buying Power Effect: 26.10 debit
Break Even: 58.60/share
Max Profit: 11.40
ROC at Max: 43.7%
10% Max: 2.61
ROC at 10% Max: 10.0%
In this particular case, I'll look to take profit at 110% of what I put it on for and/or roll out the short call if it hits 50% max. Earnings are on 5/14, so my preference would be to take it off before then ... .
* -- Long Call Diagonal.

Opening (IRA): TQQQ April 4th 70 Covered Call... for a 68.05 debit.
Comments: Starter position in the first weekly in April ... .
Metrics:
Buying Power Effect/Break Even: 68.05
Max Profit: 1.95
ROC at Max: 2.87%
50% Max: .98
ROC at 50% Max: 1.44%
Will generally look to take profit at 50% max, add at intervals assuming I can get in at strikes better than what I currently have on, and/or roll out short call if my take profit is not hit.

Opening (IRA): TQQQ April 17th 60 Covered Call... for a 57.91 debit.
Comments: Adding at strikes better than what I currently have on ... . Here, going lower net delta by selling the -84 call against shares to emulate the delta metrics of a 2 x expected move 16 delta short put, but with the built-in defense of the short call.
Metrics:
Buying Power Effect/Break Even: 57.91/share
Max Profit: 2.09
ROC at Max: 3.61%
50% Max: 1.05
ROC at 50% Max: 1.82%
Will generally look to take profit at 50% max, add at intervals if I can get in at strikes better than what I currently have on, and/or roll out short call if my take profit is not hit.

Opening (IRA): TNA March 28th 35 Covered Call... for a 34.04 debit.
Comments: Adding at strikes better than what I currently have on, selling the -84 delta call against shares to emulate the delta metrics of a 16 delta short put, but with the built-in defense of the short call. Going lower net delta here as a personal choice, since I've already made goal for February, so don't see the need to take on my normal amount of risk.
Metrics:
Buying Power Effect/Break Even: 34.04/share
Max Profit: .96
ROC at Max: 2.82%
50% Max: .48
ROC at 50% Max: 1.41%
Will generally look to take profit at 50% max, add to the position at intervals if I can get in at strikes/break evens better than what I currently have on, and/or roll out my short call on approaching worthless if my take profit hasn't hit.

Opening (IRA): TNA April 17th 31 Covered Call... for a 29.98 debit.
Comments: Starting a run at April (56 DTE) at strikes better than what I currently have on.
Metrics:
Buying Power Effect/Break Even: 29.98/share
Max Profit: 1.02
ROC at Max: 3.40%
50% Max: .51
ROC at 50% Max: 1.70%
Will generally look to take profit at 50% max, add at intervals assuming I can get in at strike prices better than what I currently have on, and/or roll out short call if my take profit is not hit.

Opening (IRA): TNA April 17th 29 Covered Call... for a 28.28 debit.
Comments: Adding at strikes better than what I currently have on. Selling the -84 delta call against shares to emulate the delta metrics of a 16 delta short put, but with the built-in defense of the short call.
Metrics:
Buying Power Effect/Break Even: 28.28/share
Max Profit: .72
ROC at Max: 2.55%
50% Max: .36
ROC at 50% Max: 1.28%
Will generally look to take profit at 50% max, add at intervals assuming I can get in at strikes better than what I currently have on, roll out short call in the event my take profit is not hit.

Opening (IRA): SPX May 16th 5000/5030/5785/5815 Iron Condor... for a 10.45 credit.
Comments: High IVR. After having taken small profit on the setup I put on before "Liberation Day," back in with a more symmetric setup in a higher IV environment.
Metrics:
Buying Power Effect: 19.55
Max Profit: 10.45
ROC at Max: 53.45%
50% Max: 5.23
ROC at 50% Max: 26.73%
Will generally look to take profit at 50% max, roll in untested side on side test, manage at 21 DTE.

Opening (IRA): SPXL March 21st 154 Covered Call... for a 151.04 debit.
Comments: Selling the -84 call against shares to emulate the delta metrics of a 16 delta short put, but with the built-in defense of the short call. (In all honesty, this is just an attempt to keep my theta/net liquidity ratio above .05, which is kind of the minimum of where I like to have it).
Metrics:
Buying Power Effect/Break Even: 151.04/share
Max Profit: 3.96
ROC at Max: 1.96%
50% Max: 1.98
ROC at 50% Max: .98

Opening (IRA): SOXL March 21st 29 Covered Call... for a 26.85 debit.
Comments: High IV; starter position. Selling the -75 delta call against shares to emulate the delta metrics of a 25 delta short put, but with the built-in defense of the short call.
Metrics:
Buying Power Effect/Break Even: 26.85
Max Profit: 2.15
ROC at Max: 8.01%
50% Max: 1.08
ROC at 50% Max: 4.00%
Will generally look to take profit at 50% max, add at intervals if I can get in at better strikes/better break evens than what I currently have on, and/or roll out the short call if take profit is not hit.

Opening (IRA): SOXL April 17th 24 Covered Call... for 22.48 debit.
Comments: Starting my run at April, adding at strikes better than what I currently have on.
Metrics:
Buying Power Effect/Break Even: 22.48
Max Profit: 1.52
ROC at Max: 6.76%
50% Max: .76
ROC at 50% Max: 3.38%
Will generally look to take profit at 50% max, add at intervals assuming I can get in at strikes better than what I currently have on, and/or roll out short call if my take profit is not hit.

Opening (IRA): SOXL May 16th 17 Covered Call... for a 15.68 debit.
Comments: Laddering out a smidge here, selling the -84 delta call against shares to emulate the delta metrics of a 16 delta short put, but with the built-in defense of the short call.
Metrics:
Buying Power Effect/Break Even: 15.68
Max Profit: 1.32
ROC at Max: 8.42%
50% Max: .66
ROC at 50% Max: 4.21%
Will generally look to take profit at 50% max, add at intervals, assuming I can get in at strikes/break evens than what I currently have on, and/or roll out short call if my take profit is not hit.
Opening (IRA): SMCI April 17th 34 Covered Call... for a 32.13 debit.
Comments: High IVR/IV. Selling the -84 delta call against shares to emulate the delta metrics of a 2 x expected move 16 delta short put, but with the built-in defense of the short call.
Metrics:
Buying Power Effect/Break Even: 32.13/share
Max Profit: 1.87
ROC at Max: 5.82%
50% Max: .94
ROC at 50% Max: 2.91%
Will generally look to take profit at 50% max, roll out short call if take profit is not hit.

Opening (IRA): PYPL February 21st 77.5/82.5/97/102 Iron Condor... for a 1.66 credit.
Comments: Earnings announcement volatility contraction play.
Metrics:
Max Profit: 1.66
Buying Power Effect: 3.34
ROC at Max: 49.70%
50% Max: .84
ROC at 50% Max: 24.85%

Opening (IRA): PLTR May 17th 100 Covered Call... for a 86.55 debit.
Comments: After closing out my long-dated covered call for a realized gain, re-upping with a shorter duration setup with a max profit potential of greater than 11.18, which is what I'm net down on this underlying YTD.
Metrics:
Buying Power Effect/Break Even: 86.55
Max Profit: 13.45
Will look to roll out the short call at 50% max to reduce my break even.

Opening (IRA): LULU April 17th 300/310/390/400 Iron Condor... for a 3.39 credit.
Comments: Delta neutral earnings announcement IV contraction play.
Metrics:
Buying Power Effect: 6.61
Max Profit: 3.39
ROC at Max: 51.3%
50% Max: 1.70
ROC at 50% Max: 25.6%
Will generally look to take profit at 50% max ... .

Opening (IRA): IWM May 16th 190/195/220/225 Iron Condor... for a 1.70 credit.
Comments: I think I have more than enough long delta on at the moment, so opting to go nondirectional/delta neutral here. Selling the 25's and buying the wings out from there, collecting one-third the width of the wings in credit.
Metrics:
Buying Power Effect: 3.30
Max Profit: 1.70
ROC at Max: 51.5%
50% Max: .85
ROC at 50% Max: 25.8%
Will generally look to take profit at 50% max, roll in oppositional side on side test.

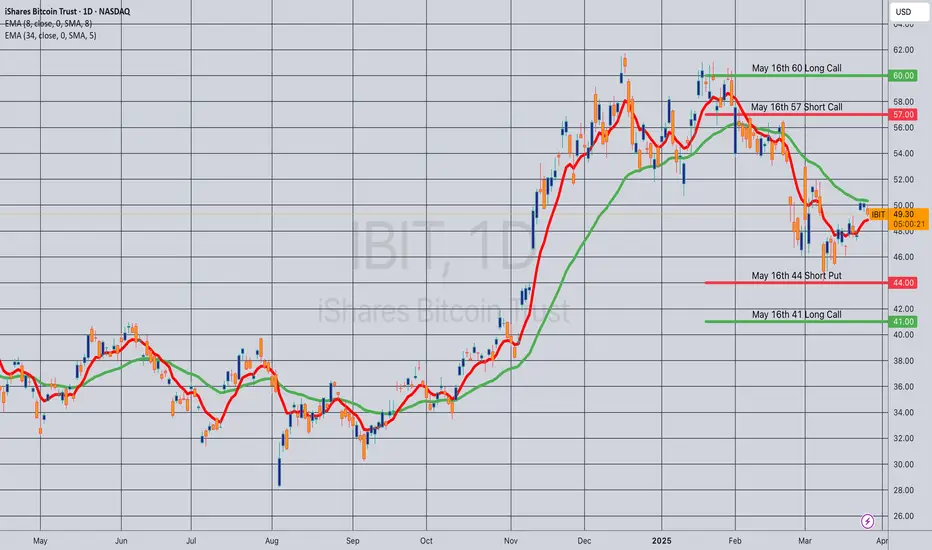
Opening (IRA): IBIT May 16th 41/44/57/60 Iron Condor... for a 1.02 credit.
Comments: Going neutral assumption here, selling the 25 delta's and buying wings 3 strikes out, collecting one-third the width of the wings.
Metrics:
Buying Power Effect: 1.98
Max Profit: 1.02
ROC at Max: 51.5%
50% Max: .51
ROC at 50% Max: 25.8%
Will generally look to take profit at 50% max, roll wings in on side test.
Update: EWZ December 2026 32 Covered CallHere, starting to break my EWZ position (See Post Below) into its constituent pieces.
The first piece involves shares I acquired way back at 31.65/share. (Ugh). Rather than go back and calculate trade to date break even, I'm going out far in duration to sell the short call at or above my break even. Sometimes, you have to go way longer dated than you'd like, but I'm fine with devoting some buying power to this, particularly since EWZ pays a fairly decently dividend, albeit only twice a year.
The remaining legs are the January 17th 26 short put -- on which I'm pretty sure I'll be assigned shares, and the January 17th 23 short put, which is in-the-money by .50 or so. On assignment, I'll look to sell the call at the strike at which I was assigned and go from there ... .

Opening (IRA): EWZ Oct 17th 26/45 Short Call Vertical... for a 1.13 credit.
Comments: I'm fairly certain that I'm going to be assigned on my January 17th 26 short put, so am going out to October to sell a spread with the short leg at the 26 strike that pays at least 1.00. The reason I do this (sell a call for at least 1.00), is that this enables me to roll the short call down a strike by 1.00 without giving up profit potential if I need to. The 26 short call aspect of this spread will become the short call aspect of an October 17th 26 covered call, with the covered call setup having a break even of the strike at which I was assigned (26) minus the 1.13 in credit I got paid for this spread or 24.87.
Because I haven't been assigned shares yet and short calls are generally verboten in a cash secured account like an IRA, I've had to pay a few bones (.05 to be exact), to define the risk of the short call. I also had to pay a debit that is equal to the width of the spread (19.00) minus the credit received of 1.13 or 17.87 for the spread. I'm fine with this, since this buying power will eventually free up when I get assigned.
Naturally, the October expiry is extremely long-dated. I'm fine with this here, since EWZ pays a fairly decent dividend, albeit only in June and December.

Opening (IRA): COIN March 21st 220 Covered Call... for a 215.96 debit.
Comments: High IV + weakness. Selling the -85 delta call against shares to emulate the delta metrics of a 16 delta short put, but with the built-in defense of the short call. Going lower net delta due to the shorter duration (35 DTE).
Metrics:
Buying Power Effect/Break Even: 215.96/share
Max Profit: 4.04
ROC at Max: 1.87%
50% Max: 2.02
ROC at 50% Max: .94
Will generally look to take profit at 50% max, roll out short call if my take profit is not hit.

Opening (IRA): TMF May 17th 39 Covered Call... for a 38.06 debit.
Comments: Along with TLT, one of the only red things on my ETF board. Doing a starter position here, selling the -75 delta call against shares to emulate the delta metrics of a 25 delta short put, but with the built-in defense of the short call.
Metrics:
Buying Power Effect/Break Even: 38.06/share
Max Profit: .94
ROC at Max: 2.47%
50% Max: .47
ROC at 50% Max: 1.24%
Will generally look to take profit at 50% max, add at intervals if I can get in at strikes/break evens better than what I currently have on, and/or roll out the short call at 50% max.

Opening (IRA): SPX May 16th 5130/5160/5850/5880 Iron Condor... for a 10.20 credit.
Comments: High IVR/IV >21. Hesitant to add more long delta here, so going delta neutral in SPX and structuring the trade such that I receive one-third the width of the wings (30) in credit.
Metrics:
Buying Power Effect: 19.80
Max Profit: 10.20
ROC at Max: 51.52%
50% Max: 5.10
ROC at 50% Max: 25.8%
Will generally look to take profit at 50% max, rolling down oppositional side on side test, but won't hesitate to take profit quickly if IV crushes in dramatically post "Liberation Day."
