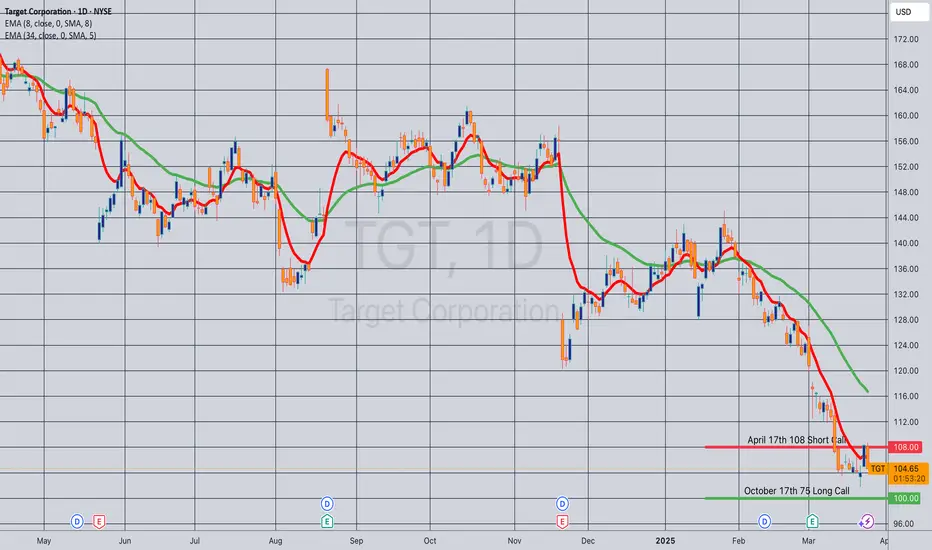
Opening (IRA): TGT April 17th -108C/October 17th 75C LCD*... for a 30.05 debit.
Comments: At or near a 52-week low. Buying the back month 90 delta and selling the front month strike that pays for all of the extrinsic in the long. (The 75C is shown at the 100 strike so that it fits on the chart).
Metrics:
Buying Power Effect: 30.05
Break Even: 105.05
Max Profit: 2.95
ROC at Max: 9.82%
50% Max: 1.48
ROC at 50% Max: 4.91%
Will generally look to take profit at 50% max and/or roll the short call at 50% max to lower my downside break even.
* -- Long Call Diagonal.
Optionsstrategies
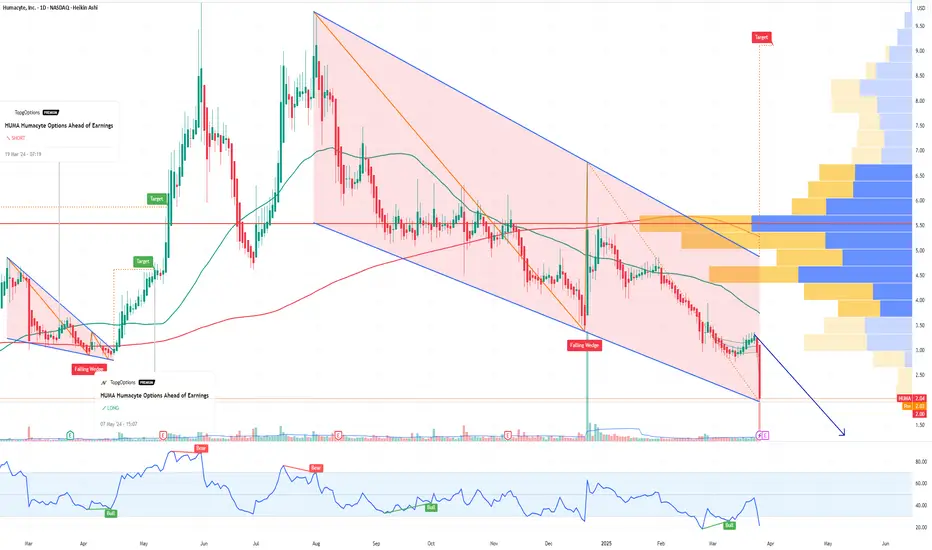
HUMA Humacyte Options Ahead of EarningsIf you haven`t bought HUMA before the previous rally:
Now analyzing the options chain and the chart patterns of HUMA Humacyte prior to the earnings report this week,
I would consider purchasing the 2.5usd strike price Puts with
an expiration date of 2025-4-17,
for a premium of approximately $0.62.
If these options prove to be profitable prior to the earnings release, I would sell at least half of them.
03/24 SPX Weekly GEX Outlook, Options FlowYou can see that every expiry has shifted into a stronger bullish stance heading into Friday, with GEX exposure moving upward across the board—though total net GEX is still in negative territory, while net DEX (delta exposure) is positive. This combination points toward a likely near-term rebound this week, which makes sense after testing the 5600 range last week….
Here’s a more detailed breakdown of the key zones and likely moves this week:
Bullish Target:
The current uptrend could reach 5750 on its first attempt (already reached in Monday, thx bullsh :) ). If a positive gamma squeeze emerges at that level, we might see an extension to 5800 or even 5850 as a final profit-taking zone for bulls this week.
HVL (Gamma Slip Zone):
Placed at 5680, this threshold currently supports a low-volatility environment. A drop below 5680, however, could reignite fear and fuel bearish momentum.
Put Floors & Net OI:
The largest net negative open interest (OI) cluster is at 5650, with the next key level near 5600. At 5600, net DEX reads fully positive, suggesting strong buying support if the market tests that lower boundary.

Opening (IRA): TQQQ May 16th 51 Covered Call... for a 48.05 credit.
Comments: Adding at a strike better than what I currently have on, selling the -75 delta call against shares to emulate the delta metrics of a 25 delta short put, but with the built-in defense of the short call.
Metrics:
Buying Power Effect/Break Even: 48.05
Max Profit: 2.95
ROC at Max: 6.14%
50% Max: 1.48%
ROC at 50% Max: 3.07%
Will generally look to take profit at 50% max, add at intervals if I can get in at strikes better than what I currently have on, and/or roll out short call at 50% max.

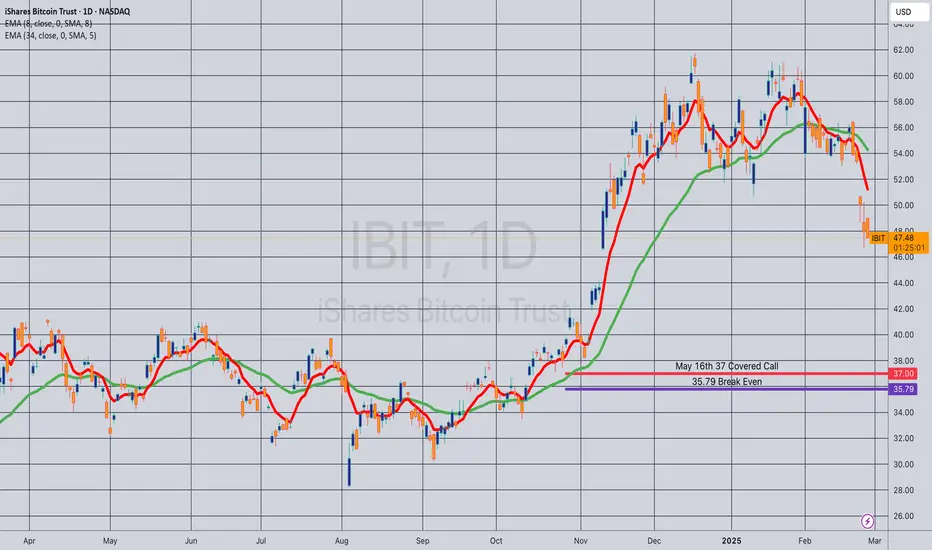
Opening (IRA): IBIT May 16th 37 Covered Call... for a 35.79 debit.
Comments: Laddering out a smidge here, selling the -84 delta call against shares to emulate the delta metrics of a 16 delta short put, but with the built-in defense of the short call.
Metrics:
Buying Power Effect/Break Even: 35.79
Max Profit: 1.21
ROC at Max: 3.38%
50% Max: .62
ROC at 50% Max: 1.69%
Will generally look to take profit at 50% max, add at intervals assuming I can get in at strikes/break evens better than what I currently have on, and/or roll out short call if my take profit is not hit.
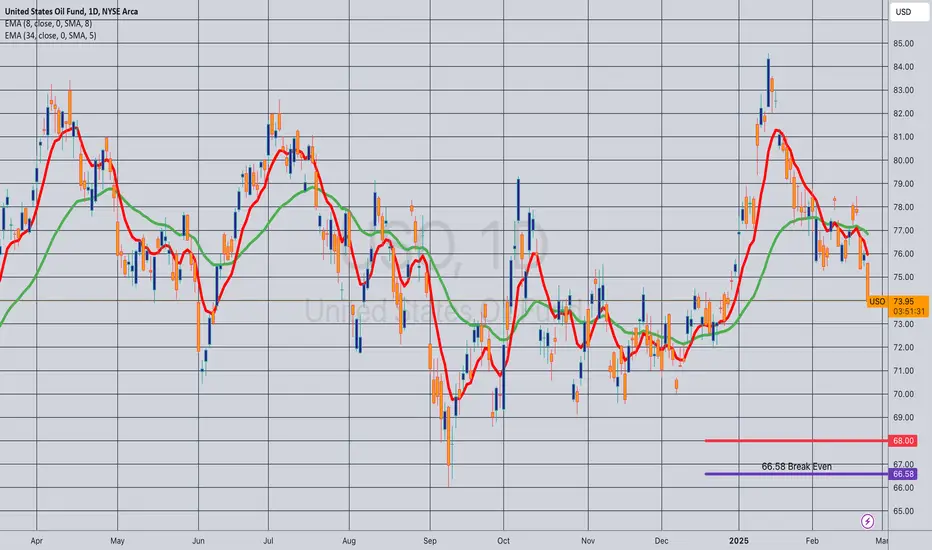
Opening (IRA): USO April 17th 68 Covered Call... for a 66.58 debit.
Comments: With /CL dropping sub-70/bbl., putting on a starter position in USO, selling the -75 delta call against shares to emulate the delta metrics of a 25 delta short put, but with the built-in defense of the short call.
Metrics:
Buying Power Effect/Break Even: 66.58/share
Max Profit: 1.42
ROC at Max: 2.13%
50% Max: .71
ROC at 50% Max: 1.07%
Will generally look to take profit at 50% max, add at intervals if I can get in at strikes/break evens better than what I currently have on, and/or roll out short call if my take profit is not hit.
Opening (IRA): XBI Sept 19th 60C/April 17th -90C LCD*... for a 26.68 debit.
Comments: Taking a bullish assumption directional shot near 52 week lows, buying the 90 delta back month and selling a front month that pays for all the extrinsic in the long, resulting in a break even that is at or below where the underlying is currently trading. The 60 long call is shown at 80 so that it fits on the chart ... .
Metrics:
Buying Power Effect: 26.68
Break Even: 86.88
Max Profit: 3.32
ROC at Max: 12.44%
50% Max: 1.66
ROC at 50% Max: 6.22%
Delta/Theta: 53.79/3.51
Will generally look to take profit on the setup as a unit at 50% max and/or roll out the short call at 50% max to reduce cost basis/downside break even.
* -- Long Call Diagonal

Opening (IRA): XRT April 17th 70/Sept 19th 50 LCD*... for a 17.57 debit.
Comments: And back into XRT, which is at/near 52 week lows with a long call diagaonl/Poor Man's Covered Call, buying the back month 90 and selling the front month that pays for all the extrinsic in the long.
Metrics:
Buying Power Effect: 17.57
Break Even: 67.57
Max Profit: 2.43
ROC at Max: 13.83%
50% Max: 1.22
ROC at 50% Max: 6.92%
Will generally look to take profit on the setup as a unit at 50% max and/or roll out the short call when it is at 50% max.

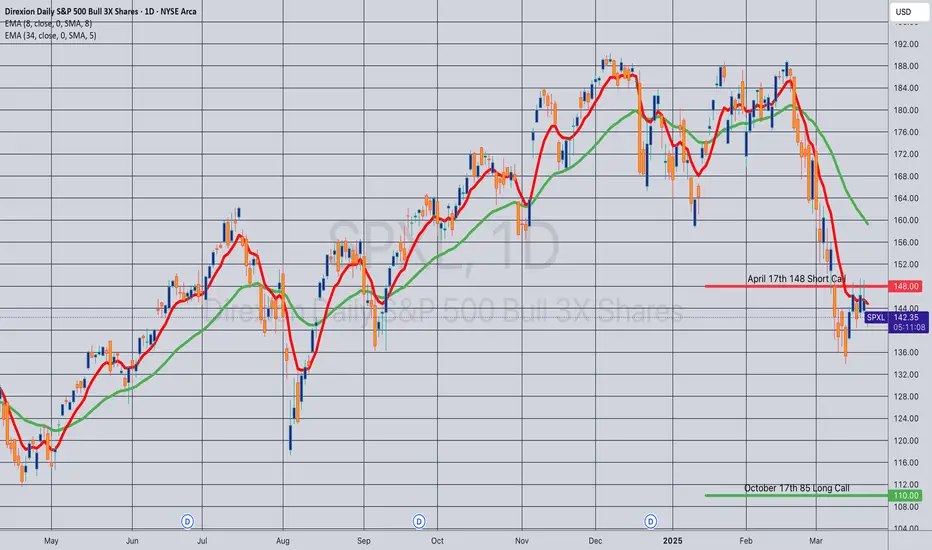
Opening (IRA): SPXL April 17th 148/October 17th 85 LCD*... for a 56.84 debit.
Comments: Looking to be a little bit more buying power efficient here ... . Buying the back month 90 delta and selling the front month that pays for all the extrinsic of the long.
Metrics:
Buying Power Effect: 56.84
Break Even: 141.84
Max Profit: 6.16
ROC at Max: 10.84%
50% Max: 3.08
ROC at 50% Max: 5.42%
Will generally look to take profit on the setup as a unit at 50% max, roll short call out at 50% max.
* -- Long Call Diagonal.
Nifty Trading Stratgey for Option PlayersNifty Trading Strategy for the Week Ahead 📝✅
Nifty has recovered strongly from the 22,700–22,800 zone up to around 23,350. Momentum on the 1H chart is still pointing upward (higher highs and higher lows since early March).
Max Pain: ⚠
The current Max Pain appears around 23,200–23,300.
Price (≈23,350) is slightly above Max Pain. Often, option sellers benefit if the index settles near the Max Pain level by expiry; however, in a strong uptrend, price can remain above it.
Open Interest (OI) & Change in OI:📊
Significant Put OI (and additions) around 23,200 and 23,000. This often implies a support zone.
Noticeable Call OI at or above 23,500, which could act as a short-term resistance if price approaches that region.
Put–Call Ratio (PCR): 📈📉
PCR is around 1.05–1.10, suggesting mildly bullish sentiment.
A PCR > 1 usually means more puts are being sold or more call positions are being closed, implying the market is not aggressively bearish. However, an extremely high PCR can also hint at an overbought market, so it’s good to be cautious.
2. Possible Strategy 🧠
Given the uptrend and the supportive OI near 23,200, a buy-on-dips approach looks reasonable. However, be mindful of the overhead call OI around 23,500.
Entry:💡
Buy (go long) near 23,300–23,280
Rationale: You’re buying close to the short-term support area (23,200–23,250) indicated by strong Put OI and near the Max Pain region.
Target: 🎯
First Target: 23,450–23,500
Rationale: This zone is just below the big Call OI cluster, which could be the first significant resistance. Lock in partial profits here if the market moves up quickly.
2nd Target (if momentum is strong): 23,600 🎯🎯
Only consider holding for a higher target if you see follow-through buying and a breach of 23,500 on good volumes.
Stop Loss: 🔴
Stop Loss: 23,200 (on a closing basis if you are trading intraday to multi-day)
Rationale: A break below 23,200 would indicate that sellers are gaining control and that the put-writers’ support is failing.

Gamma Exposure Analysis SPY & VXX SPY Resistance at 570. The 570 level in SPY likely corresponds to a high gamma concentration for 0DTE (zero days to expiration) options. At this strike, market makers short gamma (i.e., net sellers of options) at this level would dynamically delta-hedge by selling SPY as the price approaches 570, creating selling pressure and resistance. Next resistance level 575.
For VXX , the 48 level likely represents a put-dominated gamma zone: If market makers are net long puts, they would buy VXX as prices decline toward 48 to hedge against further downside, creating support. Next support level 46.50

Opening (IRA): XRT April 17th -71C/Sept 19th 50C LCD*... for a 17.91 debit.
Comments: At or near 52 week lows. Buying the back month 90 delta and selling the front month such that it pays for all the extrinsic in the long, with a resulting break even that is at or below where the underlying is currently trading. The Sept 19th 50C is shown at the 65 strike so that it appears on the chart.
Metrics:
Buying Power Effect: 17.91
Break Even: 67.91
Max Profit: 2.09
ROC at Max: 11.67%
50% Max: 1.05
ROC at 50% Max: 5.83%
Will generally look to take profit at 50% max, roll short call out and/or down and out at 50% max.
* -- Long call diagonal a/k/a a Poor Man's Covered Call.

Opening (IRA): IBIT March 28th 45 Covered Call... for a 43.91 debit.
Comments: Adding, but at lower delta and at strikes better than what I currently have on, selling the -84 delta call against shares to emulate the delta metrics of a 16 delta short put, but with the built-in defense of the short call.
Metrics:
Buying Power Effect/Break Even: 43.91
Max Profit: 1.09
ROC at Max: 2.48%
50% Max: .55
ROC at 50% Max: 1.24%

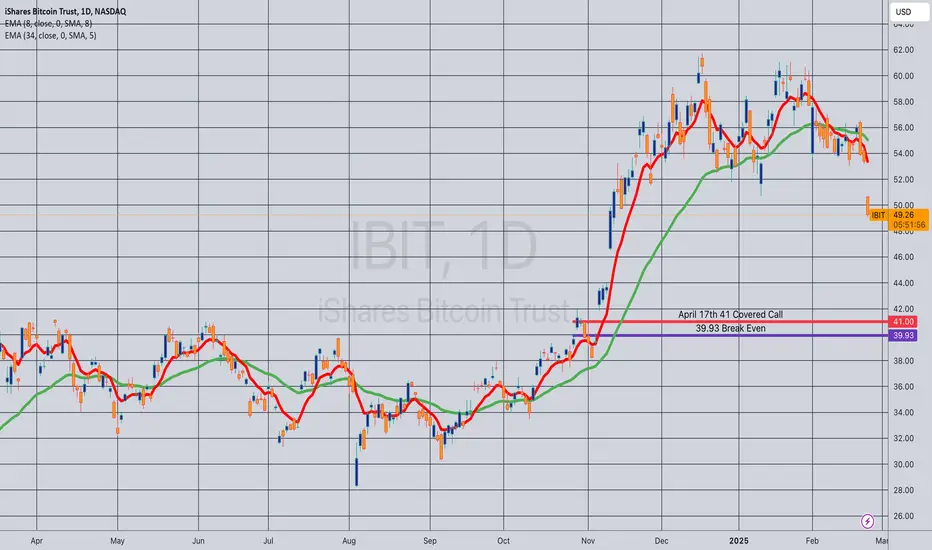
Opening (IRA): IBIT April 17th 41 Covered Call... for a 39.93 debit.
Comments: Adding to my position at strikes better than what I currently have on, selling the -84 delta call against shares to emulate the delta metrics of a 16 delta short put, but with the built-in defense of the short call.
Metrics:
Buying Power Effect/Break Even: 39.93/share
Max Profit: 1.07
ROC at Max: 2.68%
50% Max: .54
ROC at 50% Max: 1.34%
Will generally look to take profit, add at intervals assuming I can get in at strikes/break evens better than what I currently have on, and/or roll out short call if my take profit is not hit.
Bitcoin daily analysis based on IBIT Gamma ExposureIf IBIT surpasses the 48.00 level (which serves as a pivot), Bitcoin could rally toward the key 0DTE level at 50.50 (daily target)

Gamma Exposure on SPXToday marks the first day in a long time where we can observe some green, bullish levels on gamma exposure. The daily GexView indicator displays thin green lines, which represent the gamma exposure of zero-days-to-expire contracts. The thick lines, on the other hand, represent the total gamma exposure across all expiration contracts. This is a promising first step, especially if these lines persist over the next few days and continue to develop further.

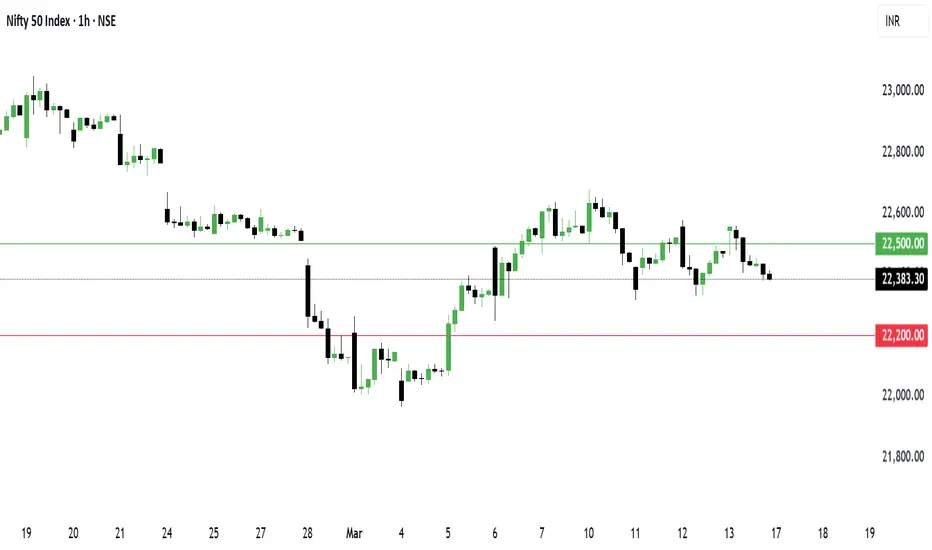
Nifty Data and Trading Strategy for 17 March 2018 NSE:NIFTY Analysis and Trading Strategy
Key Observations:
Nifty Spot Price: 22,397.20
Max Pain: 22,450This suggests that option writers will try to move the market towards this level by expiry.
PCR (Put-Call Ratio): 0.99PCR near 1.0 indicates a balanced market, with no extreme bullish or bearish bias.
A rise above 1.2 suggests bullishness, while a drop below 0.8 suggests bearishness.
OI (Open Interest) Data:Call OI Change: 430.58L (High call writing at resistance levels)
Put OI Change: 369.91L (Put writing suggests strong support)
Total Calls OI: 752.31L vs. Total Puts OI: 745.22L (Almost equal, indicating a neutral stance)
Support and Resistance Levels:
Immediate Resistance: 22,500 (Strong Call Writing)
Immediate Support: 22,300 (Strong Put Writing)
Next Resistance: 22,600
Next Support: 22,200
Trading Plan (March 17, 2025)
Scenario 1: Bullish Setup (Breakout Above 22,450)
Entry: Above 22,450 (Confirm breakout with volume)
Target 1: 22,500
Target 2: 22,600
Stop Loss: 22,350
Reason:If Nifty moves above max pain (22,450), bulls will gain momentum.
PCR indicates a balanced market, but a breakout with volume can trigger further upside.
Scenario 2: Bearish Setup (Breakdown Below 22,350)
Entry: Below 22,350 (Confirm breakdown with volume)
Target 1: 22,300
Target 2: 22,200
Stop Loss: 22,450
Reason:Call writing at 22,500 suggests strong resistance.
Breakdown below 22,350 may lead to further downside towards 22,300 and 22,200.
Final Strategy:
Bias: Neutral to Bullish (Watch for breakout above 22,450)
Intraday Plan:If Nifty opens flat → Wait for breakout/breakdown confirmation
If Nifty opens above 22,450 → Buy on dips
If Nifty opens below 22,350 → Sell on rise
NIO Options Ahead of EarningsIf you haven`t bought NIO before the previous earnings:
Now analyzing the options chain and the chart patterns of NIO prior to the earnings report this week,
I would consider purchasing the 6usd strike price Calls with
an expiration date of 2025-6-20,
for a premium of approximately $0.47.
If these options prove to be profitable prior to the earnings release, I would sell at least half of them.

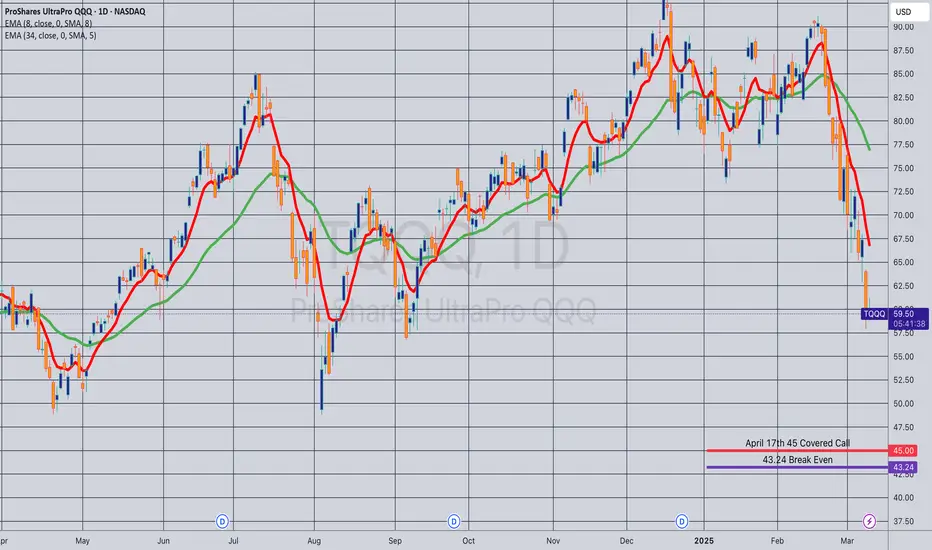
Opening (IRA): TQQQ April 17th 45 Covered Call... for a 43.24 debit.
Comments: Adding to my position at break evens better than what I currently have on, but going a little bit less aggressive net delta-wise, selling the -84 delta call against shares to emulate the delta metrics of a 2 x expected move short put, but with the built-in defense of the short call.
Metrics:
Buying Power Effect/Break Even: 43.24
Max Profit: 1.76
ROC at Max: 4.07%
50% Max: .88
ROC at 50% Max: 2.04%
Will generally look to take profit at 50% max, add at intervals if I can get in at break evens better than what I currently have on, and/or roll out short call if my take profit is not hit.
Opening (IRA): TNA April 17th 25 Covered Call... for a 23.63 debit.
Comments: Adding to my current position at strikes/break evens better than what I currently have on, selling the -75 delta call against shares to emulate the delta metrics of a 25 delta short put, but with the built-in defense of the short call.
Metrics:
Buying Power Effect/Break Even: 23.63
Max Profit: 1.37
ROC at Max: 5.80%
50% Max: .68
ROC at 50% Max: 2.90%
Will generally look to take profit at 50% max, add at intervals if I can get in at break evens better than what I currently have on, and/or roll out short call in the event my take profit isn't hit.

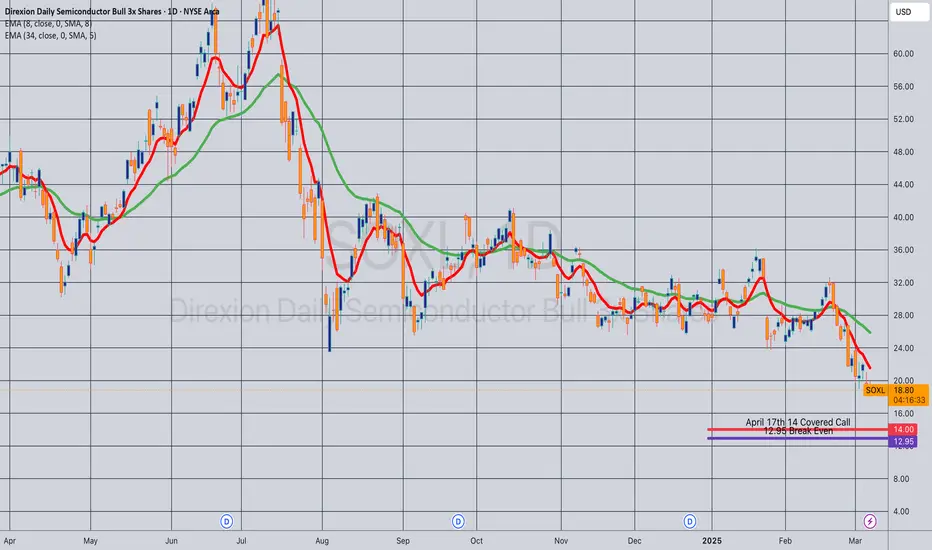
Opening (IRA): SOXL April 17th 14 Covered Call... for a 12.95 debit.
Comments: High IVR/IV. Adding at strikes better than what I currently have on, selling the -81 call against shares to emulate the delta metrics of a 19 delta short put, but with the built-in defense of the short calls.
Metrics:
Buying Power Effect/Break Even: 12.95/share
Max Profit: 1.05
ROC at Max: 8.11%
50% Max: .53
ROC at 50% Max: 4.06%
Will generally look to take profit at 50% max, add at intervals if I can get in at break evens better than what I currently have on, roll out short call if my take profit is not hit.
Nifty Faces Range-Bound Phase,brace for volatility till Mid ApriNifty ended the week at 22,397, marking a decline of about 150 points from the previous week's close. The index reached a high of 22,676 and a low of 22,314, trading in a narrow range of just 360 points. This suggests that next week, Nifty could experience a wider range, with potential moves between 22,850 and 21,950 .
Despite the weakness seen on both the monthly and weekly charts, Nifty remains range-bound as long as the critical support level of 21,950 holds. However, with the end of March approaching, many investors will likely start booking losses to offset any gains they’ve made this year. This could trigger another round of selling pressure in the market. As a result, we may not see a meaningful recovery until mid-April, meaning we could face one more month of market volatility and pessimism.
It's crucial to keep cash ready to invest in fundamentally strong stocks during this period of market uncertainty. On the global front, the S&P 500 closed the week at 5,521, slipping below its 50-week exponential moving average (50WEMA). It seems likely that the index will test the 100-week exponential moving average (100WEMA) at around 5,240–5,250, which is about 4% below its current level. If this happens, we could see additional pressure across global markets, including India.
In summary, brace yourself for another month of market negativity before any potential relief arrives. Stay cautious and focus on high-quality stocks for the long term.

GOLD → Strong consolidation. What’s Next?OANDA:XAUUSD is consolidating within the 2926 - 2890 range. The overall market remains bullish, but there are signs of short-selling or pre-news selling ahead of the major economic data release scheduled for Wednesday.
Accordingly, the market is eagerly awaiting U.S. inflation and employment data, which could play a crucial role in shaping the Federal Reserve’s next move. Despite a weaker dollar and rising expectations of monetary easing, Fed Chair Jerome Powell remains cautious, signaling a measured approach to policy adjustments.
Meanwhile, gold demand remains strongly supported by China as the country ramps up its purchases. Additionally, growing concerns over stagflation in the U.S. further strengthen gold’s appeal as a safe-haven asset. However, traders are keeping a close watch on upcoming economic reports and the potential impact of China's tariffs on U.S. goods, which could introduce further market volatility.
The key focus now is 2926, where price action is shaping a potential accumulation phase before a breakout. If price stabilizes above this resistance, it could trigger a significant bullish impulse, signaling a continuation of the uptrend.
However, a major challenge remains—if the price accelerates too quickly toward resistance, the risk of a false breakout increases. In such a scenario, the market may pull back to 2890 to test liquidity zones, ensuring structural confirmation before making a legitimate move back toward 2926 and beyond.
What are your thoughts on gold?
Best regards, Bentradegold!
