EURUSD: Attempting to change the trendHello dear friends, Ben here!
Currently, EURUSD is attempting to capture recovery due to the dollar's adjustment. The price is forming a reaction from the resistance channel consolidation before breaking out and growing further.
Accordingly, after breaking through the trend channel resistance level, the price has moved into a consolidation phase around the range of 1.053 to 1.021. Within this, the price is testing the resistance level of 1.038. From this, we can argue that the market is still working to change its trend and become stronger against the dollar's adjustment.
Resistance levels: 1.038, 1.053
Support levels: 1.033, 1.021
Emphasizing the resistance level of 1.038, with confirmation of consolidation above this level, there will be nothing stopping EURUSD from further growth.
Best regards, Bentradegold!
Optionsstrategies

GOLD → Consolidating around 2921 — Poised for a Breakout!OANDA:XAUUSD continues its upward trajectory amid rising economic risks and a weakening dollar. The metal is currently testing resistance at 2921 and appears poised for further gains.
The U.S. dollar has broken its bullish structure, driven by comments from the U.S. Treasury regarding potential rate cuts. This intervention has significantly influenced market sentiment. Theoretically, gold is unlikely to decline further due to trade war risks and expectations of a dovish Fed policy. Additionally, weak ADP employment data and PMI figures could provide further bullish momentum for gold.
Key levels to watch are 2913 and 2903, which have already been tested and tapped into liquidity zones. Now, all eyes are on 2927—if this level holds, gold could retreat back to the 2913-2903 support zone. However, a breakout above 2927 could fuel further upside, with the next targets at 2942-2956.
Share your thoughts, opinions, and questions—let's discuss what’s unfolding in the market!

GOLD → The calm before the NFP torm! What’s next?OANDA:XAUUSD is currently trading within the 2926 - 2894 range, signaling a pause after its recent strong uptrend. If a false support breakdown occurs, the market could quickly revert, especially amid signs of a recovering USD.
However, a weaker dollar and expectations of a Federal Reserve policy shift toward easing continue to support gold demand. Despite the temporary suspension of Trump’s tariff measures, the precious metal remains in focus as a safe-haven asset.
Traders are now closely watching the NFP report, which could dictate the dollar’s future trajectory and influence Fed policy decisions. In the short term, attention will be on Initial Jobless Claims data, which may provide early signals about the U.S. labor market.
Technical Outlook
-Gold remains within the 2926 - 2894 range, potentially testing liquidity near the 2894 support zone.
-An unfilled fair value gap (FVG) below 2894 could lead to a brief dip before a rebound.
-Given the bullish long-term trend in gold and the ongoing dollar weakness, the probability of a price recovery remains high.
In this scenario, gold may fake out a breakdown, grab liquidity near support, and then resume its broader uptrend.
Best regards, Bentradegold!

Nifty Outlook: Bulls vs Bears - Key Levels to Watch Next Week
Nifty closed at 22,552, up by around 330 points from last week's close, hitting a high of 22,633 and a low of 21,964. As anticipated last week, the index found support at the 100-day WEMA around the 22,000 level, triggering a bounce. Looking ahead, next week is crucial, as the market is at a crossroads. While the monthly and weekly timeframes continue to show bearish signals, the bulls are actively trying to take control and push the market higher.
Here’s what to watch for:
Key Resistance: If Nifty manages to stay above 22,800 next week, we could see a short-covering rally, driving the index towards the 23,000 to 23,050 range. However, beyond these levels, the bulls may face significant challenges in taking the market further up.
Critical Support: On the downside, 22,000 remains a major support level. A break below this level could signal a fresh downtrend, possibly leading the market towards 19,500.
Next week is expected to be volatile, given the short trading week due to the holiday on Friday. This could lead to profit-taking from long traders, which might put downward pressure on the market. Keep a close eye on this week's low of 21,964. If it breaks, the market may open up to sharp declines.
Meanwhile, the S&P 500 has found support at the 50-day WEMA and closed at 5,770. On the weekly timeframe, it looks like the S&P 500 is forming a W pattern, with potential upside towards 5,850-5,890 next week before any pullback. If the S&P rallies as expected, it could provide a boost to Indian markets as well.
Next week is set to be decisive. Will the bulls overcome the bearish pressure, or will the market succumb to further selling? Stay alert, as the battle between bulls and bears continues.

Gold purchase strategy continues to prioritize. Target 500 pips!Dear friends!
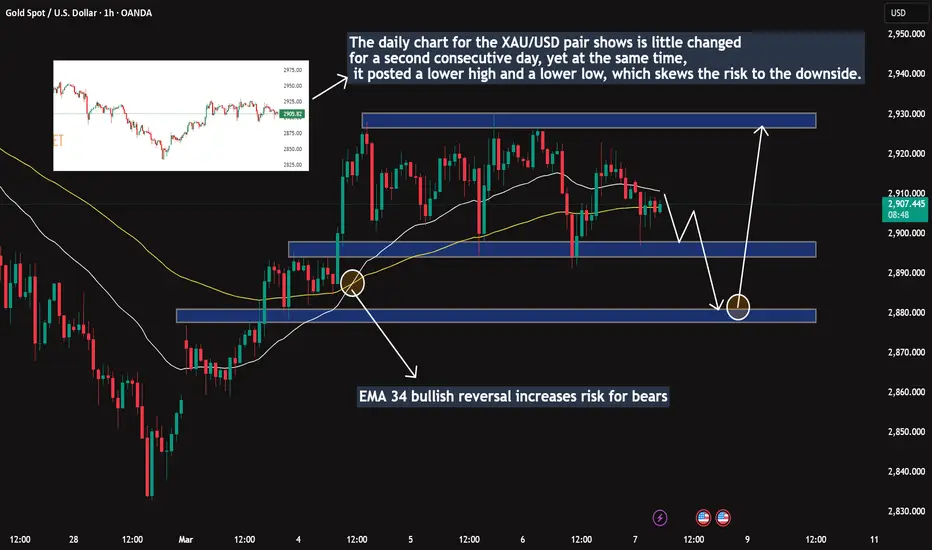
Gold continues to trade negatively for the second consecutive day, despite a combination of factors still acting as key drivers ahead of the crucial U.S. NFP report at the end of this Friday. Rising trade tensions continue to put pressure on investor sentiment.
As mentioned on the 1-hour chart, the daily chart for XAU/USD shows little change for the second consecutive day. However, at the same time, it also records lower highs and lower lows, shifting the risk bias to the downside. Nevertheless, the short-term picture indicates that buyers are struggling to maintain control, with the 34 EMA having reversed, increasing the risk for sellers. As a result, the downside potential remains limited, with dips likely to continue attracting buyers.
Key short-term levels to consider:
Support: 2,894 | 2,876
Resistance: 2,911 | 2,927
Gold price breakout – What’s Next?The XAU/USD 2-hour chart reveals an exciting breakout from the previous downtrend channel, signaling a potential trend reversal. The 34 EMA and 89 EMA continue to provide solid support, while buyers are holding firm within the consolidation zone.
Two Key Scenarios Ahead:
✅ Case 1: If gold breaks out of this consolidation box, we could see a strong bullish continuation toward $2,950 - $2,970, and possibly even higher.
⚠️ Case 2: However, if price fails to sustain above this range, a retracement to $2,880 - $2,850 is on the table.
With geopolitical tensions rising and economic uncertainty driving investors toward safe-haven assets, will gold break higher, or are we in for a deeper pullback?
📉📈 What’s your outlook on gold? Bullish or bearish? 🚀👇

LFWD Lifeward Options Ahead of EarningsAnalyzing the options chain and the chart patterns of LFWD Lifeward prior to the earnings report this week,
I would consider purchasing the 2.50usd strike price Calls with
an expiration date of 2025-7-18,
for a premium of approximately $0.50.
If these options prove to be profitable prior to the earnings release, I would sell at least half of them.

2022 Déjà Vu? Markets Stalling at a Critical Level2022 Déjà Vu? Markets Stalling at a Critical Level | SPX Market Analysis 05 Mar 2025
We expected roller-coaster swings this week, and the market hasn’t disappointed. The price action feels oddly familiar, reminiscent of early 2022, when a failed all-time high attempt led to a slow, choppy bear market.
Right now, the market is stuck at a key decision point—dithering at the lower range like it can’t decide whether to break down or bounce back up. ADD data leans slightly bullish, suggesting a possible range-bound chop with an upward bias, unless sellers take full control and push us into the February/March correction cycle.
No need to guess—I’m hedged and ready for either outcome. The only thing left to do? Wait for the market to tip its hand.
---
Deeper Dive Analysis:
The market is moving exactly as expected—lots of noise, little commitment, and price action that mirrors early 2022, just before the slow-motion bear market began.
📌 What’s Happening Right Now?
Markets failed to make new highs and are now chopping near the range lows
The last time we saw this structure? Early 2022 before a major shift downward
Price is hesitating, signalling traders are waiting for a catalyst
📌 Two Possible Outcomes:
1️⃣ A Range Reversal (Bullish Scenario)
ADD data suggests a short-term bullish bias
A grinding, sideways move with an upward tilt is likely
Ideal for small, quick trades—but no trend confirmation yet
2️⃣ The February-March Correction Cycle (Bearish Scenario)
If support fails, sellers could accelerate the move lower
Seasonal trends often bring a correction this time of year
Watching for signs of a decisive breakdown
📌 How I’m Approaching This Market:
✅ Staying hedged so that a move in either direction is fine
✅ Being patient—waiting for a strong move before committing capital
✅ Avoiding impulse trades—letting the market tell me what’s next
Traders who rush in too early this week could get chopped up in the indecision, while those who wait for a clear confirmation will be in the best position to capitalize.
---
Fun Fact
📢 Did you know? The biggest one-day percentage drop in history wasn’t 2008—it was Black Monday in 1987, when the Dow crashed 22.6% in a single day.
💡 The Lesson? Markets can collapse out of nowhere, but structured traders with hedges and a system don’t panic—they profit.

USDJPY: Consolidating below the uptrend channel!Dear Traders!
Recently, USDJPY has made a strong breakout, completely exiting the uptrend and stabilizing below a new support level, as highlighted on the 1-hour chart. The pair is currently trading around 149.20.
This stability above the new support is driven by U.S. President Donald Trump's tariff policies, which have boosted risk-off sentiment and increased demand for the U.S. Dollar as a safe-haven asset. However, expectations of a BoJ rate hike and concerns over a global trade war continue to support the Japanese Yen, keeping gains limited below the lower boundary of the previous uptrend channel.

GOLD → Breaks 2881. Buyers are ready…OANDA:XAUUSD breaking through the resistance threshold of the downward trend and attempting to seek gains above the critical resistance zone of 2881. A consolidation before the breakout is forming relative to 2894, signaling potential growth on the dollar's correction foundation.
Previously, Trump confirmed the possibility of imposing 25% tariffs on Canada, Mexico, and China, triggering retaliatory measures and increasing the risk of U.S. recession. Declining PMI and Atlanta Fed's GDP led to a sell-off on Wall Street and increased demand for gold as a protective asset.
Geopolitical tensions persist as Trump suspends military aid to Ukraine, sparking European discontent. Market focus will remain on the release of detailed U.S. monthly employment information - commonly known as the Non-Farm Payroll (NFP) report on Friday. This crucial data will impact both USD and gold metal.
Technically, the price surpassing the 2881 resistance level divides the market into two planes. A consolidation before breakthrough is forming relative to 2895. The resistance breakthrough and price consolidation above 2895 could reinforce growth. The buyers' main focus is maintaining defensive positions above 2885 - 2895.
In the context of increasing economic risks and declining dollar, gold has every opportunity to continue its growth following the local trend change. The targets in this scenario are 2915, 2921, 2929.
Best regards, Bentradegold!

Gold price today: Extend the momentum!Gold prices continued their upward momentum today, hovering around the $2,910 level. The last recorded trade for gold stood at $2,928 per ounce, marking a 270-pip increase compared to early yesterday morning.
Accordingly, gold prices are currently experiencing strong impacts from USD fluctuations and US tariff policies. Meanwhile, President Donald Trump continues to raise concerns by threatening to impose tariffs on imports from Mexico and Canada. These factors could determine whether gold can reach the $3,000 per ounce mark or not.
Currently, investors are awaiting the US payroll report, expected to be released at the end of this week. The report's results could influence the monetary policy of the Federal Reserve (FED).
On the technical chart, the precious metal has broken out of the descending price channel and made adjustments to create new highs. Bullish factors are driven by the crucial support level at 2885 and the two EMA lines at 34 and 89. All expectations are focused on gold's long-term price appreciation because any signs of US economic slowdown will support calls for Fed rate cuts and provide support for OANDA:XAUUSD .

Gold price today: Strong rebound!Dear traders!
At around 6 AM on March 4, the spot gold price stood at $2,894 per ounce, marking a $36 increase from the previous day's opening price of $2,858 per ounce.
The primary reason for this rise is the increased risk aversion among investors, driving higher demand for safe-haven assets like gold amid escalating geopolitical tensions. Over the weekend, a heated exchange between U.S. President Donald Trump and Ukrainian President Volodymyr Zelensky raised concerns that efforts to end the Ukraine-Russia military conflict could reach an impasse.
Additionally, U.S. trade tariffs on Mexico, Canada, and China take effect today, March 4, sparking fears of potential financial market instability. This uncertainty has pushed many investors toward gold as a wealth preservation asset.
Meanwhile, a sudden decline in the U.S. dollar has made gold more attractive to investors holding other currencies. As a result, today's gold price outlook remains positive. Keep an eye on the $2,892 resistance level, as a breakout above this point could signal further upside momentum.
What are your thoughts?

[03/03] SPY GEX Analysis (Until Friday Expiration)Overall Sentiment:
Currently, there’s a positive GEX sentiment, suggesting an optimistic start to the week following Friday’s bounce. However, the key Call resistance appears at 600, and it may not break on the first attempt. If optimism remains strong, there’s a chance SPY 0.09%↑ could still push above that zone after some initial back-and-forth.
🟢Upside Levels:
600–605 Zone: This is a major resistance area. Should SPY move decisively through 600/605, the next potential target could be 610.
610: This is currently the largest positive GEX zone for the week. Current option pricing suggests only about a 9% chance of closing at or above 610 by Friday, so it might require a particularly strong move to break through.
🔵 Transition Zone: Roughly 592–599. The gamma flip level is near 592, and staying above that keeps the market in a positive gamma range for now.
🔴 Downside Risk:
If 592 Fails (or HVL climbing up during the week, and after that HVL fails…): A drop could accelerate toward 585, which may act as the first take-profit zone for bears. Below that, 580 could be in play if selling intensifies.
Lower Support: 575 is the last strong support mentioned, but current option probabilities suggest about an 88% chance of finishing above that level, making a move below 575 less likely—though still possible given the higher put skew.
🟣Volatility & Skew:
IVR (Implied Volatility Rank) is quite high on SPY, with a notable put pricing skew (around 173.1%).
This heightened put skew indicates the market is pricing in faster, more volatile downward moves compared to upside.

Time to Prepare | $SPY Options Bull & Bear Week 1 March 2025AMEX:SPY
Last week's AMEX:SPY $595 Put 3/10 ran for 66% from $480 up to $1,420.
The last two weeks, the market has suffered a controlled pullback. So far it has been cautious selling rather than outright panic. While fear has entered the market, it has yet to reach capitulation, where there would be significantly more potential downside. The key level to watch long-term is the 200SMA on the daily chart, currently at $568.45. This level, which hasn't been tested in 16 months, could signal a Stage 4 selloff, a more aggressive and potentially prolonged downward trend.
Here are this week's AMEX:SPY Options:
(15-30 minute candle closes for confirmation and stop-loss)
📜 $580 PUT 3/17
Entry: Breakdown and failed retest of $584.50
Target 🎯 : $580, $574, $571
📜 $590 CALL 3/17
Confirmed breakout over $584.50
Target 🎯 : $590, $591.50, $594

EUR/USD: Bearish reversal signal!EUR/USD is showing signs of a bearish reversal around 1.04900, completing a Harmonic pattern.
Strategy:
Sell below 1.04800
Stop loss: 1.05039
Take profit: 1.04240
Wait for bearish confirmation before entering!

Opening (IRA): PLTR February 21st 62/68/94/100 Iron Condor... for a 2.16 credit.
Comments: High IVR/IV earnings announcement volatility contraction play.
Metrics:
Max Profit: 2.16
Buying Power Effect: 3.84
ROC at Max: 56.3%
50% Max: 1.08
ROC at 50% Max: 28.2%

Options Blueprint Series [Intermediate]: Optimal Options StrikesI. Introduction
Options on futures offer traders a flexible way to participate in market movements while managing risk effectively. The Japanese Yen Futures (6J) market provides deep liquidity, making it a preferred instrument for options traders. In this article, we will explore how to optimize Bull Call Spreads in Yen Futures (6J) by understanding price equivalency and strike selection.
One of the most critical aspects of trading options on futures is recognizing that continuous futures charts and contract-specific charts display different prices. This discrepancy must be accounted for when setting up trade entries and exits. Additionally, strike price selection significantly impacts the reward-to-risk ratio, breakeven price, and probability of profitability.
By identifying key support and resistance levels (UFO), we will define trade setups that likely align with market structure, targeting precise entry and exit points. We will also compare different Bull Call Spread variations to understand how adjusting the strike selection impacts risk and potential reward.
II. Understanding the Japanese Yen Futures Contract
Before diving into the options strategy, it is essential to understand the specifications of the CME-traded Japanese Yen Futures (6J) contract:
Contract Size: Each futures contract represents 12,500,000 Japanese Yen
Tick Size: 0.0000005 USD per JPY (equivalent to $6.25 per tick)
Trading Hours: Nearly 24-hour trading cycle with short maintenance breaks
Margin Requirements: Currently $2,900 (varies through time).
For this article, we focus on December 2025 Yen Futures (6JZ2025). Since the market price displayed on continuous charts (6J1!) differs from contract-specific charts, we need to establish price equivalencies to align our trade analysis.
III. Price Equivalency Between Continuous and Contract-Specific Futures
Futures traders commonly use continuous charts (such as 6J1!) for analysis, but when trading options, it is crucial to reference the specific futures contract month (such as 6JZ2025). Due to roll adjustments and term structure variations, prices differ between these two charts.
In this setup, we identify key UFO-based support and resistance levels and adjust for contract-specific price equivalency:
Support Level Equivalency: 0.0066325 (6J1!) = 0.0068220 (6JZ2025)
Resistance Level Equivalency: 0.0069875 (6J1!) = 0.0072250 (6JZ2025)
These adjusted price levels ensure that the trade is structured accurately within the December 2025 contract, aligning option strikes with meaningful technical levels.
IV. The Bull Call Spread Strategy on Yen Futures
A Bull Call Spread is a vertical options spread strategy used to express a bullish outlook while reducing cost and limiting risk. This strategy involves:
Buying a lower-strike call (gaining upside exposure)
Selling a higher-strike call (reducing cost in exchange for capping maximum profit)
This setup provides a defined risk-reward structure and is particularly useful when targeting predefined resistance levels. Given that we identified 0.0068220 as support and 0.0072250 as resistance, we will structure multiple Bull Call Spreads to compare strike selection impact.
Now that the trade structure is established, let’s explore how different strike selections affect risk, reward, and breakeven prices.
V. Strike Selection and Its Impact on Risk-Reward Ratios
Selecting the appropriate strike prices is crucial when structuring a Bull Call Spread, as it directly affects the breakeven price, maximum risk, and maximum reward. To illustrate this, we compare three different Bull Call Spread variations using December 2025 Yen Futures (6JZ2025).
1. 0.00680/0.00720 Bull Call Spread
Breakeven: 0.006930
Maximum Risk: -0.00013
Maximum Reward: +0.00027
2. 0.00680/0.00750 Bull Call Spread
Breakeven: 0.0069789
Maximum Risk: -0.00018
Maximum Reward: +0.00052
3. 0.00680/0.00700 Bull Call Spread
Breakeven: 0.006879
Maximum Risk: -0.00008
Maximum Reward: +0.00012
Observing these variations, key insights emerge. The 0.00680/0.00750 spread offers the highest potential reward but comes with the highest breakeven and greater risk. Meanwhile, the 0.00680/0.00700 spread minimizes risk but provides a lower profit potential. Strike selection, therefore, becomes a balance between profitability potential and probability of success.
A wider spread (such as 0.00680/0.00750) has a higher reward-to-risk ratio, but it requires the price to move further before generating profits. Conversely, a narrower spread (like 0.00680/0.00700) has a lower breakeven price, increasing the probability of profitability but limiting potential upside.
VI. Trade Plan for a Bull Call Spread
Based on the analysis of strike selection, a balanced trade plan can be structured using the 0.00680/0.00720 Bull Call Spread, which offers a favorable reward-to-risk ratio while maintaining a reasonable breakeven price.
Market Bias: Bullish, expecting a move toward resistance
Selected Strikes: Long 0.00680 call, short 0.00720 call
Breakeven Price: 0.006930
Target Exit Price: 0.0072250
Maximum Risk: -0.00013
Maximum Reward: +0.00027
Reward-to-Risk Ratio: 2.08:1
This setup capitalizes on the previously identified UFO support to define the entry point, while the UFO resistance provides a target for exit. The breakeven price remains at a reasonable level, ensuring a greater probability of the spread moving into profitability.
VII. Risk Management Considerations
While the Bull Call Spread limits risk compared to outright long calls, proper risk management is still necessary. Traders should consider the following:
Using Stop-Loss Orders: If price breaks below the UFO support level at 0.0068220, traders may exit the position early to avoid excessive losses.
Hedging with Puts: If volatility spikes or market sentiment shifts, a put option or put spread can serve as a hedge against adverse movements.
Position Sizing: Adjusting contract size ensures that total exposure remains within acceptable risk limits based on account size.
Time Decay Considerations: Since time decay negatively impacts long call options, traders should monitor the spread's profitability as expiration approaches and adjust positions accordingly.
By implementing these risk management techniques, traders can optimize their Bull Call Spread strategy while mitigating unnecessary exposure.
When charting futures, the data provided could be delayed. Traders working with the ticker symbols discussed in this idea may prefer to use CME Group real-time data plan on TradingView: www.tradingview.com - This consideration is particularly important for shorter-term traders, whereas it may be less critical for those focused on longer-term trading strategies.
General Disclaimer:
The trade ideas presented herein are solely for illustrative purposes forming a part of a case study intended to demonstrate key principles in risk management within the context of the specific market scenarios discussed. These ideas are not to be interpreted as investment recommendations or financial advice. They do not endorse or promote any specific trading strategies, financial products, or services. The information provided is based on data believed to be reliable; however, its accuracy or completeness cannot be guaranteed. Trading in financial markets involves risks, including the potential loss of principal. Each individual should conduct their own research and consult with professional financial advisors before making any investment decisions. The author or publisher of this content bears no responsibility for any actions taken based on the information provided or for any resultant financial or other losses.

Update gold today!Dear traders!
During the Asian session on Monday, gold is attracting some buyers, aiming for the $2,900 level. Geopolitical uncertainty surrounding the Russia-Ukraine conflict continues to support the precious metal while putting pressure on the US dollar, further aiding gold’s short-term recovery.
However, from a technical perspective, gold remains below the EMA 34 and EMA 89, indicating that the bearish trend is still in control. The key resistance zone at $2,892 - $2,895 could be a crucial area where sellers re-enter the market. If gold fails to break above this level, we may see a renewed downward move, reinforcing the dominance of the bears.

EURUSD: The downtrend remains intact!Dear traders!
Currently, EURUSD is pausing its three-day losing streak, trading around 1.0417 during the Asian session on Monday. The pair's recovery is driven by a weaker US dollar, following the release of the January Personal Consumption Expenditures (PCE) inflation data on Friday, which aligned with forecasts and eased concerns over an unexpected inflation spike in the US.
However, the upside remains challenging, as the downtrend channel is still intact, and there are no significant reversal signals from the EMA 34 and 89. If the resistance levels within the channel hold firmly under bearish pressure, the downward trajectory is expected to persist, potentially pushing EURUSD towards 1.0363 (gap-filling level) and even lower, towards the lower boundary of the trend channel, as indicated on the chart.

Gold price today: The decline continues!Dear traders! What do you think about OANDA:XAUUSD – Buy or Sell?
Yesterday, gold continued its downward trend, dropping $27 from its highest point in the previous session at $2,885 per ounce. On March 1, gold closed the week negatively at $2,858 per ounce.
The main reason for this sharp decline in gold prices was the strengthening US dollar. The USD Index surged to 107.66, its highest level in the past 10 days, as financial markets grew concerned over the US administration's aggressive trade policies.
Specifically, former President Donald Trump confirmed a 25% tariff on imports from Mexico and Canada, effective March 4. Additionally, he announced an extra 10% tariff on Chinese goods. This policy has fueled uncertainty in the market, pushing investors toward the USD as a safe-haven asset, which has negatively impacted gold.

#nifty50 Bhalu bhaiya maan jaao :)Nifty ended the week at 22,124, down 670 points from the previous week's close, with a high of 22,668 and a low of 22,104. As I highlighted last week, the formation of a gravestone doji was a bearish signal, indicating the market was under the influence of selling pressure—and we’ve now witnessed the impact of that pattern. Currently, Nifty is testing the critical support at the WEMA100 level, which could trigger a bounce. However, any rally should be seen as an opportunity to enter fresh short positions.
As mentioned last week, if Nifty closed below the 22,400 level on the monthly chart, we were likely to see further correction, and that’s exactly what transpired. While it may sound negative, I anticipate the index heading toward the 19,500 mark . For long-term investors, there’s no need for concern. This pullback could offer a prime opportunity to buy fundamentally strong stocks at attractive prices. Traders, on the other hand, should focus on a “sell on rise” strategy instead of attempting to pick a bottom and risking substantial losses.
Turning to the S&P 500, as I pointed out last week, the bearish M-pattern was in play. From the recent high of 6043, we’ve seen a 3.5% correction. On the weekly chart, the index has formed a long-legged candle, signaling that demand is emerging from lower levels. For the past four months, the S&P 500 has struggled to break through the significant resistance at 6000, failing to close above it on a monthly basis. A decisive monthly close above 6000 could open the door for the index to reach higher levels, potentially targeting 6225, 6376, 6454, and 6568.
In conclusion, the market remains under pressure, with Nifty at a key support level and the S&P 500 facing resistance. Investors should remain focused on long-term opportunities, while traders should be cautious and adopt a disciplined approach to navigating the current market volatility. Stay strategic, stay patient, and let the market unfold.

Gold price update: Sharp decline from all-time high!Dear friends!
Global gold prices have fallen to their lowest level in over a week, driven by the strengthening U.S. dollar. Investors are closely watching key inflation data, which could provide important clues about the Federal Reserve’s monetary policy. Meanwhile, the U.S. dollar has risen by 0.2%, pushing the USD Index (.DXY) further away from its 11-week low. This appreciation makes gold more expensive for investors holding other currencies.
On the other hand, U.S. President Donald Trump has raised hopes of a one-month delay in imposing higher tariffs on imports from Mexico and Canada, while also proposing a 25% tariff on European automobiles and goods. This uncertainty has driven investors toward the U.S. dollar, adding further pressure on gold prices, which were already facing profit-taking pressure after reaching record highs.

EURUSD: Bearish Wave Continues to Dominate!EURUSD continued its downward trajectory on Thursday, losing nearly 0.9% and slipping below the key 1.0400 support level for the first time in nearly two weeks. The decline was driven by strong USD buying pressure across the market.
The U.S. Dollar Index (DXY) reclaimed the 107.00 level, reaching a fresh six-day high, supported by a modest uptick in both U.S. and German bond yields. The dollar’s strength reflects ongoing concerns over U.S. tariffs and fresh doubts about the health of the U.S. economy, following weaker-than-expected economic data in recent days. These factors have weighed heavily on EURUSD.
From a technical perspective, the pair has broken below an ascending trendline, confirming a shift in momentum towards the downside. This reinforces the bearish outlook, as no clear bottom formation has been established yet. If EURUSD stages a recovery, it is likely to encounter resistance near the confluence zone of the EMA 34, EMA 89, and the newly formed resistance area, which could trigger renewed selling pressure. For now, the bearish bias remains intact, with further downside potential unless a decisive recovery above the resistance zone materializes.
