USDJPY: Correction before dropping to 153.00-152.00Hello everyone, Ben here!
USDJPY has yet to resume its upward trend. Rumors about potential actions from the Bank of Japan (BoJ) are beginning to surface. Meanwhile, the US dollar continues to gain strength.
The 158.46 level represents a strong resistance zone established by the sellers. Strong expectations for an additional interest rate hike by the BoJ this week are also lending support to the JPY. Overall, this influence appears relatively weak but could still provide significant backing for this currency pair.
In theory, any upward movement of this major pair might be limited due to trade policy risks from the soon-to-be-inaugurated US President Donald Trump, which have constrained any significant bullish moves for the safe-haven JPY.
The focus this week will be on Trump’s inauguration speech on Monday and the highly anticipated two-day BoJ policy meeting beginning on Thursday.
From a technical standpoint, the price is attempting to break out of a major range and test key support levels. A false breakout around the 156.56 level could lead to the price targeting newly formed resistance zones. However, if the price settles below 156.56 or even drops under 155.95, it could trigger strong selling pressure sooner than expected.
Best regards, Bentradegold!
Optionsstrategies

Trading the VIX - A Balanced Strategy for Smart InvestorsWarning:
This strategy is presented as a trading idea and should not be considered guaranteed trading guidance. Traders are responsible for their own decisions and should carefully evaluate risks before executing any trades.
Given that VIX is generally between 13 and 20, I designed this option strategy.
Combination VIX Vertical Spreads
Strategy Overview:
Days to Expiry (DTE): 37
Option Positions:
Buy VIX 13 Call
Sell VIX 15 Put
Sell VIX 20 Call × 2
Visualized Setup
Strategy Summary:
This strategy results in a combination resembling a modified short straddle centered at VIX 20. However, in structure, it is better understood as a short strangle (neutral) combined with a bull call spread (bullish). The bullish component of the spread suggests that the trader expects the VIX to rise above 13 but remain below 20. The inclusion of a short strangle component helps offset the premium of the debit call spread.
This structured approach allows for a calculated risk-reward balance, aligning with the trader’s outlook on implied volatility while leveraging option spreads to optimize capital efficiency.
Risk and Reward Assessment:
The strategy is heavily weighted towards a long VIX bias, meaning the trader anticipates an increase in VIX, though at a measured pace within a month.
There is a slight increase in risk to the short side of VIX due to the exposure created by the short options.
The expected profit range suggests that VIX volatility will stay within a defined range of 14 to 24. While the trader acknowledges the possibility of VIX exceeding 20, it is not expected to surpass 24.
The probability of profit at expiry is estimated at 65% if entered today. Despite the additional short-side risk, the overall risk remains comparable to a standard short strangle.
Historical VIX data indicates that the index fluctuates between 12 and 40 on a monthly basis, with a 52-week high of 65.7 and a 52-week low of 10.6. This reinforces the strategy’s inherent higher risk to the long VIX side.
Key Considerations for Execution:
Event Risk: Confirm that no major events (e.g., geopolitical instability, Federal Reserve announcements) are expected that could push VIX above 30.
Entry Timing: Optimal entry is when VIX is at a relatively low level, such as observed last Friday (2/7/2025) morning.
Exit Strategy: The position should be closed in approximately two to three weeks or when profit exceeds 100%.
Notes and Alternative Strategy:
One challenge of this strategy is the uncertainty in determining a precise stop-loss strategy. However, given the nature of a strangle, there is no immediate need to exit within the first 20 days, making it a relatively "lazy" management strategy. The trader has ample time to adjust after the initial 20-day period.
Management should be approached by treating the bull call spread and short strangle separately. Given the natural variance of VIX, this approach should not be overly difficult to execute.
A suggested alternative strategy might provide more controlled risk exposure. For example, I would start the trade with a butterfly at 20 if I see the potential rise of VIX. Then, I would reassess it after 30 days (assuming DTE=37; a shorter DTE may also be considered). Alternatively, I could simply wait until expiration day to make a final decision. This strategy has a limited loss while maintaining a similar profit potential.
The suggested strategy manages the cost-efficiency aspect while also limiting potential losses. The decision-making process can then be based on market direction after the expected conditions begin to form.
In comparison to the original strategy in terms of profit and exit timing, the proposed strategy may offer a faster exit, whereas a butterfly setup may require waiting until expiration. However, traders may find early exits possible for condors or strangles.
Here is a visualization of the alternative setup:
Alternative Strategy Visualization
Thank you for reading. Wish you a successful options trading!

Nifty50 Trade Setup – February ExpiryAnalyzing the 7th Feb settlement prices using my proprietary OptionSigma model, a key level emerges: 23,698.80.
📌 Bullish Scenario: A clean breakout above 23,698.80 signals strength—potential long opportunities in Nifty February Futures or Monthly Call options.
📌 Bearish Scenario: Failure to breach this level? Shorting is the only play—either via futures or buying put options.
⚡ Stay sharp. Watch the price action around this level for confirmation!
#Nifty50 #OptionsTrading #IndexTrading #OptionSigma #FNO #TradingStrategy

[02/03] TSLA GEX Outlook for February expiration📌 Key Levels & GEX Insights
Gamma Flip Zone: ~400 (until Febr expiration)
Tight Transition Zone, Wide Clear Movement Range
Above 420 Call Resistance : Every strike has positive Net GEX, meaning a return to this range would likely support further balanced upside or sideways movement.
Below 375 : The next PUT support is at 350, so a break below this level could open the door for a deeper drop.
There are 3 weeks until expiration. IV and IVR remain high even after earnings.
Despite today’s selloff, the high call pricing skew is still attractive if we want to collect credit.
In this case, a call butterfly or broken-wing call butterfly could be worth considering—but strictly based on GEX levels.
PS: FINAL GEX ZONE COLORING SHEET

Opening (IRA): TSLA March 21st 330/335/465/470 IC*... for a 1.70 credit.
Comments: Post-earnings, IV remains fairly decent here at 57.3. Selling the -20 delta short option legs and buying the wings out from there. Basically, just doing small stuff while I wait for other stuff to play out.
Metrics:
Max Profit: 1.70
Buying Power Effect: 3.30
ROC at Max: 51.2%
50% Max: .85
ROC at 50% Max: 25.8%
Delta/Theta: .95/2.24
Will generally look to take profit at 50% max, consider doing a delta adjustment when the delta/theta ratio skews out to >2.0.
* -- Iron Condor.

GOLD → Testing Key Resistance with Potential to Reach 2726-2790OANDA:XAUUSD currently testing an important resistance level from which we can expect the price to continue rising to key levels such as 2726-2790. Technically, gold has entered the buying zone and the fundamental context supports it.
Gold is supported by weak US inflation data, moderate Fed expectations, hopes for Chinese stimulus measures, and fading concerns about President-elect Trump's disruptive trade tariffs which have supported the risk-on sentiment prevailing in markets, causing the US dollar to decline sharply.
Focus shifts to other economic data releases from the US, including December Retail Sales and Weekly Unemployment Claims, which will provide more clarity on the Fed's interest rate trajectory after January. Markets have fully priced in a rate pause at the Fed's policy meeting later this month. Gold prices will also remain dependent on any speculation surrounding Trump's tariff plans.
Technically, all eyes are now on the resistance zone at 2697-2700. If gold can consolidate above this area, buyers will quickly enter the medium and long-term playing field. But don't forget about the upcoming news releases.
Best regards, Bentradegold!

GOLD → False or true resistance breakout?OANDA:XAUUSD is trying to consolidate above the previously broken boundary of the ascending channel. The struggle that has not ended creates risks for both buyers and sellers.
The weakening USD, coupled with the lack of clarity surrounding President Donald Trump's policy plans and ongoing trade wars, continues to provide support for gold.
Inflation expectations are rising amid a period of economic and geopolitical uncertainty, forcing the Federal Reserve (Fed) to maintain high interest rates for an extended period to control increasing price pressures. Since taking office, President Trump has provided little detail on his proposed tariffs, raising questions about the seriousness of these measures and their potential impact.
In the coming days and weeks, the precious metals market will be influenced by constantly shifting news from Washington.
Resistance levels: 2758, 2770
Support levels: 2750, 2745, 2730
Currently, prices are consolidating above previously broken resistance levels. If there is no bullish momentum and the price breaks through a false resistance channel, gold may decline toward 2745 - 2730.
However, a breakout above the local resistance level could trigger buying and push the price to the target: 2770.
Best regards, Bentradegold!

Opening (IRA): TNA March 21st 40 Covered Call... for a 38.17 debit.
Comments: High IV; starter position. Going out to the 56 DTE March monthly for my starter position, selling the -75 delta call against shares to emulate the delta metrics of a 25 delta short put, but with the built-in defense of the short call.
Metrics:
Buying Power Effect/Break Even: 38.17/share
Max Profit: 1.83
ROC at Max: 4.79%
50% Max: .92
ROC at 50% Max: 2.40%
Will generally look to take profit at 50% max, add at intervals, assuming I can get in at strikes better than what I currently have on, and/or roll out the short call if the take profit has not been hit.

Opening (IRA): SMH February 21st 195/220/270/295 Iron Condor... for a 3.91 credit.
Comments: Back into the semiconductor ETF, where I don't have a position on currently. Going comparatively low delta, with the short options camped out at the 17 delta on both sides and the wings about 1/10th the price of the underlying in width.
Metrics:
Max Profit: 3.91
Buying Power Effect: 21.09
ROC at Max: 18.54%
50% Max: 1.96
ROC at 50% Max: 9.27%
Will generally look to take profit at 50% max, roll untested side in toward current price on side test.

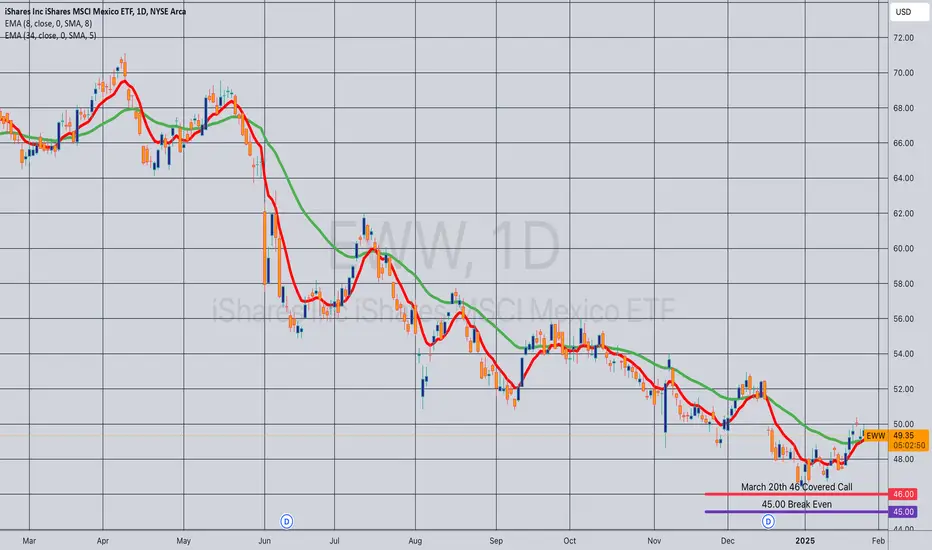
Opening (IRA): EWW March 21st 46 Covered Call... for a 45.00 debit.
Comments: Taking a small (ish) directional shot in the Mexico exchange-traded fund, selling the -75 delta call against shares to emulate the delta metrics of a 25 delta short put, but with the built-in defense of the short call.
Metrics:
Buying Power Effect/Break Even: 45.00/share
Max Profit: 1.00
ROC at Max: 2.22%
50% Max: .50
ROC at 50% Max: 1.11%
Will generally look to take profit at 50% max, add at intervals, and/or roll out the short call if my take profit isn't hit.
Opening (IRA): TQQQ March 21st 72 Covered Call... for a 68.95 debit.
Comments: Starter position on weakness. Selling the -75 delta call against shares to emulate the delta metrics of a 25 delta short put, but with the built-in defense of the short call.
Metrics:
Buying Power Effect/Break Even: 68.95
Max Profit: 3.05
ROC at Max: 4.42%
50% Max: 1.53
ROC at 50% Max: 2.21%
Will generally look to take profit at 50% max, add at intervals, assuming I can get in at strikes/break evens that what I have on at the time, and/or roll out short call if my take profit is not hit.

Opening (IRA): FCX July 18th 25/March 21st 39 Long Call Diagonal... for an 11.02 debit.
Comments: Taking a directional shot post-earnings on weakness, buying the back month 90 delta call and selling the front month 30 delta that pays for all of the extrinsic in the long, resulting in a break even that is slightly below where the underlying is currently trading.
Metrics:
Buying Power Effect: 11.02
Break Even: 36.02/share
Max Profit: 2.98
ROC at Max: 27.04%
With these, I generally look to take profit at 110% of what I put them on for and/or look to roll out the short call to reduce my cost basis/downside break even should that not be hit.

Opening (IRA): TNA March 21st 39 Covered Call... for a 37.05 debit.
Comments: Adding to my TNA position at a slightly better break even than what I currently have on, selling the -75 delta call against shares to emulate the delta metrics of a 25 delta short put, but with the built-in defense of the short call.
Metrics:
Buying Power Effect/Break Even: 37.05/share
Max Profit: 1.95
ROC at Max: 5.26%
50% Max: .98
ROC at 50% Max: 2.63%
Will generally look to take profit at 50% max, add at intervals, assuming I can get in at strikes better than what I currently have on, and/or roll out the short call if my take profit is not hit.

Opening (IRA): XBI March 21st 86 Covered Call... for an 84.20 debit.
Comments: Adding to my position at strikes better than what I currently have on, selling the -75 delta call against shares to emulate the delta metrics of a 25 delta short put, but with the built-in defense of the short call.
Metrics:
Buying Power Effect/Break Even: 84.20
Max Profit: 1.80
ROC at Max: 2.14%
50% Max: .90
ROC at 50% Max: 1.07%
Will generally look to take profit at 50% max, add at intervals, assuming I can get in at strikes better than what I currently have on, and/or roll out the short call if my take profit isn't hit.

Opening (IRA): MU March 21st 75 Covered Call... for a 72.85 debit.
Comments: Looking to do something small here on weakness: Selling the -80 call against shares to emulate the delta metrics of a 20 delta short put, but with the built-in defense of the short call. Earnings are on 3/19, so will look to be out by then.
Metrics:
Buying Power Effect/Break Even: 72.85
Max Profit: 2.15
ROC at Max: 2.95%
50% Max: 1.08
ROC at 50% Max: 1.48%

Opening (IRA): TMF March 21st 36 Covered Call... for a 34.85 debit.
Comments: Starter position. Selling the -75 delta call against shares to emulate the delta metrics of a 25 delta short put, but with the built-in defense of the short call.
Metrics:
Buying Power Effect/Break Even: 34.85
Max Profit: 1.15
ROC at Max: 3.30%
50% Max: .58
ROC at 50% Max: 1.65%
Will generally look to take profit at 50% max, add at intervals, assuming I can get in at strikes/break evens better than what I currently have on, and/or roll out the short call if my take profit is not hit.

Opening (IRA): AMD Feb 21st 100/105/126/131 Iron Condor.. for a 2.01 credit.
Comments: Earnings announcement (2/4) volatility contraction play.
Metrics:
Max Profit: 2.01
Buying Power Effect: 2.99
ROC at Max: 67.22%
50% Max: .52
ROC at 50% Max: 33.61%

Opening (IRA): IBIT March 21st 48 Covered Call... for a 46.14 debit.
Comments: Adding to my current position at strikes better than what I have on, selling the -75 delta call against shares to emulate the delta metrics of a 25 delta short put, but with built-in short call defense.
Metrics:
Buying Power Effect/Break Even: 46.14
Max Profit: 1.86
ROC at Max: 4.03%
50% Max: .93
ROC at 50% Max: 2.02%
Will generally look to take profit at 50% max, add at intervals assuming I can get in at strikes better than what I currently have on, and/or roll out short call if my TP is not hit.

Opening (IRA): PLTR Feb 28th 70/75/100/105 Iron Condor... for a 2.11 credit.
Comments: High IVR/IV at 89.1/81.3. Adding to my PLTR position as an earnings announcement volatility contraction play.
Metrics:
Max Profit: 2.11
Buying Power Effect: 2.89
ROC at Max: 73.01%
50% Max: 1.06
ROC at 50% Max: 36.51%
Will generally look to take profit at 50% max, immediately roll out to March if a side is tested.

Opening (IRA): INDA March 21st -52C/June 20th 2 x 45C/-50C... covered zebra for a 9.93 debit.
Comments: I fiddled mightily with bullish assumption setups in this underlying and settled on this setup -- a covered zebra (zero extrinsic ratio back spread).
It consists of two parts: (1) a longer-dated zebra where I bought 2 x the 75 delta strike call and sold the -50 delta call to synthesize a 100 delta setup; (2) against which I sold a shorter-dated -30 delta call. This emulates the delta metrics of a covered call, but with a smaller buying power effect than either a covered call or a long call diagonal.
Metrics:
Buying Power Effect: 9.93 debit
Break Even: 49.96/share
Max Profit: 2.04
While you can manage the separate, bullish assumption spreads of the setup, I'll look to money/take/run at 110% of what I put it on for and/or look to roll out the short call to reduce my break even further should my take profit not hit.

Opening (IRA): TQQQ March 21st 68 Covered Call... for a 64.63 debit.
Comments: Starter position on weakness, selling the -75 delta call against shares to emulate the delta metrics of a 25 delta short put, but with built-in short call defense.
Metrics:
Buying Power Effect/Break Even: 64.63
Max Profit: 3.37
ROC at Max: 5.21%
50% Max: 1.69
ROC at 50% Max: 2.61%
Will generally look to take profit at 50% max, add at intervals assuming I can get in at strikes better than what I currently have on, and/or roll out short call if my TP is not hit.

Opening (IRA): SOXL March 21st 20 Covered Call... for an 18.21 debit.
Comments: Adding to my current position at strikes better than what I have on, selling the -75 delta call against shares to emulate the delta metrics of a 25 delta short put, but with built-in short call defense.
Metrics:
Buying Power Effect/Break Even: 18.21
Max Profit: 1.79
ROC at Max: 9.83%
50% Max: .90
ROC at 50% Max: 4.91%
Will generally look to take profit at 50% max, add at intervals assuming I can get in at strikes better than what I currently have on, and/or roll out short call if my TP is not hit.

DIS The Walt Disney Company Options Ahead of EarningsIf you haven`t bought the dip on DIS:
Now analyzing the options chain and the chart patterns of DIS The Walt Disney Company prior to the earnings report this week,
I would consider purchasing the 140usd strike price Calls with
an expiration date of 2025-6-20,
for a premium of approximately $1.35.
If these options prove to be profitable prior to the earnings release, I would sell at least half of them.
