MSTR Bulls Reload on BTC ConvictionMSTR – Institutional Flow + BTC Correlation + Bull Vertical Spread Setup
MicroStrategy (MSTR), operating as “Strategy,” just went full throttle—adding 10,100 BTC between June 9–15 at an average of $104,080 per coin, totaling over $1.05B. With this, they now hold 592,100 BTC (>$63B), solidifying their status as the largest Bitcoin-holding public company. That’s a bold move amid the ongoing Israel-Iran macro uncertainty, signaling confidence, not caution.
This latest BTC buy was funded via STRK and STRF ATM offerings and the $979.7M STRD preferred IPO. Since initiating their Bitcoin treasury strategy in 2020, MSTR has soared over 3,000%, and they’re projecting a 25% BTC yield for 2025 after already clocking in at 13.7% YTD.
🔎 Flow Watch
Institutional activity around current price levels has been sharp—confirming conviction behind the recent momentum. With BTC hovering at critical support, I’m eyeing a potential short-term bullish reversal. Given the tight correlation between BTC and MSTR, the setup looks primed.
🎯 My Strategy
I’m targeting a bull vertical spread—buying the 382.5 call and selling the 385 call. This defined-risk, limited-reward setup positions me to capture near-term upside if BTC begins a rebound and MSTR follows suit. The tight strike range and elevated IV make it ideal for a premium-efficient directional bet.
Optionstrading

MKC McCormick & Company Options Ahead of EarningsAnalyzing the options chain and the chart patterns of MKC McCormick & Company prior to the earnings report this week,
I would consider purchasing the 85usd strike price Calls with
an expiration date of 2026-1-16,
for a premium of approximately $1.40.
If these options prove to be profitable prior to the earnings release, I would sell at least half of them.
Disclosure: I am part of Trade Nation's Influencer program and receive a monthly fee for using their TradingView charts in my analysis.

$NVDA 6/27 exp week; $150 calls. Quick ChartHello. Market is moving up off the “news” of “ceasefire” from Trump. Take what is given I suppose. NASDAQ:NVDA could see a beautiful upside towards the psych level of $150 in just one session (Tuesday, 6/24) which is just a “small” move of 3%. Could break out of its rising wedge. This name has been lackluster as of late (kinda sorta). $150 calls will be entered at open (6/24) and my first target will be $148.98. There are multiple rejections at these levels. Good luck!
WSL

Bajaj finance for Swing Bajaj finance is good looking for swing,
Small sl, and good support,
Add in your watchlist.

[06/16] Weekly GEX Roadmap - Diagonal Spreads or Put Hedges?📊 Weekly GEX Map (SPX)
This week’s GEX profile looks nearly identical to last week:
Positive bias above 6020 up to 6100
But a sticky chop zone remains from 5975 to 6020
Below 5950? That’s where things get interesting…
⚠️ What Happens If 5950 Fails?
In that case - welcome to negative gamma territory:
Delta becomes unstable → fast, erratic moves
Gamma loses influence → hedging effectiveness drops
Dealer hedging lags → market makers chase, not lead
Vega + theta distort readings → charm decay accelerates
Result:
GEX zones lose clarity.
Pinning breaks down.
Reactions become nonlinear and emotional.
If we drop below 5950, we might see acceleration instead of stabilization — despite the positive GEX profile.
💡 Trade Idea of the Week – With Caution
If not for Wednesday's macro risk (Fed rate decision), I'd suggest a bullish diagonal spread toward 6100–6150:
Limited downside
Defined risk
Covers the full squeeze zone
But with FOMC looming, I'd only hold this trade until Thursday and close once the debit doubles or earlier.
🧨 Macro + Geo Risks
Fed is priced for “no move” → any surprise = volatility spike
Rising tensions with Iran → oil and futures could react violently
Recommendation : Avoid OIL this week, especially futures and naked strategies
🛡️ Prefer Downside Protection?
If you expect weakness on SPX weekly:
Consider a put debit spread with the short leg at 5950, where the second strongest Put Support sits.
This type of structure can offer up to 6:1 reward-to-risk, making it one of the most efficient bearish hedges for this week.
If you enjoyed the above breakdown, feel free to check out my previous weekly analyses or explore my tools as well.
Until next time – Trade what you see, not what you hope,
– Greg @ TanukiTrade

$META - Consolidation Cluster Bullish Flagging Ahead of The FedPrice held above key levels after breakout and is now flagging near highs.
700+ zone holding as new support
Strong structure with rising 9EMA catch
Volume cooling, but MACD remains bullish
Eyeing potential expansion above $708–710 range
This setup favors continuation. Watching for a clean break and close above $708 to confirm next leg higher.

MU Options Insight: Bulls Eyeing $123Fundamental Overview
Micron Technology's $200 billion expansion plan aligns with the broader push for domestic semiconductor manufacturing. The company is investing $150 billion in fabrication plants across Idaho, New York, and Virginia, while $50 billion is allocated for high-bandwidth memory packaging and R&D. This move strengthens Micron’s position in AI-driven demand and supply chain resilience.
The CHIPS and Science Act funding of $6.4 billion and eligibility for the Advanced Manufacturing Investment Credit further bolster Micron’s financial outlook. CEO Sanjay Mehrotra emphasized that this expansion will create tens of thousands of jobs and reinforce U.S. tech leadership.
Technical Analysis
Micron’s stock is currently near a 12-month high, up 37% year to date. The momentum remains strong, with institutional activity suggesting bullish sentiment.
- Options Flow Insight: A vertical bull spread was spotted in Times & Sales, with 118 strike contracts executed on the ask and 123 strike contracts executed on the bid simultaneously. This suggests a bullish stance, as traders anticipate further upside.
- Expiration Consideration: The June 20 expiration (4 days away) indicates a short-term bullish outlook, likely targeting a breakout above $123.
- Institutional Positioning: The 500 additional contracts at 118 reinforce the bullish bias. If MU moves beyond $123, traders holding the spread still profit, confirming strong conviction in upside potential.

Why Recursion Pharmaceuticals RXRX Could Be the NVDA of BiotechRecursion Pharmaceuticals RXRX is rapidly emerging as a transformative force in drug discovery, leveraging cutting-edge artificial intelligence and automation to industrialize and accelerate the development of new medicines. Here’s why RXRX could be the next NVIDIA (NVDA) of biotechnology and why its stock could soar by year-end:
1. AI-Powered Drug Discovery Platform with Unmatched Scale
Recursion integrates AI, machine learning, automation, and advanced data science to decode biology and chemistry, dramatically reducing the time and cost of drug discovery.
The company’s proprietary BioHive-2 supercomputer, built with NVIDIA’s DGX H100 systems, is the most powerful AI computing system wholly owned by any biopharma company, enabling Recursion to process biological data at unprecedented speeds.
By reducing the number of compounds needed for clinical candidates from thousands to just 136–200 and shrinking development timelines to under a year, RXRX is fundamentally changing the economics of pharmaceutical R&D.
2. Strategic Partnerships and Industry Validation
RXRX has forged high-profile partnerships with pharmaceutical giants such as Bayer, Roche/Genentech, Takeda, and Sanofi, validating its platform and unlocking milestone payments that could exceed $20 billion over time.
The company’s collaboration with AI biotech Exscientia in a $700 million deal further cements its leadership in the AI-driven drug discovery space, creating a pipeline of 10 clinical and preclinical programs with hundreds of millions in potential milestones.
NVIDIA itself holds over 7.7 million shares of RXRX, making it one of NVIDIA’s largest biotech investments and a strong endorsement of Recursion’s technology and long-term vision.
3. Explosive Revenue Growth and Strong Cash Position
Analysts forecast Recursion’s revenue to grow at a 65% CAGR from $58.8 million in 2024 to $263 million by 2027, far outpacing the broader biotech sector.
The company ended 2024 with over $600 million in cash, providing a solid runway for continued investment in R&D, platform expansion, and clinical trials.
Wall Street analysts expect more than 50% upside in RXRX stock over the next 12–24 months, with multiple clinical milestones and partnership announcements as near-term catalysts.
4. Disruptive Vision: The “Virtual Cell” and Beyond
RXRX is building toward a “virtual cell,” where AI models can simulate biological processes with such accuracy that wet lab experiments shift from data generation to validating computational predictions.
This approach could dramatically improve drug development success rates, addressing the industry’s notorious 95% failure rate and positioning Recursion as the go-to platform for next-generation drug discovery.
5. Market Sentiment and Institutional Support
RXRX has caught the attention of growth investors and major funds, including Cathie Wood’s ARK Invest, further boosting its profile and liquidity.
Recent stock surges and high trading volumes reflect growing investor confidence in Recursion’s disruptive potential and the broader AI-in-biotech trend.

$MSTR bear flag forming; Daily $350 targetHello, quick mobile chart posting here. Simple looking bear flagging forming. Bitcoin having some downside action, I imagine Saylor will be buying some Bitcoin soon again as well. This should see $350. Looking for a short. + geopolitical turmoil hits crypto/Bitcoin the hardest and most violent. The 20 and 50 EMA are aligned as well with the Supertrend Downtrend showing $350.
WSL.

Expiration Dates for Options using Fibonacci Time ZoneThis is a way I use the Fibonacci Time Zone; it naturally leans into a balance of Gamma and Theta Decay. Choosing the right strike zone is up to your strategy. I prefer Covered Calls, Debit Spreads and Iron Condors for this strategy. Puts are fair game too. If you choose to roll something over, most recoveries occur after a month and a half after a 10% SPY drop off.

[06/09] [GEX] Weekly SPX OutlookLast week’s outlook played out quite well — as anticipated, SPX hit the 6000 level, closing exactly there on Friday. This was the realistic target we highlighted in last week's idea.
🔭 SPX: The Bigger Outlook
It's difficult to say whether the rising SPX trend will continue. We're still in the "90-day agreement period" set by the administration, and so far, the market has shown resilience, avoiding deeper pullbacks like the one we saw in April.
With VIX hovering around 17–18, we’ve reached a zone where further SPX upside would require volatility. For the index to continue rising meaningfully, it needs to reverse the current bearish macro environment, and that can only happen with strong buying momentum — not a slow grind.
The parallel downward channel drawn a few weeks ago is still technically valid. Even a short 100-point squeeze would fit within this structure before a larger move down unfolds.
GEX levels give us useful clues heading into Friday. We're currently in a net positive GEX zone across all expirations, giving bulls a structural advantage, just like last week.
As of Monday’s premarket, SPX spot is at 6009.The Gamma Flip zone is between 5975–5990, with a High Volume Level (HVL) at 5985.
🔍 Let’s zoom in with our GEX levels — this gives us a deeper view than our GEX Profile indicator for TradingView alone.
🐂 🟢 If SPX moves higher, the following are logical profit-taking zones:
6050 (Delta ≈ 33)
6075 (Delta ≈ 25)
6100 (Delta ≈ 17)
🎯 Targeting above 6100 currently feels irrational — for instance, the next major gamma squeeze zone is at 6150, but that corresponds to a delta 6 level (≈94% chance the price closes below it), so I won’t aim that high yet.
🐻🔴 In a bearish scenario:
5975 and 5950 are the first nearby support zones (Deltas 30 and 38).
If momentum picks up, 5900 becomes reachable quickly, even if it's technically a 17-delta distance — because that’s deep in the negative GEX zone.
📅 Don’t forget: On Wednesday premarket, we’ll get Core Inflation Rate data — a key macro risk that could shake things up, regardless of TSLA drama fading.
📌 SPX Weekly Trading Plan Conclusion
Whatever your bias, keep cheap downside hedges in place. We've been rising for a long time, and even if SPX breaks out of the descending channel temporarily, resistance and the gamma landscape may pull price back swiftly.

NVO Soaring Towards TargetsOur NVO call debit spreads and LEAPS options soaring towards targets at the 233 EMA here.
Beautiful thing when fundamentals, valuations and technicals align.
Impulse move from the bottom gave us a hat trick - triple green tags (white circles) for bullish A+ momentum signals into a consolidation period in which we built our position and added on the consolidation breakout

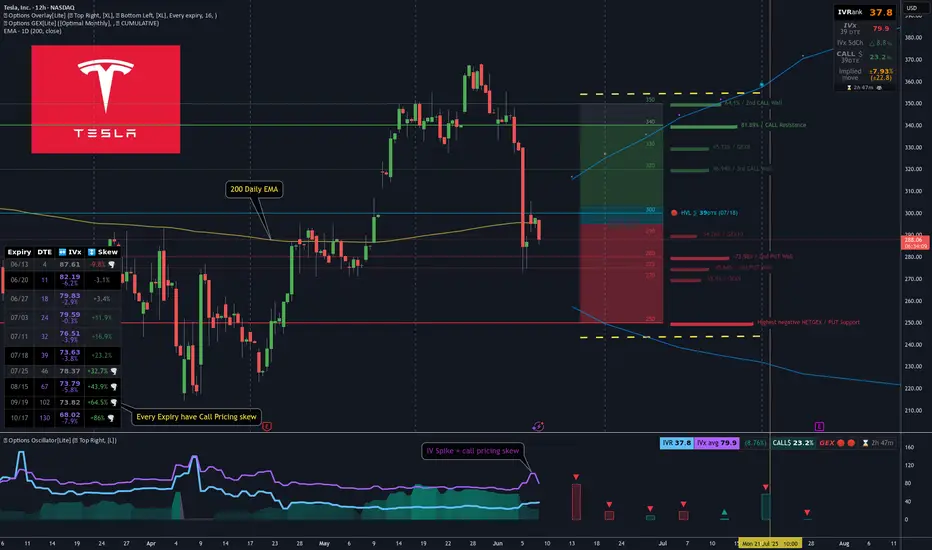
[GEX] TSLA Breakdown & Options Trade Idea for 39DTELast week, TSLA dropped hard, likely due to political tensions. Let’s not forget — just a month ago, their EVs were showcased at the White House entrance...
In the span of 30 hours, TSLA fell -22% (see red line below), while SPX barely reacted. Why? Because both realized and implied volatility dropped — remember VIX is around 17/18.
This sharp TSLA drop already seemed overdone, which helped fuel the +5% bounce on Friday.Most TSLA options positions are near-term and still show negative sentiment — but further expirations grow increasingly bullish.
🔍 If you use options GEX matrix , you’ll see the bearish hedging flow gradually turns more neutral-to-bullish.
Most cumulative support/resistance zones lie between 250–340, with spot currently just under the chop zone.
🧠 TSLA Trade Idea
It’s been a while since I posted a neutral Iron Condor, but TSLA might be an exception.
Despite last week’s IV spike, call pricing skew still dominates across expirations — as seen in our Options Overlay indicator.This tells me the market doesn’t fear TSLA crashing below 200. So, I’m aiming to capture premium on the July 18th expiry without day trading.
I’m thinking of something simple, well-manageable in either direction.To refine leg placement, I use visual GEX zones.
🐻🔴 Downside:
Strong put support at 250
Gradual support layers up to 280
🐂 🟢 Upside:
Target area: 340–350 for the July 18 expiry.
📅 Closing the Trade:I'll consider closing or adjusting at 21 DTE or when 50% max profit is hit — per TastyTrade’s studies.
🔁 Rolling Plan:IF short delta on one side drops below ~14 and price pulls away, I’ll roll the untested side to collect more credit.
🧑🏫 I’ll likely post trade management live in Discord for educational purposes.
~~~~~~~~~~~~~~~~~~~~~~~~~~~~~~~~~~~
🦋 Bonus Idea: TSLA Broken Wing Butterfly
If you think TSLA has more downside, a Put Broken Wing Butterfly — like the one shown in my previous YT video — is also a great way to structure this trade using the same GEX levels.
There’s no single way to use Gamma Exposure — it’s the most actionable hedging signal we have. Combine it with your knowledge of strategies and you can trade almost any scenario.
One thing’s for sure — this market moves faster than ever.A single day of internal conflict wiped -22% off TSLA…The next morning, the market already moved on, so as always:
Trade Safe Out There!
CHAMBAL FERTILIZERS FOR SWING TRADECHAMBAL FERTILIZERS a good opportunity for swing trade plan, entry and exit point mention, add your watchlist and observe.
This is for Education purpose only...


Once It Starts, It Might Be Too Late to Jump InHey guys, vacation’s over — time to get back behind the screen and into the reports. Naturally, I kicked things off with a deep dive into ETH options activity , because that’s where the real market whispers come from.
Here’s what stood out:
Over the past week, the biggest trading volume and open interest inflow came at strikes $3000–$3200–$3400 (see screenshot). Most of the action was in standalone calls , though a portion showed up as call spreads — meaning some players are betting on a controlled rally, not just blind bullishness.
The June 27, 2025 expiry remains the clear leader in open interest — still the date everyone’s watching.
With implied volatility at 67.9% , ETH has about a 68% probability (1σ) of reaching $2,950 by expiry — just 18 days away .
Key Takeaways:
$3000–$3200 looks totally within reach.
$3400 , though? Less than 15% chance based on current levels.
The sentiment among options traders is clearly bullish — they’re positioning for a breakout up from the sideways range, roughly by the full width of the pattern.

Navigating MSTR’s Price Swings: A Smart Options ApproachOverview
MicroStrategy (MSTR) has continued to capture market attention due to its aggressive Bitcoin strategy and significant stock price volatility. In 2025, MSTR surged 41% in one quarter but also reported a massive $4.22 billion net loss in Q1, raising concerns about long-term financial stability. Analysts remain divided, setting price targets ranging from $200 to $650, largely dependent on Bitcoin’s performance and broader market conditions.
Key Developments Impacting MSTR
✔ Bitcoin Exposure: MSTR maintains a large Bitcoin position, making its stock highly correlated to BTC’s price movements.
✔ AI Integration: The company is investing in AI-driven products, which could provide diversification outside of Bitcoin.
✔ Institutional View: Analysts remain split on MicroStrategy’s valuation due to its uncertain revenue model.
✔ Macro Volatility: Market-wide sentiment, interest rates, and crypto regulations will influence MSTR’s trajectory.
Options Strategy for the Week
🚀 Iron Condor Setup for June 6 Expiration
To capitalize on MSTR’s volatility while managing risk, an Iron Condor strategy is structured within a controlled range:
- Inner Range: Sell Calls at 395 and Puts at 335
- Coverage: Buy Calls at 415 and Puts at 315
✅ Objective: Profiting from sideways price movement while minimizing exposure to extreme volatility.
✅ Risk Management: If MSTR breaks above 415 or below 315, the long positions hedge against excessive losses.

Tesla Update Longs and shorts At the start of the video I recap my previous video and then bring us up to date with the present price action .
In this video I cover Tesla from the higher time frame and breakdown both a long term bullish scenario as well as a local bearish scenario .
Both of these scenarios present longs and short entries for day trade opportunities and swing positions .
Tools used Fibs , TR pocket , Volume profile , Pivots , and vwap .
Any questions ask in the comments
Safe trading and Good luck

06/02 Weekly GEX Analysis - 6000 Looks EasyThe biggest event last week was undoubtedly the court ruling involving Trump. The market responded with optimism, and on Thursday premarket, SPX surged toward the 6000 level — only to get instantly rejected. That strong rejection suggests this is a firm resistance zone.
From the GEX expiry matrix, it's clear that the market is hedging upward for this week, but downward for next week. To me, this indicates that while the near-term GEX sentiment remains slightly bullish, the market may be preparing for a pullback or retest in the medium term.
This week, SPX has already entered a GEX zone surrounded by positive strikes — up to around the 6000 level. That makes 6000 an “easy target” for bulls, and we’ll likely see profit-taking here, just like we did last Thursday premarket.
⚠️ However, if we look more closely at the weekly net open interest:
...we can see a strong bullish net OI build-up starting to emerge around the 6100 level — a price zone that currently feels distant and even unreachable. But if the 6000 resistance breaks, we could see a fast gamma-driven squeeze up to 6050 and possibly 6100 before the next wave of profit-taking kicks in.
As is often the case during bullish moves, the market seems blind to the bigger picture — no one’s looking down, only up. The mood is greedy, and momentum favors the bulls... for now.
Never underestimate FOMO — but also never underestimate Trump. He’s unlikely to accept the court’s decision on tariffs quietly. Any new negative headline could shake the market, no matter where price is sitting…

RBRK Rubrik Options Ahead of EarningsAnalyzing the options chain and the chart patterns of RBRK Rubrik prior to the earnings report this week,
I would consider purchasing the 90usd strike price Calls with
an expiration date of 2025-6-20,
for a premium of approximately $5.60.
If these options prove to be profitable prior to the earnings release, I would sell at least half of them.

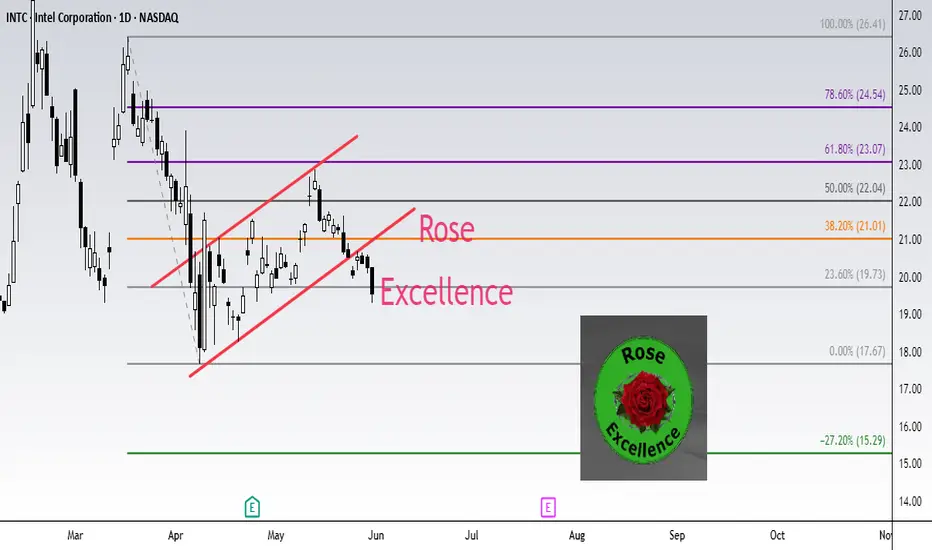
INTEL INTC Short setup target 15.29Fibonacci technical analysis : Intel Corporation NASDAQ:INTC has already found resistance at the Fib level 61.8% (23.07) of my Down Fib. The May 30th Daily candle has closed below retracement Fib level 23.6% (19.73), confirming a sell signal. A Bear Flag pattern has also formed. My Down Fib guides me to look for NASDAQ:INTC to eventually go down to hit first target at Fib level -27.2% (15.29).
NASDAQ:INTC – Target 1 at -27.2% (15.29), Target 2 at -61.8% (12.26) and Target 3 at -78.6 (10.79)
Stop loss slightly above the 50.0% retracement Fib level (22.04).
Enjoy the trading process and take time to smell the roses🌹
[05/27] Weekly GEX Outlook for SPX⚠️ Unbalanced GEX & Institutional Hedging – A Closer Look
I haven’t seen such an asymmetric GEX setup in quite a while — and it’s definitely not a pretty one 😬. The current profile suggests a highly skewed positioning in the market:
📍 Massive upside expectation:
It feels like the market is almost exclusively preparing for a move toward 6000.
🛑 Limited downside protection:
Below the current level, there's very little hedging in place — especially unusual with Friday’s expiry approaching.
🔻 Current Key Zone: 5925-5930
The largest put open interest is sitting right around 5925, which is also close to spot.
Below that? Things get murky. The GEX profile becomes fragmented and mixed, with no clear put support until much lower.
Interestingly, most of the current downside hedging is clustered around the 5900–5925 range, which includes ITM puts — not OTM, as you’d typically expect from retail.
🧠 Institutional Footprint vs. Retail
This hedging pattern — closer to ATM rather than deep OTM — suggests institutional players are managing downside risk with precision.
In contrast, retail traders don’t seem to be actively hedging the downside with OTM puts, which is a notable shift from typical behavior in high-IV weeks like this.
🔼 What to Watch: The 5930 Breakout
If SPX can break and hold above 5930, it enters a clear, call-dominated zone.
From there, the path to 6000 looks much cleaner, with lighter resistance and the potential for a gamma-driven push 📈.
The details show the same picture when examining more details:
SPX conclusion
😬 In short: we’re at a tipping point.
Below 5900, hedging is tactical and institutional.
Above 5900, the path is open to 6000 — but only if bulls can take control at 5930!

NVDA GEX Earnings Outlook by OptionsNVDA reports earnings this Wednesday, and it’s a big deal. A major move could impact both the indexes and broader tech sector.
The OTM 16 delta curve essentially overlaps with both the GEX profile and the expected probability zone — signaling strong confluence.
📈 Rising IV with falling call skew: Volatility is rising into earnings, while the call skew is dropping — a sign of growing interest in downside hedging/speculation.
🔷 Key inflection zone (129): Above 129, the market is unlikely to surprise. Below it, however, a domino effect could trigger increased volatility and put-side flows.
Implied move into earnings is 6.62%, reflecting binary risk expectations from the options market.
Strong gamma squeeze territory exists between 140–145, with significant call wall buildup around 140.
The nearest expiry shows a positive net GEX — supporting short-term mean-reversion or hedging flow stability above 129, at least until the earnings print.
🔴 Downside risk scenario:
In the event of a downward move, the market is most heavily hedged around the 125 level, which aligns with the deepest put support.
💡 Wheeling Opportunity Idea
ONLY IF you want to own NVDA long-term around the $130 level (even if it drops short/mid-term), this might be a great time to start the wheeling strategy.
Because earnings inflate volatility, you can sell a near-term cash-secured put (CSP) for solid premium — even on a 53DTE (July) option.
Based on current GEX levels, we’re seeing:
-Support (squeeze zone) around $125
-Call resistance around $140
-A potential upside squeeze extending to $145-$150
These align roughly with ~20 delta OTM options, so the premium is attractive.
How would I personally start this:
Sell a CSP for May 30 with the intention to get assigned if NVDA drops.
If I do get assigned, I’m happy to own shares.
Then, I sell a 60DTE covered call right after to collect another round of premium.
If I’m not assigned, I sell a new 45–60DTE put the following week — still benefiting from the relatively high IV.
👉 Remember: High IV = synthetic time value. With this two-step method, you can harvest premium twice in quick succession.
I used the same technique with NASDAQ:INTC , and it’s been performing well.
💥 ONLY IF you want to own NVDA long-term around the $130 level (even if it drops short/mid-term)!
