Will BTCUSD rapidly decrease in the near future?Hello dear friends. Today, BTCUSD continues to decline as predicted. After breaking the uptrend at 27.549, BTC on the 4H timeframe is consolidating at 26.834 at the time of writing. Therefore, there is a possibility of recovery in the near future.
However, the downward momentum is still dominant in the coming time, so BTC will quickly decrease to the support level at 26.383. Surpassing this level will push BTC to continue seeking lower support at 26.188.
If you find this article helpful and useful, please leave a like and follow to receive the latest updates. I would greatly appreciate it.
Optionstrading

MS Morgan Stanley Options Ahead of EarningsIf you haven`t bought MS here:
Then analyzing the options chain and the chart patterns of MS Morgan Stanley prior to the earnings report this week,
I would consider purchasing the 85usd strike price Calls with
an expiration date of 2024-1-19,
for a premium of approximately $1.85.
If these options prove to be profitable prior to the earnings release, I would sell at least half of them.
Looking forward to read your opinion about it.

JPM JPMorgan Chase & Co Options Ahead of EarningsIf you haven`t sold JPM here:
or reentered ahead of the previous earnings:
Now analyzing the options chain and the chart patterns of JPM JPMorgan Chase & Co prior to the earnings report this week,
I would consider purchasing the 147usd strike price Calls with
an expiration date of 2023-10-13,
for a premium of approximately $1.91.
If these options prove to be profitable prior to the earnings release, I would sell at least half of them.
Looking forward to read your opinion about it.

UNH UnitedHealth Group Incorporated Options Ahead of EarningsIf you haven`t sold UNH`s Double Top here:
or reentered the Double Bottom:
Then analyzing the options chain and the chart patterns of UNH UnitedHealth Group Incorporated prior to the earnings report this week,
I would consider purchasing the 530usd strike price Calls with
an expiration date of 2023-10-13,
for a premium of approximately $6.40.
If these options prove to be profitable prior to the earnings release, I would sell at least half of them.
Looking forward to read your opinion about it.

$TSLA Mission Failed heading back to Support Key Price Levels:
Support:$223.85, $229.39, $232.50, $246.42, $250.29
Resistance: $257.16, $263, $268
Chart Patterns:
Day: 2-2d continuation
Week: 2-2-2u continuation (not enforce), with an inverse hammer
Month: 2-1 inside with inverse hammer
Quarter: 2-1 inside with inverse hammer
Volume Analysis:
Day: Bearish volume confirms the 2-2d continuation Week: Bearish volume confirms inverse hammer pattern
Month: Bullish volume building
Quarter: Volume data not conclusive.
Overall Outlook: I'm looking for a retest of $246, and possibly $232.50, before a bullish continuation.
Note: Loss it's 9 and 50-day EMAs with a 2-2d continuation and strong bearish volume.

$WBA 11DTE SHORT PUT 10% profit target #WBA #options10% TP for my cap in 10 days? It's good....
Any kind of naked PUTs on big instrument are my favorite at high IVR with divergence.
My choice for today: Walgreens Boots Alliance Inc.
Reasons:
- RSI is already oversold with big divergence
- breakeven point is little close, but allowed loss ($50 max) is manageable
SETUP:
NAKED PUT for NASDAQ:WBA , because IVR is high, for 0.7cr
* Sell 2 NASDAQ:WBA OCT13 '22 PUT
Max profit: $152
Probability of 50%Profit: 72% (TP: $95)
Profit Target relative to my Buying Power: 10%
Req. Buy Power: $1035 (max loss without management before expiry, no way to let this happen!)
Tasty IVR: 84 (very high)
Expiry: 11 days
SOLD OCT13'22PUT @ 0.76cr

FAST Fastenal Company Options Ahead of EarningsIf you haven`t bought FAST here:
Then analyzing the options chain and the chart patterns of FAST Fastenal Company prior to the earnings report this week,
I would consider purchasing the 55usd strike price Puts with
an expiration date of 2023-10-20,
for a premium of approximately $0.87.
If these options prove to be profitable prior to the earnings release, I would sell at least half of them.
Looking forward to read your opinion about it.

WFC Wells Fargo & Company Options Ahead of EarningsIf you haven`t bought the dip on WFC:
Then analyzing the options chain and the chart patterns of WFC Wells Fargo & Company prior to the earnings report this week,
I would consider purchasing the 42.50usd strike price Calls with
an expiration date of 2024-3-15,
for a premium of approximately $1.87.
If these options prove to be profitable prior to the earnings release, I would sell at least half of them.
Looking forward to read your opinion about it.

SPX Weekly Outlook ending Oct 13We have one large gap above and 2 gaps below. As usual, 4300 and 4200 are the whole number support.
Above 4325; we can go for the gap fill to 4400-4405. Over 4405 is 4465
Below 4300 is 4200 and then 4150 then 4100.
Remember, the JPM collar is calling for 4500 above and then 4050 below.

$META: Strong EMA Hold & Bullish Confluence Pre-EarningsExamining NASDAQ:META , the stock showcased resilience with an inside hammer formation on a 3-1 count, complemented by a rise in volume. It's commendable how it stands firm above both its 9 & 50-day EMAs, indicating strong bullish sentiment. Of particular note, despite market pressure from AMEX:SPY and TVC:VIX , NASDAQ:META staunchly defended its support levels. This strength was further underscored by its position as the 3rd highest in options call flow. As we navigate through timeframes, the stock maintains an inside day-week-month pattern, suggesting a possible bullish trend continuity. The presence of a hammer and a bullish flag across these timeframes amplifies this sentiment. With earnings approaching later this month, traders should keep a keen eye on NASDAQ:META for potential breakouts and trade opportunities

JEF Jefferies Financial Group Options Ahead of EarningsIf you haven`t sold JEF here:
Then analyzing the options chain and the chart patterns of JEF Jefferies Financial Group prior to the earnings report this week,
I would consider purchasing the 37.50usd strike price Puts with
an expiration date of 2024-1-19,
for a premium of approximately $2.12.
If these options prove to be profitable prior to the earnings release, I would sell at least half of them.
Looking forward to read your opinion about it.

CNXC Concentrix Corporation Options Ahead of EarningsAnalyzing the options chain and the chart patterns of CNXC Concentrix Corporation prior to the earnings report this week,
I would consider purchasing the 75usd strike price Calls with
an expiration date of 2024-04-19,
for a premium of approximately $8.90.
If these options prove to be profitable prior to the earnings release, I would sell at least half of them.
Looking forward to read your opinion about it.

PRGS Progress Software Corporation Options Ahead of EarningsAnalyzing the options chain and the chart patterns of PRGS Progress Software Corporation prior to the earnings report this week,
I would consider purchasing the 55usd strike price Puts with
an expiration date of 2023-10-20,
for a premium of approximately $1.57.
If these options prove to be profitable prior to the earnings release, I would sell at least half of them.
Looking forward to read your opinion about it.

MLKN MillerKnoll Options Ahead of EarningsAnalyzing the options chain and the chart patterns of MLKN MillerKnoll prior to the earnings report this week,
I would consider purchasing the 20usd strike price Calls with
an expiration date of 2023-10-20,
for a premium of approximately $1.32.
If these options prove to be profitable prior to the earnings release, I would sell at least half of them.
Looking forward to read your opinion about it.

FERG Ferguson Options Ahead of EarningsAnalyzing the options chain and the chart patterns of FERG Ferguson prior to the earnings report this week,
I would consider purchasing the 155usd strike price Calls with
an expiration date of 2023-10-20,
for a premium of approximately $2.72.
If these options prove to be profitable prior to the earnings release, I would sell at least half of them.
Looking forward to read your opinion about it.

CTAS Cintas Corporation Options Ahead of EarningsAnalyzing the options chain and the chart patterns of CTAS Cintas Corporation prior to the earnings report this week,
I would consider purchasing the 500usd strike price Puts with
an expiration date of 2023-10-20,
for a premium of approximately $10.70.
If these options prove to be profitable prior to the earnings release, I would sell at least half of them.
Looking forward to read your opinion about it.

CUK Carnival Corporation Options Ahead of EarningsAnalyzing the options chain and the chart patterns of CUK Carnival Corporation prior to the earnings report this week,
I would consider purchasing the 10usd strike price in the money Calls with
an expiration date of 2023-10-20,
for a premium of approximately $2.60.
If these options prove to be profitable prior to the earnings release, I would sell at least half of them.
Looking forward to read your opinion about it.

MTN Vail Resorts Options Ahead of EarningsAnalyzing the options chain and the chart patterns of MTN Vail Resorts prior to the earnings report this week,
I would consider purchasing the 240usd strike price Puts with
an expiration date of 2023-10-20,
for a premium of approximately $9.05.
If these options prove to be profitable prior to the earnings release, I would sell at least half of them.
Looking forward to read your opinion about it.

KMX CarMax Options Ahead of EarningsAnalyzing the options chain and the chart patterns of KMX CarMax prior to the earnings report this week,
I would consider purchasing the 79usd strike price in the money Puts with
an expiration date of 2023-9-29,
for a premium of approximately $4.00.
If these options prove to be profitable prior to the earnings release, I would sell at least half of them.
Looking forward to read your opinion about it.

STZ Constellation Brands Options Ahead of EarningsAnalyzing the options chain and the chart patterns of STZ Constellation Brands prior to the earnings report this week,
I would consider purchasing the $262.5 strike price in the money Calls with
an expiration date of 2023-10-20,
for a premium of approximately $2.07.
If these options prove to be profitable prior to the earnings release, I would sell at least half of them.
Looking forward to read your opinion about it.

AMD Down -23% Since the last update | What's Next? 🤔Daily bouncing off demand after a massive sell-off. Low holds, and we can see a small pump into daily supply above, where shorts can get another chance to short it with a target of new lows.
Weekly looks like it's just working on a massive Head and shoulder topping pattern and should be resolved after the Santa rally.
Will continue to update if there are any changes to the roadmap


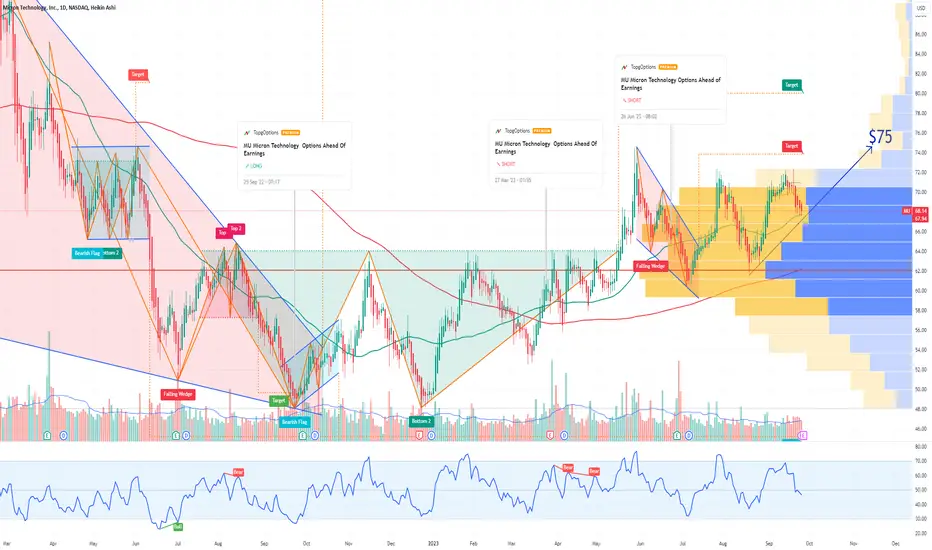
MU Micron Technology Options Ahead of EarningsIf you haven't bought MU here:
Then analyzing the options chain and the chart patterns of MU Micron Technology prior to the earnings report this week,
I would consider purchasing the 75usd strike price Calls with
an expiration date of 2024-1-19,
for a premium of approximately $3.37.
If these options prove to be profitable prior to the earnings release, I would sell at least half of them.
Looking forward to read your opinion about it.