ETH STRANGLE SEPT-OCT-DECEMBER 1800P-1900COptions P&L Chart
ETH STRANGLE SEPT-OCT-DECEMBER 1800P-1900C
Optionstrading

Short Dated Options to Deftly Manage Oil Market Shocks"Volatility gets you in the gut. When prices are jumping around, you feel different from when they are stable" quipped Peter L Bernstein, an American financial historian, investor, economist, and an educator.
Crude oil prices are influenced by a variety of macro drivers. Oil market shocks are not rare events. They appear to recur at a tight frequency. From negative prices to sharp spikes in volatility, crude oil market participants "enjoy" daily free roller-coaster rides.
Precisely for this reason, crude oil derivatives are among the most liquid and sophisticated markets globally. This paper delves specifically into weekly CME Crude Oil Weekly Options and is set out in three parts.
First, what’s unique about short-dated options? Second, tools enabling investors to better navigate crude oil market dynamics. Third, a case study illustrating the usage of weekly crude oil options.
PART 1: WHAT’S UNIQUE ABOUT CME CRUDE OIL WEEKLY OPTIONS?
Macro announcements such as US CPI, China CPI, Fed rate decisions, Oil inventory changes and OPEC meetings drive oil price volatility.
Sharp price movements can lead to premature stop-loss triggers. When prices gap up or gap down at open, stop orders perform poorly leading to substantial margin calls.
Weekly options enable hedging against these risks with limited downside and substantial upside.
Closer to expiration, options prices are sensitive to changes in the prices of the underlying. Small underlying price moves can have outsized value creation through short-dated options.
Hedging with weekly options allows investors to enjoy large upside potential. Short duration vastly reduces the options premium burden. This high risk-reward ratio has made short-dated options popular among both buyers and sellers.
The daily traded notional value of Zero-DTE options (Zero Days-To-Expiry, 0DTE) have grown to USD 1 Trillion. Among S&P 500 options, 0DTE options comprise 53% of the average daily volume (ADV), up from 19% a year ago.
In 2020, CME launched Weekly WTI options with Friday expiry (LO1-5), offering robust, round-the-clock liquidity and enabling precise event exposure management at minimal cost.
These weekly options are now the fastest growing energy products at CME with ADV growing 69% YoY with June 2023 ADV up 136% YoY.
Building on rising demand, CME added weekly options expiring Monday and Wednesday. At any time, the four nearest weeks of each option are available for trading.
Weekly options settle to the latest benchmark CL contract and like other CME WTI products, they are physically deliverable ensuring price integrity.
Each weekly WTI options contract provides exposure to 1,000 barrels. Every USD 0.01 change per barrel change in WTI represents a P&L change of USD 10 in premium per contract.
PART 2: EIGHT TOOLS TO BETTER NAVIGATE CRUDE OIL MARKET DYNAMICS
Highlighted below are eight critical tools across TradingView and CME enabling investors to better navigate oil market dynamics.
1. OPEC+ Watch
OPEC+ Watch charts the probability of different outcomes from OPEC+ meetings. Probabilities are derived from actual market data & represent a condensed consensus market view of forthcoming meetings.
2. News Flow
TradingView’s News section collates the key market developments impacting crude oil.
3. Forward Curve
TradingView maps crude oil prices across the forward curve exhibiting oil’s term structure.
Augmenting the forward curve chart is a table CL contracts across various expiries with technical signals embedded in them enabling investors to spot calendar spread trading opportunities.
4. TradingView Scripts
Supported by a vibrant community of script creators, TradingView has curated scripts catering to the specific needs of crude oil traders.
OIL WTI/Brent Spread by MarcoValente: Shows the spread between WTI and Brent crude. This spread is growing in importance with growth in US oil exports.
Seasonality Indicator by tradeforopp: Presents seasonal price trends along with key pivot points to guide traders.
5. Economic Calendars
TradingView’s economic calendar highlights upcoming economic events segmented by dates and with countdown timers to help traders better manage their portfolios.
Augmenting, TradingView’s calendar is CME’s Economic Events Analyzer which lists key events specifically impacting energy markets and highlights the relevant weekly options contract.
6. Options Expiration Calendar
CME’s Options Expiration Calendar is a comprehensive yet condensed view of upcoming expiration dates of WTI options, even those that are not listed yet.
7. Daily/Weekly Options Report
CME’s Daily/Weekly Options Report profiles volumes and OI by strike price for weekly options supplying key stats such as Put/Call ratio and key strike levels at a glance.
8. Strategy Simulator
CME’s strategy simulator allows investors to simulate diverse options strategies. Selecting the relevant instruments and adding each component of the overall position automatically calculates the payoff while still allowing modification of key statistics such as volatility based on user inputs.
The below shows the payoff of an ATM straddle position for the upcoming Monday weekly option.
It also allows simulating various market conditions. Selecting price trends such as up fast, up slow, flat, down slow, down fast can simulate the changes in P&L.
PART 3: ILLUSTRATING USAGE OF WEEKLY CRUDE OIL OPTIONS
Why does CME list weekly options expiring on Monday, Wednesday, and Friday?
Each of these address specific macro events. OPEC meeting outcomes are typically announced over the weekend leading to gaps in prices on Monday. EIA weekly crude oil inventory data are released on Wednesdays. Key US economic data such as CPI and Non-farm payrolls are released on Fridays.
Use Case for Options expiring on Monday
These can be used to hedge against downside risk associated with weekend events.
For instance, in April, OPEC+ announced major supply cuts at their meeting on Sunday. This led to WTI price spiking 4% at market open.
This can lead to “gap risk.” Gap risk refers to the risk that markets may open sharply above or below their previous close. Since, price never passes the levels in between, stop loss orders fail to trigger at set levels resulting in more-than-anticipated realised losses.
Such gap risks from weekend news can be managed through Monday weekly options which provides a predictable and resilient payoff with limited downside risk.
Use Case for Options expiring on Wednesday
Oil inventory reports by EIA (U.S. Energy Information Administration) and API (American Petroleum Institute) are released every week on Tuesday and Wednesday respectively. Major misses/beats against expectations for these releases can result in large price moves.
Wednesday options come in handy to better manage volatility stemming from these shocks or surprises.
Weekly options provide superior ROI on small moves when compared to futures. Favourable price moves deliver larger payoffs from position in weekly options than futures and shorter expiries allow for much lower premium than monthly options.
Illustrating with Back tested Results
On June 14th, Crude price fell by 1.7% (USD 1.2) to USD 68.7/barrel upon release of inventory data that showed a larger than expected inventory build-up.
In the lead up to this data release, a crude oil participant could either (a) Short Crude Oil Futures, or (b) Long Weekly Crude Oil Put Option.
Summary outcomes from these two strategies are tabulated and charted below. The results speak for themselves. Short dated long put option is capital efficient, prudent, and credible as a risk management tool. That said, participants must evaluate the risk return profile taking into consideration market liquidity and volatility levels, among others, when choosing between instruments.
KEY TAKEAWAYS
In summary,
1) Weekly Options can be cleverly deployed to hedge against shocks in oil markets.
2) TradingView & CME provide a rich suite of tools to deftly navigate the oil market dynamics.
3) Weekly options expiring on (a) Monday helps manoeuvre developments over the weekend, (b) Wednesday helps to manage inventory data linked shocks, and (c) Friday enables investors to trade and hedge around key US economic data.
MARKET DATA
CME Real-time Market Data helps identify trading set-ups and express market views better. If you have futures in your trading portfolio, you can check out on CME Group data plans available that suit your trading needs www.tradingview.com
DISCLAIMER
This case study is for educational purposes only and does not constitute investment recommendations or advice. Nor are they used to promote any specific products, or services.
Trading or investment ideas cited here are for illustration only, as an integral part of a case study to demonstrate the fundamental concepts in risk management or trading under the market scenarios being discussed. Please read the FULL DISCLAIMER the link to which is provided in our profile description.

TJX Companies Options Ahead of EarningsAnalyzing the options chain and the chart patterns of The TJX Companies prior to the earnings report this week,
I would consider purchasing the 86usd strike price Puts with
an expiration date of 2023-8-18,
for a premium of approximately $1.82.
If these options prove to be profitable prior to the earnings release, I would sell at least half of them.
Looking forward to read your opinion about it.

AQN Algonquin Power & Utilities Corp Options Ahead of EarningsAnalyzing the options chain and the chart patterns of AQN Algonquin Power & Utilities Corp prior to the earnings report this week,
I would consider purchasing the 10usd strike price in the money Puts with
an expiration date of 2023-8-18,
for a premium of approximately $1.77.
If these options prove to be profitable prior to the earnings release, I would sell at least half of them.
Looking forward to read your opinion about it.

Market Update - Risk Management A discussion about today's market and how swing trades played out and how risk mamangement plays a huge part in this and needs to be respected.

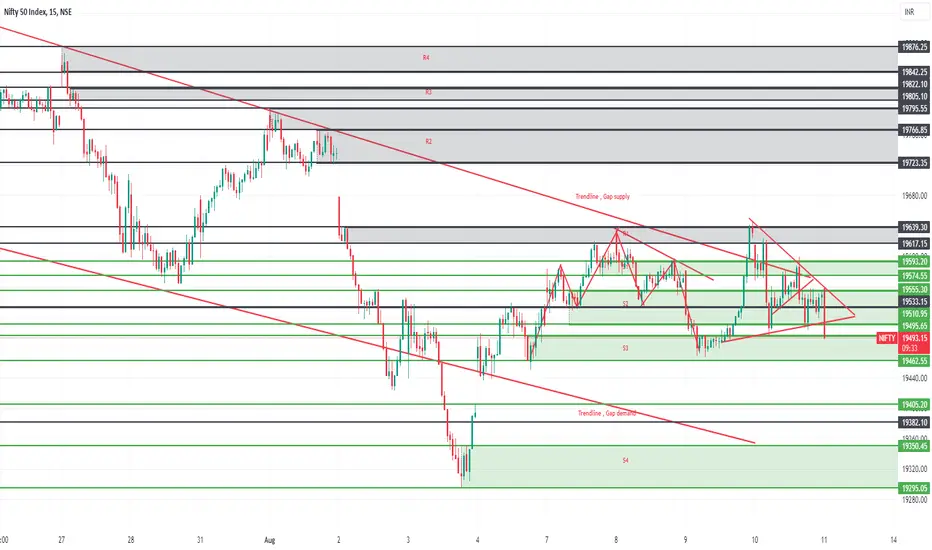
Nifty Demystified in Multiple TF for August 11 2023
1) Weekly – Previous week candle has a bigger wick at the bottom indicating buying momentum at the lower levels
This week candle seems to be an inside candle to the previous week candle. Need to wait for today's closing to conclude on this.
2) Daily indicates – 19450 to 19500 is a strong support area. There is a hammer at the Trendline followed by a confirmation candle of yesterday, can’t be ignored.
For any further down move to continue on the positional basis, there must be a daily close less than 19530.
Intraday analysis
1) 4H candles indicate wicks at the bottom at the Trendline supply zone indicating that sell orders are being absorbed at the supply levels at the same time there is buying at 19490-19530 region every time price hits there.
2) 30 Minutes indicate that, the selling is too strong till now, the size of the red candles is too big compared to the green ones and one red candle has covered a minimum of 2 green candles, the green candles formed in the last 30 mins are weak ones.
3) There has been an excellent price compression in the 15 minutes and 5 minutes time frame, so will wait for the price action to go long/short after 10 AM.
Supply and Demand zones have been marked.
Happy trading !
PENN Entertainment Options Ahead of EarningsAnalyzing the options chain and the chart patterns of PENN Entertainment prior to the earnings report this week,
I would consider purchasing the $25.50 strike price Calls with
an expiration date of 2023-8-11,
for a premium of approximately $0.90.
If these options prove to be profitable prior to the earnings release, I would sell at least half of them.
Looking forward to read your opinion about it.

Basics of Options TradingIntroduction
Options trading is a versatile and potentially lucrative investment strategy that allows traders to speculate on the future price movements of underlying assets. Unlike traditional stock trading, options trading grants investors the right, but not the obligation, to buy or sell an asset at a predetermined price (the strike price) within a specified time frame. This article aims to provide a comprehensive overview of the basics of options trading, empowering readers with essential knowledge to navigate this exciting financial market.
Understanding Options
Options are financial derivatives that derive their value from an underlying asset, such as stocks, commodities, indices, or currencies. There are two types of options: call options and put options.
• Call options: A call option provides the holder the right to buy the underlying asset at the strike price before or on the expiration date.
• Put options: A put option grants the holder the right to sell the underlying asset at the strike price before or on the expiration date.
The Option Contract
Each option contract represents a specific quantity of the underlying asset, known as the contract size. For equity options, one contract typically covers 100 shares of the underlying stock. The contract's expiration date determines the period during which the option can be exercised, making it crucial for traders to choose an appropriate time frame for their investment objectives.
Option Premium and Factors Influencing Pricing
The option premium is the price paid by the option buyer to the seller for acquiring the option. Several factors influence the pricing of options:
• Intrinsic Value: The difference between the current price of the underlying asset and the option's strike price. For call options, the intrinsic value is positive when the underlying asset's price is above the strike price. For put options, the intrinsic value is positive when the underlying asset's price is below the strike price.
• Time Value: The additional value attributed to the option due to the time remaining until expiration. The more time an option has until expiration, the higher its time value, as it provides more opportunities for the underlying asset's price to move favorably.
• Implied Volatility: A measure of market expectations for the underlying asset's future price volatility. Higher implied volatility results in increased option premiums, as uncertainty enhances the potential for significant price swings.
Trading Strategies
Options offer a wide array of trading strategies, catering to different risk appetites and market outlooks. Some popular strategies include:
• Buying Call or Put Options: Traders purchase call options if they anticipate the underlying asset's price to rise, and put options if they expect the price to fall. This strategy limits the potential loss to the premium paid while allowing unlimited profit potential.
• Covered Call: Involves holding a long position in the underlying asset while selling call options against it. This strategy generates income through the premium received but caps the potential upside.
• Protective Put: Involves buying put options to protect an existing long position in the underlying asset. If the asset's price drops, the put option provides downside protection.
• Straddle and Strangle: Both strategies involve buying both call and put options simultaneously. Straddles work when significant price movement is expected, while strangles work when traders anticipate moderate price movement.
Conclusion
Options trading offers a dynamic and flexible approach to investing, empowering traders to profit from various market conditions and tailor strategies to their risk tolerance. By understanding the basics of options trading - the types of options, pricing factors, and popular strategies - investors can effectively leverage options as a valuable tool in their financial toolkit. However, it is essential to recognize that options trading involves inherent risks and complexities, and beginners are encouraged to start with a solid understanding of the fundamentals and practice prudent risk management before diving into this exciting financial realm.

#RELIANCE... Looking good 08.08.23#RELIANCE...
Intraday as well as swing trade
All levels given in charts ...
IF good potential seen then we work in options also
if activate then possible a good movement Keep eye on this ...
We take trade only when it activates...
Possible to give good target
TRADING FACTS

FINNIFTY FUTURES - 240MINS TIME FRAMEThe Structure looks good to us, waiting for this instrument to correct and then give us these opportunities as shown on this instrument (Price Chart).
Note: Its my view only and its for educational purpose only. Only who has got knowledge about this strategy, will understand what to be done on this setup. its purely based on my technical analysis only (strategies). we don't focus on the short term moves, we look for only for Bullish or Bearish Impulsive moves on the setups after a good price action is formed as per the strategy. we never get into corrective moves. because it will test our patience and also it will be a bullish or a bearish trap. and try trade the big moves.
we do not get into bullish or bearish traps. We anticipate and get into only big bullish or bearish moves (Impulsive Moves). Just ride the Bullish or Bearish Impulsive Move. Learn & Know the Complete Market Cycle.
Buy Low and Sell High Concept. Buy at Cheaper Price and Sell at Expensive Price.
Keep it simple, keep it Unique.
please keep your comments useful & respectful.
Thanks for your support....
Tradelikemee Academy

SPX Outlook: Week ending 08/114500 remains a key line in the sand.
Above 4500 can test 4525, 4540, 4575 then 4600.
Below 4500 can test 4480, 4460, 4400 then 4360.

Trade Execution Setup Aug 4 - DetailsTrade 2 Entry setup --> Options chart Price Action Entry Setup in detail explanation, This is a continuation of
1) Entry based on 1 min Timeframe price compression breakout, target and SL are marked.
2) In confluence with RSI divergence and Reversal candle priceaction in 5 min adn 15 min timeframe.

W Wayfair Options Ahead of EarningsAnalyzing the options chain and the chart patterns of W Wayfair prior to the earnings report this week,
I would consider purchasing the 80usd strike price in the money Puts with
an expiration date of
2023-9-15, even though the stock is up in the pre-market today.
If these options prove to be profitable prior to the earnings release, I would sell at least half of them.
Looking forward to read your opinion about it.

Banknifty Buy Formation nowTime to Buy Banknifty now and Targets mentioned in chart. Hope you enjoyed previous Trades posted in my profile.

TTE TotalEnergies SE Options Ahead of EarningsAnalyzing the options chain and the chart patterns of PTTE TotalEnergies SE prior to the earnings report this week,
I would consider purchasing the 60usd strike price Puts with
an expiration date of 2023-9-15,
for a premium of approximately $1.80.
If these options prove to be profitable prior to the earnings release, I would sell at least half of them.
Looking forward to read your opinion about it.

AMD breakout expected|31st July 2023Price has come down without touching any supplies. Price has also narrowed so much and price is initially from HTF DZ.

#DEEPAKNTR...looking good 18.05.23#DEEPAKNTR.. ✅▶️
Intraday as well as swing trade
All levels given in charts ...
IF good potential seen then we work in options also
if activate then possible a huge movement Keep eye on this ...
We take trade only when it activates...
Possible to give good target
TRADING FACTS

STBT/SWING BEARISH TRADE CONDITION Refer chart for all level.
Short on hourly close below Friday's low.

#RAIN...looking good from 31.07.23#RAIN...
Intraday as well as swing trade
All levels given in charts ...
IF good potential seen then we work in options also
if activate then possible a good movement Keep eye on this ...
We take trade only when it activates...
Possible to give good target
TRADING FACTS

FUBOTV moves before earnings LONGWith upcoming earnings on August 4th, as shown on the @H chart, FUBO is moving.
The set of three EMAs (35/70/280) show an impending crossover the longest EMA
and a golden cross between the other two has already occurred. The MACD demonstrates
the bullish momentum. The dual time frame RSI has the low/green line crossing the 50
level from well below it and then the high/ black line in the 60 range another confirmation
of bullish trend strength. I can appreciate that other traders are anticipating a bit of
a jump in the event of an earnings beat. I will join that group. The target is the level of
the double top of mid-July. The stop loss is the level of the golden cross of the EMAs.
An identified options trade is the strike of $ 3 expiring 8/11.

SBUX upcoming earnings opportunity LONGSBUX fell going into earnings in early May and continued down all of May then pivoting
into a slow climb on this 2H chart through the lower anchored VWAP bands until the present
where it is about to cross the mean VWAP lines as signaled by an engulfing green bar after a
Doji. The dual time frame RSI lines have both near the 50 levels with the lower in green
slightly above the higher in black. I see SBUX rising in the earning upcoming this week.
The target is the ascending trendline in black at about 104 for a quick 2.5% ROI in 2 days.
I will play this with some call options contracts striking 102 expiring August 11th. I will take
half of them off with a 50% unrealized profit and let the remainder run until 8/9 to avoid
acceleration of time decay.

UBER Technologies Options Ahead of EarningsIf you haven`t sold UBER here:
or reentered here:
Then analyzing the options chain and the chart patterns of UBER Technologies prior to the earnings report this week,
I would consider purchasing the 50usd strike price Calls with
an expiration date of 2023-8-18,
for a premium of approximately $1.66.
If these options prove to be profitable prior to the earnings release, I would sell at least half of them.
Looking forward to read your opinion about it.

MRNA a medical Technology Stock LONG MRNA is a medical technology company. It is in the vaccine sector and competes ( well) with
NVAX and PFE among others. Earnings are upcoming on 8/3 in about a week.
On the 30 minute chart it appears to be in a descending wedge pattern which is typically
a bottoming with a breakout over and beyond the descending trendline. The relative
trend indicator shows the downtrend to be a slow grinding type trend with some minor
corrections along the way. As might be expected the RS lines are low in the indicator's
channel. I see this as a setup for a pre-earnings play with the expectation that MRNA
could breakout above the resistance trend line and move toward the horizontal resistance
of the triple top earlier in mid-July. I see medical stocks as a good alternative to technology
stocks that may be overextended and stressed by the current financial chaos pressuring
the markets. Another approach is a two call options targeting $ 125 expiring 8/11
and running the first until 100% profit or 8/2, the day before the expiration whichever
comes first and letting the other run through earnings into the middle of the following
week at 8/9. I always like to cut these short of expiration by a few days to diminish the
effects of time decay.
