Li Auto Options Ahead Of EarningsLooking at the Li Auto options chain, i would buy the $30 strike price Puts with
2023-1-20 expiration date for about
$4.15 premium.
Looking forward to read your opinion about it.
Optiontrading

AMBA Ambarella, Inc. Options Ahead Of EarningsLooking at the AMBA Ambarella, Inc. options chain ahead of earnings , i would buy the $80 strike price Calls with
2023-1-20 expiration date for about
$5.40 premium.
If the options turn out to be profitable Before the earnings release, i would sell at least 50%.
Looking forward to read your opinion about it.

#TATA POWER - SHORT TERM CALLS #INDUSINDBANK... ✅
INTRADAY/ Short term delivery call as well
All levels given in charts ...
IF good potential seen then we work in options also
if activate then possible a huge movement Keep eye on this ...
We take trade only when it activates...
Possible to give good target

Common Reason for Overt TradingIn this video we try to make you understand the main objective of trading and accept very fast if you are wrong. saving your money (Not making a loss) is also a win for a trader.
#nifty
#priceaction #priceactiontrading #optionanalysis #banknifty #bankniftyprediction
#nifty50 #niftytomorrow #niftyprediction #niftyanalysis #niftyfifty #niftytoday #niftybank #banknifty #bankniftytomorrow #bankniftyprediction #bnkniftytrading #charts #technicalanalysis #crypto #sensex #nse #nseindia #bse #optionsellingstrategy #optionstrading #optionsellingstrategy #optionstrategy #optiontrading #optionsellingstrategy

Counter TradeHow to take counter trade ? in this video we try to make it easy to took a counter trade (Against the trend) and to make quick money from market
#nifty
#priceaction #priceactiontrading #optionanalysis #banknifty #bankniftyprediction
#nifty50 #niftytomorrow #niftyprediction #niftyanalysis #niftyfifty #niftytoday #niftybank #banknifty #bankniftytomorrow #bankniftyprediction #bnkniftytrading #charts #technicalanalysis #crypto #sensex #nse #nseindia #bse #optionsellingstrategy #optionstrading #optionsellingstrategy #optionstrategy #optiontrading #optionsellingstrategy

Trading Setup is very ImportantBest Trading Setup makes money for you in market even you are wrong in Market
#nifty
#priceaction #priceactiontrading #optionanalysis #banknifty #bankniftyprediction
#nifty50 #niftytomorrow #niftyprediction #niftyanalysis #niftyfifty #niftytoday #niftybank #banknifty #bankniftytomorrow #bankniftyprediction #bnkniftytrading #charts #technicalanalysis #crypto #sensex #nse #nseindia #bse #optionsellingstrategy #optionstrading #optionsellingstrategy #optionstrategy #optiontrading #optionsellingstrategy

Bank Nifty Levels & Strategy for 19/Oct/2022Dear traders, I have identified chart levels based on my analysis, major support & resistance levels. Please note that I am not a SEBI registered member. Information shared by me here for educational purpose only. Please don’t trust me or anyone for trading/investment purpose as it may lead to financial losses. Focus on learning, how to fish, trust on your own trading skills and please do consult your financial advisor before trading.
BANK NIFTY
Bullish run continued in Bank Nifty. F&O data clearly indicating that Bank Nifty trend is looking positive. Today, we have noticed heavy short covering in ITM calls and long positions were added in ATM calls. FIIs continued with their buying in F&O. Today FIIs & DIIs have significantly reduced the bearish positions. US market is also trading in green. Shall we look for buy on dips near major support levels if you get good trading setup ????? Yes, I think so. What do you think?????
BANK NIFTY SCORECARD DATED 18/OCT/2022
BANK NIFTY IS UP BY 398 POINTS
Name Price Previous Day Change % Change
Bank Nifty 40319 39920 398.30 1.00%
India VIX 17.45 18.42 -0.97 -5.24%
OPTION STATISTICS BASED ON 20/OCT/2022 EXPIRY DATA
Max OI (Calls) 40500 (Open Interest: 2556675, CE LTP: 56)
Max OI (Puts) 39500 (Open Interest: 2677750, PE LTP: 160.05)
PCR 1.22 (PCR is in buying Zone)
Bank Nifty Calls:
ATM: Long Buildup, OTM:Long Buildup, ITM:Short covering, FAR OTM:Long Buildup
Bank Nifty Puts:
ATM: Short Buildup, OTM:Short Buildup, ITM:Short Buildup, FAR OTM:Long Liquidation

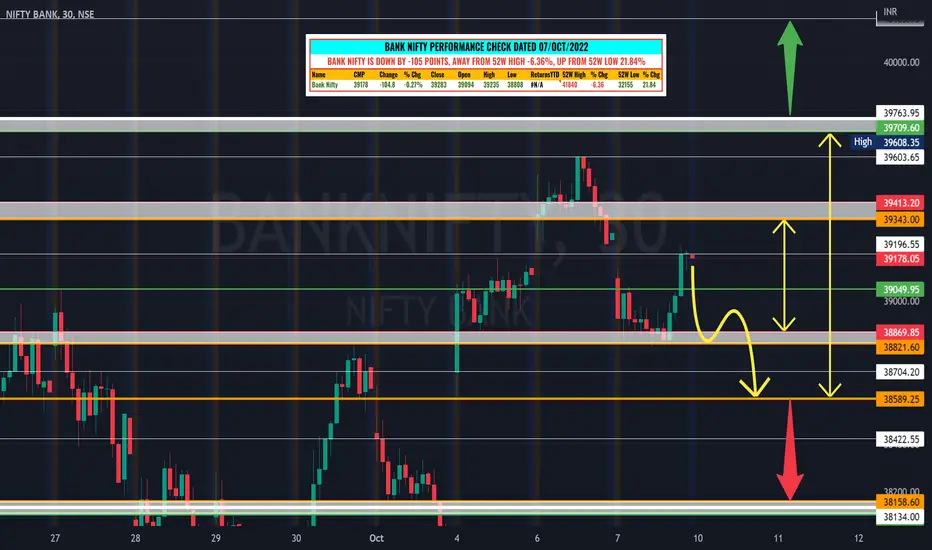
Bank Nifty Levels & Strategy for 10/Oct/2022Dear traders, I have identified chart levels based on my analysis, major support & resistance levels. Please note that I am not a SEBI registered member. Information shared by me here for educational purpose only. Please don’t trust me or anyone for trading/investment purpose as it may lead to financial losses. Focus on learning, how to fish, trust on your own trading skills and please do consult your financial advisor before trading.
BANK NIFTY
Bank Nifty closed almost flat (-105) in red zone. PCR is in bearish zone. FIIs as well as DIIs have added plenty of bearish positions in F&O. US market closed in red. Dow Jones (-630), Nasdaq (-446). We are all set for the gap-down on Monday. Global cues & overall trend has turned negative. Is sell on rise going to be better strategy for Monday trades with strict SL? Yes, I think so, What do your thoughts?
BANK NIFTY SCORECARD DATED 07/OCT/2022
BANK NIFTY IS DOWN BY -105 POINTS
Name Price Previous Day Change % Change
Bank Nifty 39178 39283 -104.80 -0.27%
India VIX 18.81 19.32 -0.50 -2.60%
OPTION STATISTICS BASED ON 13/OCT/2022 EXPIRY DATA
Max OI (Calls) 40000 (Open Interest: 2045875, CE LTP: 324.05)
Max OI (Puts) 39000 (Open Interest: 1792125, PE LTP: 115.35)
PCR 0.84 (PCR is in bearish zone)
Bank Nifty Calls:
ATM: Short Buildup, OTM:Short Buildup, ITM:Short Buildup, FAR OTM:Short Buildup
Bank Nifty Puts:
ATM: Short Buildup, OTM:Short Buildup, ITM:Short covering, FAR OTM:Short Buildup
Please do share your comments. Let us work & win together. Have a very happy, healthy & profitable day ahead!
Nifty 50 Strategy for 4 Oct 2022Nifty 50 Strategy,
16900 above going long for 16993 17102 17156 17243;
16875 below going short for 16858 16801 16661 16475.

Nifty Levels & Strategy for 16/Sep/2022Dear traders, I have identified chart levels based on my analysis, major support & resistance levels. Please note that I am not a SEBI registered member. Information shared by me here for educational purpose only. Please don’t trust me or anyone for trading/investment purpose as it may lead to financial losses. Focus on learning, how to fish, trust on your own trading skills and please do consult your financial advisor before trading.
NIFTY
Nifty is slightly down by -126 points. Today, Nifty has broken down 18K level and could not close above the psychological level. PCR is down from 1.1 (buying zone) to 0.72 (bearish zone). Today’s positive opening has given chance to retail traders for booking profit. Later Nifty slipped below 18K level.
Highest open interest on call side at 18700 (Based on next weekly Sep, 22nd expiry data)
Highest open interest on put side at 16500 (Based on next weekly Sep, 22nd expiry data)
BANK NIFTY
Bank Nifty is down by -196 points. Today was a historical day when Bank Nifty touched new lifetime high. It was dream come true amid several global issues. Bank Nifty was pushed in red due to heavy profit booking & new short positions added by traders. PCR is shifted down from 1.62 (Overbought zone) to 0.87 (bearish zone).
Highest open interest on call side at 41500 (Based on next weekly Sep, 22nd expiry data)
Highest open interest on put side at 38500 (Based on next weekly Sep, 22nd expiry data)
Shall we again start looking for sell on rise opportunities ?????
1. till Nifty is below 18K
2. near major resistance levels
3. near high OI in CE strikes with strict stoploss?
Shall we look for buy on dips opportunity
1. near support level
2. high OI in PE strikes with strict SL?
What do you think? Please do share your comments. Let us work & win together.
Please do review
1. Global cues based on EOD data
2. FIIs/DIIs F&O data analysis prior to finalize your strategy/work plan for tomorrow
Have a very happy, healthy & profitable day ahead!

Is Bank Nifty getting ready for Breakout or Breakdown ??????Dear traders, I have identified chart levels based on my analysis, major support, and resistance levels. Please note that I am not a SEBI registered member. Information shared here for educational purpose. Please don’t trust me or anyone for trading/investment purpose. Focus on learning how to fish, trust your own skills and please do consult your financial advisor before trading.
Is Bank Nifty getting ready for Breakout or Breakdown ??????
Later today, I will share Bank Nifty chart with multiple support & resistance levels.
Please share your strategy & comments. Many thanks

Bank Nifty Levels & Strategy for 05/09/2022Dear traders, I have identified chart levels based on my analysis, major support, and resistance levels. Please note that I am not a SEBI registered member. Information shared here for educational purpose. Please don’t trust me or anyone for trading/investment purpose. Focus on learning how to fish, trust your own skills and please do consult your financial advisor before trading.
BANK NIFTY
Bank Nifty is up by 120 points. Bank Nifty remained sideways for most of time. PCR shifted up from 0.84 ( bearish zone) to 0.91 ( bearish zone). Call side OI is daily shifting up & down. Let us see when 38000 will be challenged amid ongoing global issues.
Highest open interest on call side at 39500 (Shifted down from 40000 to 39500)
Highest open interest on put side at 38000 (Remained at same level)
NIFTY
Nifty closed flat & closed by just -3.35 points. PCR shifted from 0.89 ( bearish zone) to 0.80 ( bearish zone). Trading in Nifty was easy & predictable. Nifty has followed the technical setup and gave opportunities to bulls as well bears and finally closed flat.
Highest open interest on call side at 18000 (Remained at same level)
Highest open interest on put side at 17000 (Remained at same level)
Shall we continue look for sell on rise opportunities near major resistance levels with strict SL? Or
Shall we look for buy on dips opportunities near major support levels till it is trading in a range?
Please do share your comments. Have a very happy, healthy & profitable day ahead!

$LCID: Short it to $0...cash burning like there's no tomorrow.I'm shorting $LCID here, nice weekly setup, downside targets are $9-10, and up to $1-2 by December 2nd or sooner. I'm long puts to ride this move, since the stock is hard to borrow.
Worth a shot, you could also consider a portfolio where you long the relatively safe EV names vs shorts in EV startups that are burning cash and unprofitable, which will likely continue to pay off (long $TSLA, $F, $RIVN maybe, vs shorts in $NKLA, $LCID, $ARVL, $FFIE, $FSR, etc)

NIFTY STUDY (Trend Reversal?)After showing a trend of Lower Lows & Lower Highs market recently showed a trend of Higher Lows & Higher Highs.
So if the marker breaks the previous swing low, we can expect trend reversal.
If this happens we can look for sell on rise.
COMMENT YOUR VIEWS
Disclaimer: Above is for educational purposes and not buy/sell advice.
SEBI Unregistered

Nifty levels for 26/08/2022Dear traders, I have identified chart levels based on my analysis, major support, and resistance levels. Please note that I am not a SEBI registered member. Information shared here for educational purpose. Please consult your financial advisor before trading.
NIFTY
Nifty is down by -82.5 points. Nifty closed near day’s low, below 20 EMA, VWAP levels. Once again, we had a highly volatile day. PCR shifted below from 0.84 to 0.76 which is still in bearish zone.
Highest open interest on call side at 18500 (Shifted up from 18000 to 18500)
Highest open interest on put side at 17000 (Remained same at 17000)
BANK NIFTY
Bank Nifty is down by -88 points. Bank Nifty closed near day’s low, below 20 EMA, VWAP levels. Once again, we had a highly volatile day. PCR shifted down from 1.08 to 0.66 which is now back in bearish zone.
Highest open interest on call side at 39500 (Shifted down from 40000 to 39500)
Highest open interest on put side at 39000 (Shifted up from 38000 to 39000) – BULLS GOT TRAPPED
Shall we expect trending market tomorrow after Jackson Hole meeting outcome?
Please do share your comments. Have a happy, healthy & profitable day ahead!

Nifty Levels for 24/08/2022Dear traders, I have identified chart levels based on my analysis, major support, and resistance levels. Please note that I am not a SEBI registered member. Information shared here for educational purpose. Please consult your financial advisor before trading.
NIFTY
Nifty is up by 87 points. Nifty closed above 20 EMA , VWAP level near day’s high. We had a highly volatile day. PCR shifted down from 0.60 to 0.83 which is still in bearish zone.
Highest open interest on call side at 18000 (Same as yesterday)
Highest open interest on put side at 17500 (Shifted up from 17000)
FIIs, DIIs & OTHER PARTICIPANTS DERIVATIVE DATA ANALYSIS:
FIIs ( Bullish ):
FII bought in cash market for 563 crores and bought in derivative market contract for 6510 crores (please do continue to read about whether they bought long positions or short positions). FIIs reduced their index & stock future long contracts & added short positions in index & stock future contracts. FIIs took long positions in index call as put contracts & reduced stock call & put contracts.
DIIs (Mild Bullish ):
DII sold in cash for -215.2 Crores. DIIs have slightly added new positions in Index & stock future contracts. Heavily reduced positions in options contracts.
PRO ( Bearish ):
Pro traders have added short index & stock future contracts. Reduced option contracts in index & stock call contracts. Added option contacts in index & stock put contracts.
CLIENT ( Bearish ):
Retail/ HNI added index & stock future contracts. Significantly reduced their index & stock call option contracts. Added index put contacts & reduced stock put long & short contracts.
Shall we continue to expect high volatility in next few days?
Shall we look for buy on dips or sell on rise opportunities?
Please do share your comments. Have a happy, healthy & profitable day ahead!

Nifty Index Levels for 24/08/2022Dear traders, I have identified chart levels based on my analysis, major support, and resistance levels. Please note that I am not a SEBI registered member. Information shared here for educational purpose. Please consult your financial advisor before trading.
NIFTY
Nifty is up by 87 points. Nifty closed above 20 EMA, VWAP level near day’s high. We had a highly volatile day. PCR shifted down from 0.60 to 0.83 which is still in bearish zone.
Highest open interest on call side at 18000 (Same as yesterday)
Highest open interest on put side at 17500 (Shifted up from 17000)
FIIs, DIIs & OTHER PARTICIPANTS DERIVATIVE DATA ANALYSIS:
FIIs (Bullish):
FII bought in cash market for 563 crores and bought in derivative market contract for 6510 crores (please do continue to read about whether they bought long positions or short positions). FIIs reduced their index & stock future long contracts & added short positions in index & stock future contracts. FIIs took long positions in index call as put contracts & reduced stock call & put contracts.
DIIs (Mild Bullish):
DII sold in cash for -215.2 Crores. DIIs have slightly added new positions in Index & stock future contracts. Heavily reduced positions in options contracts.
PRO (Bearish):
Pro traders have added short index & stock future contracts. Reduced option contracts in index & stock call contracts. Added option contacts in index & stock put contracts.
CLIENT (Bearish):
Retail/HNI added index & stock future contracts. Significantly reduced their index & stock call option contracts. Added index put contacts & reduced stock put long & short contracts.
Shall we continue to expect high volatility in next few days?
Shall we look for buy on dips or sell on rise opportunities?
Please do share your comments. Have a happy, healthy & profitable day ahead!
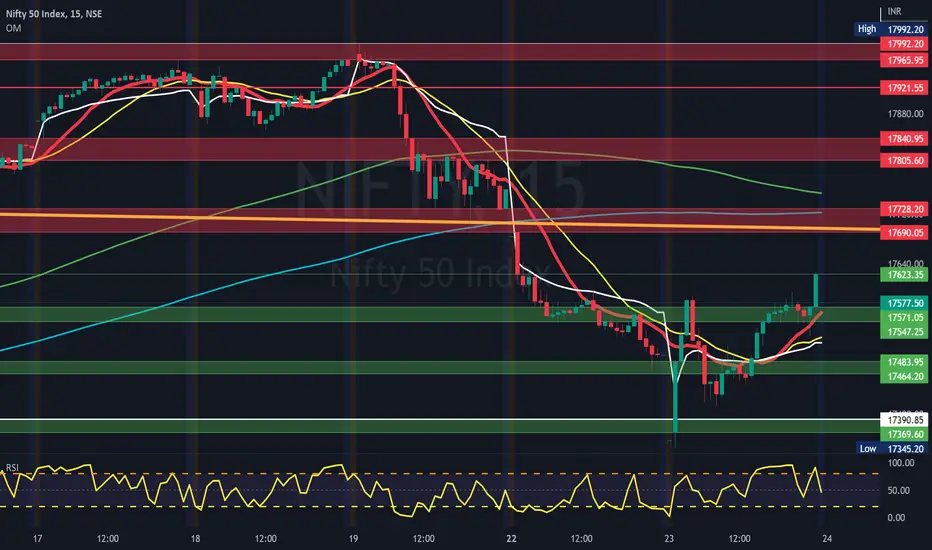
Nifty Index Levels for 23/08/2022Dear traders, I have identified chart levels based on my analysis, major support and resistance levels. Please note that I am not a SEBI registered member. Information shared for educational purpose. Please do take trade based on your own analysis and risk-taking abilities. Never ever worked with fixed mindset. Any news/result data may change the direction of the trend instantly. Focus on learning so you can take correct/better decision based on your analytical skills. PLEASE NOTE THAT NO ONE CAN BE 100% CORRECT. OVERALL, WE SHOULD CONTINUE TO LEARN & BE ABLE TO CLOSE IN PROFIT EVEN IF WE ARE 50% CORRECT WITH RISK REWARD RATIO 1:2
Indix VIX further jumped up by 4.12% from 18.29 to 19.04. Dow Jones is down 494 points and Nasdaq is down by 287 points at this point of time. Please do check closing data for tomorrow's trading reference. US DOLLAR INDEX has up beyond 108 level and continuous weakness in Rupee is certainly not a good sign for Indian market.
Nifty closed below 20 EMA and VWAP level. We had a highly volatile day. PCR shifted down to 0.6 which is clearly in bearish zone now. Today also selling was quite sharp .
Highest open interest on call side at 18000.
Highest open interest on put side at 17000.
FIIs, DIIs & OTHER PARTICIPANTS DERIVATIVE DATA ANALYSIS:
FIIs ( Bearish ):
FII sold in cash market for -454 crores and bought in derivative market contract for 3319 crores (please do continue to read about whether they bought calls to add new long positions or bought puts to add more short positions in the system). FIIs significantly reduced their long as well as short contract in Index future and added short stock future contracts. FIIs took long positions in calls. FIIs significantly added two times PUT long positions in Index compare to short positions. FIIs are heavily short in stock futures and hedged their positions using call & put options.
DIIs (Mild Bullish ):
DII sold in cash for -85 Crores. DIIs have reduced their positions in Index & future contracts.
PRO ( Bearish ):
Pro traders have reduced their long index & stock future contracts and heavily wrote call options in index & stocks.
CLIENT ( Bullish ):
Retail traders significantly reduced their long future contract positions in index & stocks. Heavily wrote call options in index, bought puts & calls hedge their position
Overall, shall we continue to expect high volatility for next few days?
Shall we look for sell on rise opportunities based negative cues? or
Is market is taking few steps back for bigger move towards all time high?
We are getting close to important support level . Please do watch it carefully to avoid getting into bears trap at lower levels & bulls trap on bounces.
PLEASE DO SHARE YOUR FEEDBACKS AS WELL AND TRADE SAFELY & CAREFULLY WITH STRICT SL (STOP LOSS) & MAXIMISE YOUR PROFIT USING TRAILING SL.
Have a happy, healthy & profitable day ahead!

Bank Nifty Index Levels for 23/08/2022Dear traders, I have identified chart levels based on my analysis, major support and resistance levels. Please note that I am not a SEBI registered member. Information shared for educational purpose. Please do take trade based on your own analysis and risk-taking abilities. Never ever worked with fixed mindset. Any news/result data may change the direction of the trend instantly. Focus on learning so you can take correct/better decision based on your analytical skills. PLEASE NOTE THAT NO ONE CAN BE 100% CORRECT. OVERALL, WE SHOULD CONTINUE TO LEARN & BE ABLE TO CLOSE IN PROFIT EVEN IF WE ARE 50% CORRECT WITH RISK REWARD RATIO 1:2
Indix VIX further jumped up by 4.12% from 18.29 to 19.04. Dow Jones is down 494 points and Nasdaq is down by 287 points at this point of time. Please do check closing data for tomorrow's trading reference. US DOLLAR INDEX has up beyond 108 level and continuous weakness in Rupee is certainly not a good sign for Banking sector as a whole.
Bank Nifty closed below 20 EMA and VWAP level. We had a highly volatile day. PCR shifted down from 0.67 to 0.61 which is clearly in bearish zone now. Today also selling was quite sharp .
Highest open interest on call side at 39500.
Highest open interest on put side at 37000.
FIIs, DIIs & OTHER PARTICIPANTS DERIVATIVE DATA ANALYSIS:
FIIs (Bearish):
FII sold in cash market for -454 crores and bought in derivative market contract for 3319 crores (please do continue to read about whether they bought calls to add new long positions or bought puts to add more short positions in the system). FIIs significantly reduced their long as well as short contract in Index future and added short stock future contracts. FIIs took long positions in calls. FIIs significantly added two times PUT long positions in Index compare to short positions. FIIs are heavily short in stock futures and hedged their positions using call & put options.
DIIs (Mild Bullish):
DII sold in cash for -85 Crores. DIIs have reduced their positions in Index & future contracts.
PRO (Bearish):
Pro traders have reduced their long index & stock future contracts and heavily wrote call options in index & stocks.
CLIENT (Bullish):
Retail traders significantly reduced their long future contract positions in index & stocks. Heavily wrote call options in index, bought puts & calls hedge their position
Overall, shall we continue expect high volatility in coming week?
Shall we look for sell on rise opportunities based negative cues? or
Is market is taking few steps back for bigger move towards all time high?
We are getting close to important support level. Please do watch it carefully to avoid getting into bears trap & bulls trap in bounces.
PLEASE DO SHARE YOUR FEEDBACKS AS WELL AND TRADE SAFELY & CAREFULLY WITH STRICT SL (STOP LOSS) & MAXIMISE YOUR PROFIT USING TRAILING SL.
Have a happy, healthy & profitable day ahead!

AMD Advanced Micro Devices Options Ahead Of EarningsLooking at the AMD Advanced Micro Devices options chain, i would buy the $110 calls with
2022-9-16 expiration date for about
$1.54 premium.
Looking forward to read your opinion about it.

Nifty 50, 15th July 2022. Analysis for tomorrow. Updated levels for tomorrow in 15 mins time frame. Nifty has formed a Channel Pattern on 15 minutes chart and 1 hour chart also.

Banknifty 15th July 2022. Analysis For Tomorrow.Banknifty, 15th July 2022 updated chart levels for tomorrow in 15 min timeframe.

NIFTY Options 13 July 2022Entered after formation of Evening Star at resistance in 5min timeframe. Exited at support zone.
50 points captured in Nifty 16100 PE from 75 to 125.
