OP trading inside an ascending channelOP trading inside an ascending channel
Keep eyes on it, along with BTC movement!
OPUSD

#OP long scalp#OP forming an ascending triangle on H4, once it clears the resistance zone here, next ideal zone would be $2.41 levels.


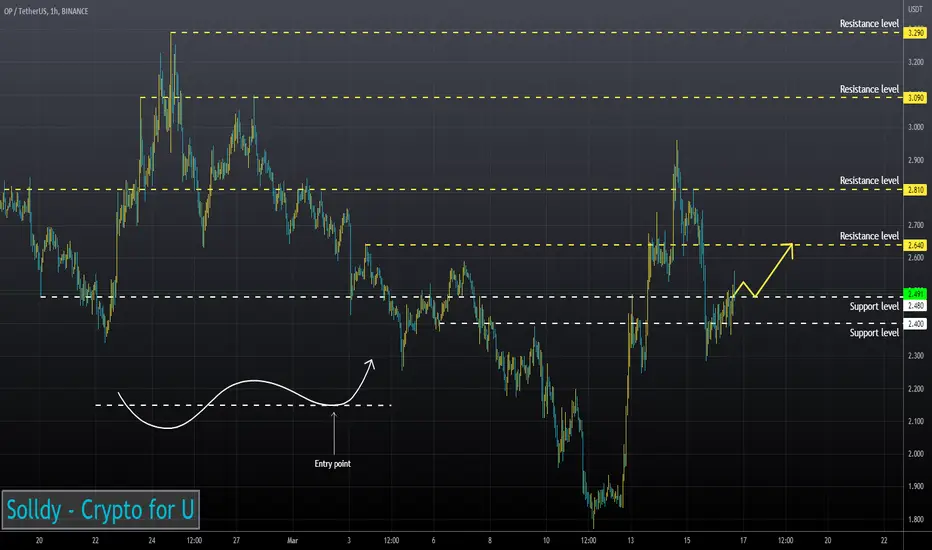
OP ready to fly!After quite some downtrend and getting stuck in a triangle I expect the triangle to break downward which will most probably be a false breakout since it's an area of liquidity and start flying from the area that I highlighted which happens to be the entry price for the breakout signal!
NFA

OPUSD ❕ oversoldRSI chart is in the oversold area (4H, 1H and 30m TFs)
TD Sequential has formed a reversal signal upwards (1H TF)
I expect a rebound after fixing in the channel.

Whether it can rise along the rising channel is the keyHello?
Traders, welcome.
If you "Follow", you can always get new information quickly.
Please also click "Boost".
Have a good day.
-------------------------------------
(OPUSDT chart)
The HA-High indicator on the 1W chart formed at the 2.498 point.
Therefore, if it fails to rise above 2.498, it may lead to further declines, so we need to think about countermeasures.
However, since the MS-Signal indicator of the 1W chart is passing around 2.045, you need to check whether it is supported around the 2nd section of 1.828-2.045.
The tertiary range, 0.919-1.129, is a strong support and resistance range.
It is currently in a downtrend from the uptrend channel shown on the 1D chart.
Therefore, I think it is becoming important whether it can rise above 2.498.
-------------------------------------------------- -------------------------------------------
** All descriptions are for reference only and do not guarantee profit or loss in investment.
** Even if you know other people's know-how, it takes a considerable period of time to make it your own.
** This is a chart created with my know-how.
---------------------------------

OPUSD ❕ lower boundary of the channelOP moves over liquidity.
TD Sequential has formed a reversal signal upwards (1H TF)
The asset will reverse if it stays in the channel.

OP/USDTI'll short OP here if it goes under $2.51.
As long as the price is under the MO, the trade is valid and thats where the stops are.
Main target is around $1.
Follow, like the idea and feel free to leave a comment.
Check out other ideas if you like this one.

The OP will continue to fallHi, dear traders. how are you ? Today we have a viewpoint to SELL/SHORT the OP symbol.
For risk management, please don't forget stop loss and capital management
When we reach the first target, save some profit and then change the stop to entry
Comment if you have any questions
Thank You

Optimism(OP) will lose 💣at least➖12%💣of its value!!!Better to know first what is the Optmisim(OP) project.
What Is Optimism (OP)❗️❓
Optimism (OP) is a layer-two blockchain on top of Ethereum. Optimism benefits from the security of the Ethereum mainnet and helps scale the Ethereum ecosystem by using optimistic rollups. That means transactions are trustlessly recorded on Optimism but ultimately secured on Ethereum.
Optimism is one of the biggest scaling solutions for Ethereum with over $500 million in TVL. It is home to 97 protocols, the biggest being Synthetix (SNX), a derivatives exchange, Uniswap (UNI), a DEX, and Velodrome (VELO), an AMM. Users can begin their journey on Optimism by adding the chain on their Metamask and bridging tokens like ETH to the L2. On May 31, 2022, Optimism conducted a highly anticipated airdrop of its OP token.
----------------------------------------------------------------------------------------------------------------------------------------------------------------------------------
Optimis lost its support line after accepting defeat from the resistance line.
While losing the support line, it managed to form a descending channel, and now the lower line of this channel is also broken by the breakout candle.
I expect Optimism to drop to at least the 🟢support zone($2.24-$1.99)🟢.
Optimism Analyze ( OPUSDT ), 1-hour Time frame ⏰.
Do not forget to put Stop loss for your positions (For every position you want to open).
Please follow your strategy, this is just my idea, and I will gladly see your ideas in this post.
Please do not forget the ✅' like '✅ button 🙏😊 & Share it with your friends; thanks, and Trade safe.

OPUSD ❕ strong supportTrading volumes show a lack of interest in falling prices.
TD Sequential has formed a reversal signal upwards (1H TF)
OP has successfully fixed above 200EMA (1H TF)
The asset will rebound successfully after holding support.
OPUSDT in a downtrend now (50 % profit)OPUSDT looks like it's ready to dump .
The price broke the upsloping support.
We may see a bounce and the rejection from the line which should be acting as a resistance now. However, the dump without the bounce is also likely.
RSI in a downtrend. Hard to imagine OPUSDT carrying on the uptrend in a short-term.
Take profit levels and final target are shown on the chart. Over 52% to be made here.
If the price reclaims the upsloping support, it would be a clear invalidation of our thesis.
Good luck

OP LONG SETUPHi, dear traders. how are you ? Today we have a viewpoint to BUY/LONG the OP symbol.
For risk management, please don't forget stop loss and capital management
When we reach the first target, save some profit and then change the stop to entry
Comment if you have any questions
Thank You

OPUSD ❕ broke up the descending channelThe RSI chart is moving in a bullish zone (1H and 30m TFs)
Price has broken upward through 200EMA on the 30m Timeframe.
The token will continue to rise if support is held.

OP is going to increase soon!OP/USDT broke out of Ascending Triangle formation on 2D Chart and printed a Bullish Pennant above its neckline
More upside if we break out of Bullish Pennant
_ _ _ _ _ _ _ _ _ _ _ _ _ _ _ _ _ _ _ _ _ _ _ _ _ _ _ _ _ _ _ _ _
🌍Thank you for seeing idea .
Have a nice day and Good luck


Optimism (OP) formed bullish Gartley for upto 33.50% pumpHi dear friends, hope you are well and welcome to the new trade setup of Optimism (OP) with US Dollar pair.
Previously we caught a nice trade of OP as below:
Now on a daily time frame, OP has formed another bullish Gartley move for another price reversal.
Note: Above idea is for educational purpose only. It is advised to diversify and strictly follow the stop loss, and don't get stuck with trade

Rejected 1-Hour Order Blocks and Broke Market StructureMy target is above the 1-hour bullish order block in green near the daily S/R level.
There seems to be confluence there with the trend line meeting as well.
Like MAGIC, I was too early with my first call a couple days ago.
Patience I must learn.

OP LONG SETUPHi, dear traders. how are you ? Today we have a viewpoint to BUY/LONG the OP symbol.
For risk management, please don't forget stop loss and capital management
When we reach the first target, save some profit and then change the stop to entry
Comment if you have any questions
Thank You

OP - Similar signs to BTCWas I wrong about OP back in December? Yep. I sure was. I'm not afraid to admit it, either. Nobody is right 100% of the time and if they claim to be, they're lying to you.
Alright, now that we have that behind us, lets look at OP from a purely tecnicaly perspective. I'm going to focus on the wavemaster and the momentum indicators and check the confluence they have with each other here on this 4h timeframe.
The red eyes on the chart are displayed when buy or sell signals formed on both indicators. The most recent orange eye happened to occur when the wavemaster indicator signaled a sell, but the momentum indicator showed that we weren't at the top of the momentum channel (not displayed).
We're also starting to see some signs of bearish divergence on these higher timeframes and we're also starting to see patterns of higher highs and higher lows with some compression evidence as well. I'd rather wait to see how the formation breaks vs trying to just simply short here and hope for the beest.
If you tried to short back in December, for instance, and had no risk management, your face got ripped off completely. At least exit with some dignity and know when you're wrong. Leave the asset and move on to something else if you're wrong. You can always come back and revisit another day which is exactly what I am doing with OP now. I walked away, let it go nuts, and now I'm back watching the formation to see what is coming next.
I'll continue to wait. The formation we're in typically resolves down, but we'll have to see what BTC decides to do and see if alts follow suit. Pay attention to USDT.D and BTC.D on higher timeframes. They'll give you the first clue as to what the market wants to do.

OPUSD ❕ above the strong supportThe price chart has fixed above 50EMA (4H TF)
I believe that OP can continue to rise after the fixation above the support.

OPUSD ❕ correctionThe OP successfully worked its way up after the wedge.
The price reversed from the resistance level.
I think the token will continue decreasing after it will fix under the support.

OP LONG SETUPHi, dear traders. how are you ? Today we have a viewpoint to BUY/LONG the OP symbol.
For risk management, please don't forget stop loss and capital management
When we reach the first target, save some profit and then change the stop to entry
Comment if you have any questions
Thank You
