OPUSDT OP USDT
As for us op, we notice that we have a right shoulder, a head, and a left shoulder, so I see BINANCE:OPUSDT that all goals have been achieved.
Greetings
OPUSDT

OP long
$OP broke through the descending trendline. Bullish movement to resistance level at 1.82$ is possible.

OPUSD | Continuation of the countertrendHello everyone, I wrote a new idea for you. I think it's easy to like and subscribe to the channel, thanks😉
📌The asset continues to move in a downtrend, the countertrend that you see on the chart is a strong resistance
📌 The price bounces again and again from the countertrend, double lowering its local lows.
📌My expectation is that OP will show good growth soon, but first you need to find a safer entry point.
📌I think the entry from the trend line that starts in July will be the optimal entry point. Then you need to wait for a rebound to the trend line and in this zone ($1.1) take a long position

Buying idea for OP/USDT Hi , I'm bullish on op/usdt from these targets are following
Entry1 - 0.96
Entry2- 0.81
Entry3 -0.70
Please buy into parts
If you like my idea please like , thanks

OPUSDT|Coin Review| A trade from a trend line.Hello trader Today I prepared a new idea for you. Like and subscribe to the channel there is a lot of useful information✅
Friends, I have prepared an interesting OP trade for you. All attention is on the countertrend one.
Locally, the asset has been in a downtrend for 30 days, which can be seen from the local countertrend double, which was broken not so long ago and is now a support zone.
I think we will be able to see next week a retest of the double countertrend in the zone ($1.50) from there will be my entry point.
While I'm waiting for the market correction on Monday, and there I will act according to the situation, I have placed orders to buy $1.50 in advance | 1.35$| 1.20$|
Guys this is not financial advice just sharing my thoughts on a chart!

Op/USDT Long📈Opusdt long breakout
All conditions for long confirmed
P.S.THIS IS NOT A FINANCIAL ADVICE

whait until broke upper line OP/usdtwhait until broke upper line OP/usdt i will gain good for short moment

OP/USDT LongOP/USDT Long with 4 TPs on the chart, always take some profits on TP1, and set your SL on entry or above it after taking some profits .

$OPUSDT UPDATE!!!Hi Snipers,
Please refer to the recording for the next price levels and scenarios.
Thanks
MS

OPUSDTHello Crypto Lovers,
Mars Signals team wishes you high profits.
This is a 4-hour-time frame analysis for OPUSDT
Here we have R1 that used to be a support line. S3 used to be a long-term resistance line. And S1 and S2 are our support lines which both represent the support of the price at some points . At the present, we have the price fluctuating over S1 and we expect the price will fall to this line as the past and there we will be two options. Either we receive some confirmation candles to rise and the price will rise to R1 or higher. Or it may happen that the price loses the support at S1 and will face a decline to S2.
Warning: This is just a suggestion and we do not guarantee profits. We advise you to analyze the chart before opening any positions.
Wish you luck

OPUSDT there is a sign of quick crash in alt coins .
the red channel is the price path and trend of this channel could be the future trend . by the way breaking out from red channel is the sign of new up trend correction . 4 sep is a time pivot

These 3 Microcaps are RALLYING Now 🚀 Hi Traders, Investors and Speculators 📉📈
Ev here. Been trading crypto since 2017 and later got into stocks. I have 3 board exams on financial markets and studied economics from a top tier university for a year. Daytime job - Math Teacher. 👩🏫
Here's a look at 3 altcoins that are surprisingly bullish while the rest of the market is trading bearish - WNXMUSDT , OPUSDT , BONDUSDT . Note that these are all fairly new coins and microcap coins, therefore your risk significantly increases when you participate in trading these coins. However, it is also true that diversity significantly decreases your risk. So take a look at these 3 microcap altcoins that are busy making gains whilst the rest of the markets are trading lower.
I hope you enjoyed this post today! Please give us a thumbs up 👌
_________________
👀 Follow us here on TradingView for daily updates and trade ideas on crypto , stocks and commodities 💎
👍Hit like & Follow 🔔
We thank you for your support !
CryptoCheck

OPUSDT - Another 12% Pump Possible 🎯Hi Traders, Investors and Speculators 📉📈
Ev here. Been trading crypto since 2017 and later got into stocks. I have 3 board exams on financial markets and studied economics from a top tier university for a year. Daytime job - Math Teacher. 👩🏫
A quick video analysis on OPUSDT - and possible short term price action by using two technical indicators together; the Phoenix ascending and Fibonacci Bollinger Bands.
The best bet in terms of risk management would be to take most of your profits now if you have a lower entry, and leave the last for the possibility of another 12% increase from this point.
Interested in a potential bounce zone for Bitcoin? See this idea here 👀
Pepe fan? This one's for YOU 👀
I hope you enjoyed this post today! Please give us a thumbs up 👌
_________________
👀 Follow us here on TradingView for daily updates and trade ideas on crypto , stocks and commodities 💎
👍Hit like & Follow 🔔
We thank you for your support !
CryptoCheck

Trading Idea for OPUSDTThis is educational trading idea not a financial advice. I will enter trade when hourly candle close above the parallel range .

OP broke out falling wedge#OP/USDT
$OP broke out from upper line of falling wedge pattern.
🐮 holding above the broken line can increase price to resistance zone around $1.3 and if success to break out from this resistance it will continue its upward move toward resistance zone around $1.8.

OPUSDT Prediction (8/27/22)I guess we are heading to 0.8 to 0.6 by this week.
Please note that this is my own research profits are amplified, but so are losses.
Overall, I suggest to open short positions only as EMA 50 tells us., I do not recommend long for now, high risk.

Op/USDT In Falling Wedge and Range [not so OP right now] Opusdt is in a Falling Wedge and in a range
Opusdt broke the support now we can see resistance from the previous support and support from the previous resistance and all these in a range inside of the Falling Wedge Pattern
After breakout we can see significant movement in opusdt
If we breakout upside than we have Falling Wedge Pattern confirmation but
If we breakout downside than we have Head&Shoulder Pattern Confirmation
P.S.THIS IS NOT A FINANCIAL ADVICE


OP / USDT LONG hello traders
The price still has not reached the sellers area
And if we analyze the correction waves, we find that it remains an ascending wave to complete the correction
There is a strong support level
Therefore, there is an opportunity to buy from the support level to target the sellers' area

OPUSDT 30M LONGOP is forming a bullish triangle. Break the above trendline the price will go up towards 1.58 level.
Buy: 1.17 or break above the trendline (To be safe entry)
Sell: 1.35-1.45-1.55
S/L: Candle close below 1.07
Resistance level: 1.37-1.49-1.58
Trade safe!!!!


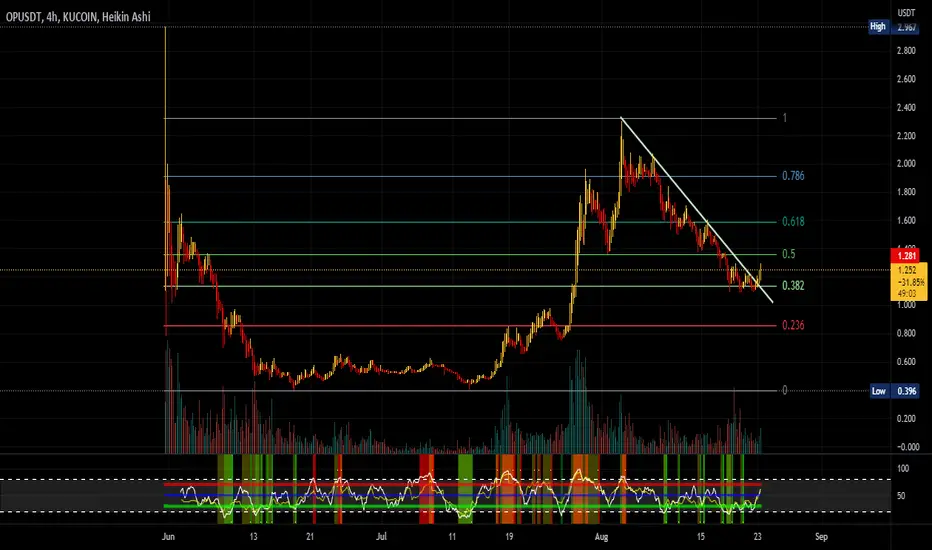
OP broke trend up, possible long position available!The chart is fairly straight forward, ive been waiting for this trend line to break for quite some time now!
Its finally broken above the trend and retested on lower TF and looks to be holding some strong momentum.
I took a LONG position when it broke the level and will be aiming for the .5fib for TP1(to be safe), and the 618fib TP2, and as far as the 786fib for TP3.
OPUSDT has formed a bullish pattern at the support zoneOPUSDT has formed a bullish pattern at the support zone. The price wasn't able to break below the support zone and there is a high possibility that the price goes up after the consolidation.
💎 OPUSDT
🔵 Entry zone 1.176- 1.333
🟢 TP1 1.497
🟢 TP2 1.756
🟢 TP3 2.384
🔴 SL 0.929
Good Luck 🎲
