OPUSDT Update
Symbol: OP/USDT
Timeframe: Daily
Chart Analysis:
The price is currently approaching a key resistance zone at around 0.673, as seen in the chart. A descending trendline from May to June has been acting as resistance. The price has recently made a strong move towards this resistance zone, showing a potential breakout pattern.
If the price successfully breaks above the 0.673 resistance, we could see a bullish continuation towards the next resistance levels, potentially up to 0.700 or higher. The breakout would suggest a reversal of the prior downtrend.
Key Levels:
* Resistance: 0.673 (current resistance zone)
* Support: 0.600 (lower support area)
Trade Strategy:
1. Long Entry: Consider entering a long position if the price breaks above the 0.673 resistance with strong volume.
2. Target: A reasonable target could be the 0.700 region. Keep an eye on price action as it approaches this level.
3. Stop Loss: Place a stop loss below the 0.600 support to manage risk in case of a failed breakout.
Risk-Reward: A potential reward-to-risk ratio of 2:1 or better, depending on entry and exit points.
Conclusion:
Monitor the price closely for a breakout above the 0.673 level. If it breaks and sustains, a bullish move could follow. Watch for volume confirmation and market momentum to gauge the strength of the breakout.
OPUSDTPERP

OPUSDT Forming Descending ChannelOPUSDT is showing an impressive technical setup that has caught the attention of many crypto traders recently. The chart reflects a well-formed descending channel, which is a classic bullish reversal pattern when broken to the upside. Currently, the price action is testing the upper boundary of this channel with increasing buying pressure, signaling that a potential breakout could be on the horizon. A successful breakout here, supported by good volume, could trigger a strong rally in the coming sessions.
The volume profile for OPUSDT is encouraging, as it suggests that more investors are accumulating positions in anticipation of this move. This aligns with the optimistic sentiment in the broader crypto market, where traders are actively seeking altcoins with high potential upside. With an expected gain of around 80% to 90%+, OPUSDT offers an attractive risk-to-reward ratio, especially for those who prefer swing trades and short-term position trades in trending altcoins.
One key factor to watch is whether OPUSDT can sustain momentum above the descending channel’s resistance line. If volume remains strong and the breakout confirms on higher timeframes like the daily or weekly chart, this could attract further interest from both retail and institutional traders. Such a move often sparks a chain reaction of buying, as traders look to ride the trend to its projected target zone.
Overall, the combination of a textbook pattern, healthy volume, and increasing investor interest makes OPUSDT one to watch closely. Keep it on your radar for a possible breakout play with significant upside potential. As always, manage your risk properly and wait for a confirmed breakout before entering any position.
✅ Show your support by hitting the like button and
✅ Leaving a comment below! (What is You opinion about this Coin)
Your feedback and engagement keep me inspired to share more insightful market analysis with you!


OP/USDT Weekly Reversal Zone: Strong Bounce ExpectedThe OP/USDT pair is currently showing strong signs of a potential trend reversal from a major long-term demand zone.
📊 Timeframe: 1W (Weekly)
🟨 Key Support Zone: 0.396 – 0.542 USDT
The price has revisited a historically strong support area that previously served as an accumulation zone since mid-2022. The recent bounce from this level reinforces the likelihood of a bullish reversal.
📈 Upside Targets (Resistance Levels):
1. Minor Resistances:
0.699
0.844
2. Mid-Term Target:
1.190 (key breakout confirmation level)
3. Long-Term Bullish Targets:
2.168
2.400
2.700
2.991
3.725
4.020
4.538
4.865 (Previous major high)
🛡️ Critical Demand Zone:
As long as price holds above the 0.396–0.542 range, bullish structure remains intact. A breakdown below this range could invalidate the setup.
🔄 Outlook:
The chart pattern suggests the formation of a higher low and a potential breakout in stages, supported by volume and positive sentiment. Watch the 0.699 and 0.844 levels for initial confirmation of buyer strength.
📌 Note:
This setup offers an attractive risk-reward ratio for mid to long-term traders watching for a trend reversal.

24 June nifty breakout & breakdown levels 🔺 Bullish (Call Option / CE) Strategy:
✅ Buy CE (Call Option) when:
Above 24,710 → Entry for bullish trade
"Above 10m hold CE by buy level"
Above 24,870 → Stronger confirmation
"Above Opening S1 10M Hold CE By level"
Above 25,020 → Positive trade view
"Above 10M hold positive trade view"
Above 25,130 → Safer CE entry zone
"Above 10M hold CE by entry level"
Above 25,233 → Closing shot level
"Above 10M Closing Shot cover level"
🔻 Bearish (Put Option / PE) Strategy:
✅ Buy PE (Put Option) when:
Below 24,710 → Entry for bearish trade
"Below 10m hold PE By level"
Below 24,870 → Bearish confirmation
"Below Opening R1 10M Hold PE By level"
Below 25,020 → Negative trade view
"Below 10M hold nigeative trade view"
Below 25,130 → Risky PE zone
"Below 10M hold PE By Risky Zone"
Below 25,233 → Safer PE Zone
"Below 10M hold PE By Safe Zone"

#OP/USDT#OP
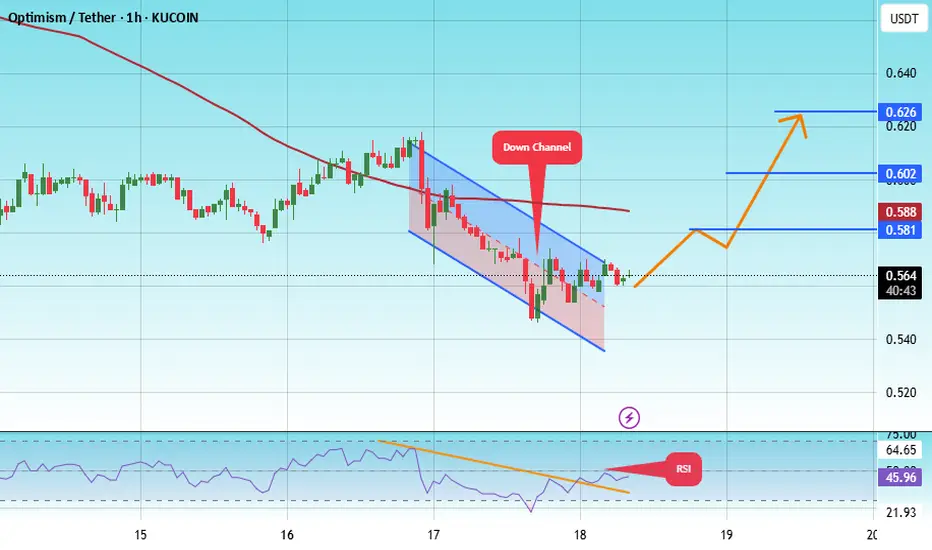
The price is moving within a descending channel on the 1-hour frame, adhering well to it, and is heading toward a strong breakout and retest.
We are experiencing a rebound from the lower boundary of the descending channel. This support is at 0.544.
We have a downtrend on the RSI indicator that is about to be broken and retested, supporting the upward trend.
We are heading toward stability above the 100 moving average.
Entry price: 0.564
First target: 0.581
Second target: 0.602
Third target: 0.626
#OP/USDT#OP
The price is moving within a descending channel on the 1-hour frame and is expected to break and continue upward.
We have a trend to stabilize above the 100 moving average once again.
We have a downtrend on the RSI indicator that supports the upward move with a breakout.
We have a support area at the lower limit of the channel at 0.600, acting as strong support from which the price can rebound.
Entry price: 0.616
First target: 0.630
Second target: 0.641
Third target: 0.658

OPUSDT 1W AnalysisOP ~ 1W Analysis
#OP Buy back gradually from here, this is the lowest support block for now with a short term target of at least 20%+ from here.

OP buy longOPUSDT is bullish from here on daily timeframe. 1D Bullish order block filled and green bullish candles with positive structure are buy sign, So its worth of taking it.

Don't miss today's signal.Hello friends
Based on the extensive and comprehensive analysis we conducted, we were able to obtain the buying points and targets for this currency for you so that you can buy in stages with risk and capital management.
*Trade safely with us*

OPUSDT 1D AnalysisOP ~ 1D Analysis
#OP Buy in stages from here with a short term target of at least 15%+ and a long term target of $2.7

#OP/USDT#OP
The price is moving within a descending channel on the 1-hour frame, adhering well to it, and is heading for a strong breakout and retest.
We are seeing a bounce from the lower boundary of the descending channel, which is support at 0.653.
We have a downtrend on the RSI indicator that is about to be broken and retested, supporting the upward trend.
We are looking for stability above the 100 moving average.
Entry price: 0.702
First target: 0.757
Second target: 0.805
Third target: 0.865

#OP/USDT#OP
The price is moving within a descending channel on the 1-hour frame and is expected to continue upward.
We have a trend to stabilize above the 100 moving average once again.
We have a downtrend on the RSI indicator, which supports the upward move by breaking it upward.
We have a support area at the lower limit of the channel at 0.817.
Entry price: 0.860
First target: 0.891
Second target: 0.916
Third target: 0.950

OPUSDT 1D AnalysisOP ~ 1D Analysis
#OP Buy after successfully penetrating this resistant line with a short -term target of at least 15%+ from here.

OPUSDT 3D AnalysisOP ~ 3D Analysis
#OP Buy gradually from here if you still have a Conviction on this coin with a short -term target of at least 15%+ from here.

OPUSDT 4DOP ~ 4D Analysis
#OP Place two purchases at this support level, with a short -term target of at least 20%+.
This is a key support that needs attention.

#OP/USDT#OP
The price is moving in a descending channel on the 1-hour frame and is adhering to it well and is heading to break it strongly upwards and retest it
We have a bounce from the lower limit of the descending channel, this support is at a price of 0.834
We have a downtrend on the RSI indicator that is about to be broken and retested, which supports the rise
We have a trend to stabilize above the moving average 100
Entry price 0.909
First target 0.939
Second target 0.992
Third target 1.054

Analysis of OPUSDT Perpetual Swap (4H - OKX)Analysis of OPUSDT Perpetual Swap (4H - OKX)
1. Trend Analysis
Bearish Momentum Continues:
Price remains below EMA 50, EMA 100, and EMA 200, indicating a strong downtrend.
Multiple sell signals confirm continued selling pressure.
The price is hovering near the lower part of the structure, meaning it is still searching for strong support.
Potential Oversold Conditions:
The Stochastic RSI is at an extreme level, suggesting the market could be oversold and a short-term bounce may occur.
However, until a clear reversal pattern forms, the trend remains bearish.
2. Key Resistance Levels (Supply Zones)
🔴 Major Resistance Areas:
1.5030 USDT (EMA 50 Resistance & Fib 0.500 Zone):
If price bounces, this is the first major test for buyers.
1.6139 - 1.7025 USDT (EMA 100 & Fib 0.618 Zone):
A stronger resistance zone; if price reaches this level, expect potential selling pressure.
1.8999 - 1.9419 USDT (Fib 0.786 - 0.886 & EMA 200 Zone):
A critical area; breaking this would indicate a shift toward a bullish structure.
3. Key Support Levels (Demand Zones)
🟢 Crucial Support Areas:
1.4225 - 1.4335 USDT: Local support area; if this breaks, price could drop further.
1.3581 - 1.3150 USDT (Demand Zone & Entry Point):
This is a strong historical demand zone; if price reaches here, buyers might step in.
1.2850 USDT: A deeper support level, marking the last known major buying area before a potential larger breakdown.
4. Risks & Concerns
⚠️ Bearish Signals & Potential Risks:
Trend Still Bearish: Price is trading below all major EMAs, meaning any bounce could be a short-term retracement.
Weak Buying Volume: Without strong volume, even if price bounces, it may fail to sustain upward movement.
Possible Breakdown Below Support: If price breaks below 1.3150 USDT, further declines toward 1.2850 USDT are likely.
5. Trading Strategy
✅ Long Scenario (If Price Holds Support & Shows Strength):
Entry: If price bounces from 1.3150 - 1.3581 USDT (Demand Zone).
Target 1: 1.4335 - 1.5030 USDT (EMA 50 Resistance).
Target 2: 1.6139 - 1.7025 USDT (EMA 100 Resistance).
Stop-Loss: Below 1.2850 USDT to minimize downside risk.
✅ Short Scenario (If Price Rejected at Resistance):
Entry: If price reaches 1.5030 - 1.6139 USDT and shows weakness or rejection.
Target 1: 1.4225 USDT (Local Support).
Target 2: 1.3581 - 1.3150 USDT (Demand Zone Retest).
Stop-Loss: Above 1.7500 USDT to avoid getting trapped in a breakout.
6. Summary & Outlook
📌 OPUSDT remains in a strong downtrend, with support at 1.3150 - 1.3581 USDT.
📌 Key resistance levels are 1.5030 - 1.7025 USDT. If the price fails to break, expect continued downside.
📌 A bounce could lead to a short-term recovery, but bearish sentiment dominates.
📌 Trading Strategy: Wait for a confirmed bounce from support for long entries or short at key resistance levels.
🔎 Recommendation:
Monitor price action near 1.3150 USDT for a potential bounce.
If rejection happens at 1.5030 - 1.6139 USDT, consider shorting opportunities.
💬 Would you like a deeper breakdown of any specific area? 🚀📊

#OP/USDT
#OP
The price is moving in a descending channel on the 1-hour frame and is expected to continue upwards
We have a trend to stabilize above the moving average 100 again
We have a descending trend on the RSI indicator that supports the rise by breaking it upwards
We have a support area at the lower limit of the channel at 1.70
Entry price 1.77
First target 1.84
Second target 1.90
Third target 2.00

OPUSDT 5DOP ~ 5D
#OP If you still have Conviction on the coin,. Buy gradually within this support block,. with a minimum target of 20++

#OP/USDT#OP
The price is moving in a descending channel on the 1-hour frame and is expected to continue upwards
We have a trend to stabilize above the moving average 100 again
We have a descending trend on the RSI indicator that supports the rise by breaking it upwards
We have a support area at the lower limit of the channel at a price of 1.75
Entry price 1.87
First target 1.95
Second target 2.03
Third target 2.11

#OP/USDT Ready to launch upwards#OP
The price is moving in a descending channel on the 1-hour frame and sticking to it well
We have a bounce from the lower limit of the descending channel, this support is at 2.10
We have a downtrend on the RSI indicator that is about to break, which supports the rise
We have a trend to stabilize above the moving average 100
Entry price 2.17
First target 2.28
Second target 2.40
Third target 2.60

op idea"🌟 Welcome to Golden Candle! 🌟
We're a team of 📈 passionate traders 📉 who love sharing our 🔍 technical analysis insights 🔎 with the TradingView community. 🌎
Our goal is to provide 💡 valuable perspectives 💡 on market trends and patterns, but 🚫 please note that our analyses are not intended as buy or sell recommendations. 🚫
Instead, they reflect our own 💭 personal attitudes and thoughts. 💭
Follow along and 📚 learn 📚 from our analyses! 📊💡"
