nas100 nas will continue to drop we have a broken trend so all its doing is retracement, so looking for buys in this green areas i marked and holding long
Orderblock

Going up?Price has reached our weekly bear orderblock level and we see price consolidating. We want to see a good bear reaction form that level.. This may unfold prolly tomorrow or next week. Just waiting for the right time. 90% waiting 10% trading

Blue Thursday This is a trade we took today on EurUsd based on market structure and invalidation points... trades still running with partials taken. We are still bearish but longterm bullish on the DXY just waiting for confirmation for short term sells.Good Luck Good Trading


is OB = 0.886 fib (OBSERVATION)Is 0.886 fib an OB level or are we just speculating? well in short idk😉 you find out on your own, i have been back testing this thing for the past few weeks and almost in all cases im seeing some correlation between the two, but why? well idk😂 its basic math at this point i mean order blocks are areas where price made some form of lows or highs, so at those areas if price revisits there might be an opportunity for good reaction those areas are almost in all cases at the 80% of the move up.
Why do i think 0.886 is better than OB?
OB is dynamic, you don't clearly understand which OB to use 15m 30m etc.... why not 25min (this is something i had in mind when i first learned about OB). While in the case of fib its an exact level, we expect price to move at a specific value instead of a dynamic area.
is 0.886 something you made up?
www.youtube.com
Keep in mind this is just an observation so DYOR and backtest before you come to a conclusion.

[Twitter] Will the blue bird fly high?#Twitter #Stocks #NYSE #Daily
- Twitter, known to be world’s biggest social network platform recently had a good issue that Elon Musk has acquired about 9.2% stake.
- If you look at the chart, about 70% bullish rally has appeared with a huge gap.
- The black long-term upward parallel channel has been re-entered from the bottom and thus this bottom will be potential support for a while.
- In Elliott Wave perspective, I think this impulsive bullish wave is B. If Twitter successfully break the blue falling channel and the orange downward trendline above, this scenario might be wrong meaning that I will be very bullish.
- Until then, I would say buying in between my first support and the blue channel and orange trendline is not the best idea.
- For those looking for a new entry to buy, it would be either breakout entry above or pullback entries at my supports at 44.60~46.60, 39.30~ 41.30, and 33.30~ 35.30.
- Resistances that I am keeping my eyes on are 55.80~57.80, 62.40~64.40, and 68.40~70.40.

GBPUSD Long With An Order Block RetracementHi Traders,
We are on the 4-Hour Chart.
I am looking for GBPUSD to retrace into the yellow box.
My long position will open once the retraces touches the middle of the yellow box.
We have added confluence with price respecting the trend line and looking to move higher.
The Daily chart is looking like it wants to break out higher.
I am targeting previous wick highs.
My RR is 1/3
Trade safe and hope you are all having a fantastic week.
The Vortex Trader

My two Order Block entries this eveningTwo simple setups, not every OB will work
Backtest why these did, and you'll have enough to profit, every single time.

[Candlestick Patterns] Just need to know these three!#Candlestick #CandlePattern #Tocademy #Tutorial
Hello traders from all over the world, this is Tommy =)
I was unexpectedly surprised by many of you who liked and supported my last post about the basic concept of TA(Technical Analysis). Today I prepared a brief lecture about the Candlestick Pattern, one of the most fundamental phenomenon and behaviors that traders must be well-informed. In fact, we should be very familiar with these textbook contents and interpret it in a glimpse on the technical chart unconsciously. Just like we don't pay direct attention about each breathes when breathing, like we don't care each and all of the alphabets when we speak, or like we don’t perceive location of each keyboards every moment as we type, this very technique should be performed automatically and quickly by observing dominant formations of candlestick bars.
As a matter of fact, comprehending market trends and price actions only by referring to the candlesticks is yet too spurious. It should be used in such a way to weight on certain scenarios in a macroscopic view, rather than deriving precise and specific PRZ(Potential Reversal Zone)s and distinguish the accurate market trend. It’s never like ‘The price must go up because this pattern just appeared’. Furthermore, I strongly believe that the reliability of the candlestick pattern strategy is declining especially in recent financial market, where we encounter countless non-traditional and abnormal situations that were not very common in the past. Hence among the existing ‘Textbook’ candlestick pattern strategies that can easily be found on Google, there are particular patterns that are still very reliable on current market and there are ones that are not as reliable as it used to be. So here, I will organize everything very clearly for you guys.
The technical chart is well known as sort of a map tracing the mob-psychology of all the stakeholders in the market. Investors’ sentiments such as FUD(Fear, Uncertainty, and Doubt) and FOMO(Fear of Missing Out) that often cause panic buy/sell are visualized as data. Those with a clear understanding of the fundamental nature of how candlesticks are being formed, don’t even need to memorize these patterns one by one. As I emphasized at my previous post, candlesticks should be interpreted as a whole structure, unlike the line chart expressed in one-dimensional. Candlesticks are newly formed in each time interval and we can choose the timeframe for the chart that we are about to analyze. For instance, each candlestick in a daily chart is formed every day while each candlestick in a 5minute chart is formed every 5 minutes. Higher the timeframe of the chart is, longer-term the scope within the chart is. It is important as a TA analyst to start from macro-perspective with higher timeframe first, then go deeper to lower timeframe and find short-term factors.
There are four independent prices composing a candlestick: open, high, low and close price. Open price indicates the starting point while close price indicates the ending point of a candlestick. Just like the wording, high/low prices are formed at the highest/lowest price during the time period of candlestick being formed. A bullish candlestick is when the closing price is above the opening price (i.e., when the price rises), while a bearish candle is when the closing price is below the opening price (i.e., when the price is falling), and the two are expressed in different colors (green & red or red & blue). The thick part between the opening and closing price is called the ‘Body’, and the thin part is called the ‘Tail’ (Wick or Shadow).
Typically, the length of the body implies the strength of an ongoing trend. We learned from the textbook that the candlesticks with a longer body means stronger trend and those with shorter tails mean clearer trend. Back in the days, there was time when we could detect if whales are involved and deduct impulsiveness of ongoing trend when distinctly long bodied candlesticks with relatively high trading volumes take places. I am afraid to tell you that it is better to erase that memory. First of all, it is too obvious and cliché to announce that the long candlesticks with high volumes mean strong market trend. This criterion itself is quite vague and not 100% reliable to identify future trends or find insightful signals. Moreover, in recent days (especially in Crypto), whales like to deceive retail traders with a strong faith of trading volumes and since the future markets are becoming bigger, giving too much weight on trading volume paired to each candlestick is not as effective as it was when textbook used to work very well. I am not saying textbook is wrong. It just needs slight updates since the market we are dealing with keeps changing over time.
In TA world, closing price of a candlestick carries a great meaning and thus closing prices at higher timeframes should very well be monitored to become a successful trader. Sometimes whales even battle aggressively right before a major closing time often causing a weird ‘scam’ moves with a high volume. As shown below, we usually find the price and time when certain TA variables (such as top/bottom of trendline, channels, pivot levels, and other indicators) are broken, meaning if the price has penetrated those variables successfully, in order to find breakout entries, stoplosses, and target prices, etc. This whole concept of breaking above or below is quite vague, subjective, and relative idea. So, what we traders refer to as a reliable criterion is confirming whether the candle closed above and below the factors. For instance, let’s say that we are seeking and waiting for the breakout of the downward trendline. Well sometimes it’s not as easy as expected to precisely spot and determine whether the price has successfully pierced through the trendline. There are times when price breaks the trendline, but ends up coming back below leading close price of the candlestick to be formed below the trendline like the case 2 below. In this very case, it’s difficult to determine whether the breakout happened successfully or not. Nevertheless, like case 3, when both closing and high prices are formed above the trendline, we can clearly confirm and weight more on the breakout scenario, expecting more bullish rally.
Okay let's get to the point. In recent financial trading market, it's enough to know just these three.
1. Engulfing
2. Doji
3. Long Tailed Candlestick
As mentioned above, there’s nothing hard if you understand the essential concepts and principles of the above patterns and phenomena. The engulfing candlestick is a phenomenon in which the body of the previous candle is consumed by the body of the next candle, that is, a larger body than the previous one comes out. In other words, if a new bullish candle closes higher than the previous open price or if a new bearish candle closes lower than the previous open price, we say ‘the new candlestick engulfed the previous one’. If we look closely, this pattern implies the circumstance where the new candle completely overwhelms the trend of the previous candle and reverses it into a new trend despite closing the price from above or below. However, the appearance of an engulfing candle does not mean that the trend is unconditionally reversed. It is often the case that engulfing candles take place consecutively, with the second candle taking over the body of the first candle, the third’s taking over the second’s, the fourth’s taking over the third’s and so on. As the price fluctuates up and down, it creates a Widening or Broadening pattern also known as expanding sort of shapes, making it difficult for traders to figure out the current trend. In this circumstance, the entry prices, stop loss prices, target prices, or average prices of many participants in the market tend to be located relatively nearby. This price range or region is called a HVP(High Volume Profile or Peak) or an Orderblock and I will cover details about this concept later on another post. Anyway, there are numerous methods to derive Orderblock and one of them is to spot bodies of the consecutive engulfing candlesticks.
The tail(wick) of a candlestick can be interpreted as a sign of the fierce battle between the bulls are bears. Longer tail signifies bigger collision between buying and selling forces. The longer the upper tail, the more the bulls trying to raise the price up but the bears rejecting them eventually sellers ending up being dominant and vice versa for the longer the lower tail. Generally, when the long upper/lower tails are formed at a relative higher/lower part of the wave structure or at a distinctive pullback as a PRZ this can be a possible signal of trend reversal. Due to my personal trading experience, it doesn't matter much in recent TA market whether the long-tailed candlestick is a bullish or bearish. In other words, regardless of the color of Hammer or Shooting star (which are both long-tailed candlestick pattern), it’s better to check if the next following candlesticks are being formed opposite direction of the tail. Personally, I don't think the Inverted Hammer and Hanging Man are not as necessary as it used to be in the old days.
When the length of the candlestick’s body is relatively short meaning if the open and close prices are very close, forming a cross like shape, it’s called a Doji. Since Doji has a short body, the upper and lower tails tend to come out longer and thus can be considered as evidence of a tense confrontation between the bulls and bears that eventually ends up reaching a balance. Similar to the long-tailed candlestick, Doji is also known as a sign of a PRZ depending on the next appearing candlesticks. When Dojis are observed after swing high or low, it can be a possible indicator that the on-going trend is overheated and you might want to anticipate some pullbacks. However, it is too risky to directly assume that the top or bottom is near just because of Doji. Especially in the market these days, Dojis also appear frequently in sideways and sometimes confuses traders searching for a clear trend.
As emphasized above, as with other technical techniques, theories, and indicators, always remember to weight more to the emergence of patterns in higher timeframes and longer-term perspectives. The higher timeframe people globally refer to, the more the reliability the TA will be. Just think about it for a second. Which timeframe do you think that people consider more significantly about the closing price, a 5 minutes chart or a daily chart? I would obviously say that the price signals from the daily cart is relatively more representative and reflect longer-term than those of the 5 minutes chart. Keep in mind is that you also need to understand market trends from a macro perspective before approaching towards short-term perspective. It is always recommended to recognize long-term trends or situations in advance from the candlestick of a higher timeframe, and then look at more detailed and microscopic elements step by step.
All right. I will wrap up now. Thanks for reading my post.
Your subscriptions, likes, and comments are a huge inspiration for me to write more posts!

USDCHF 2hAt the moment, this symbol seems to be in a good position for a buy position. what do you think?

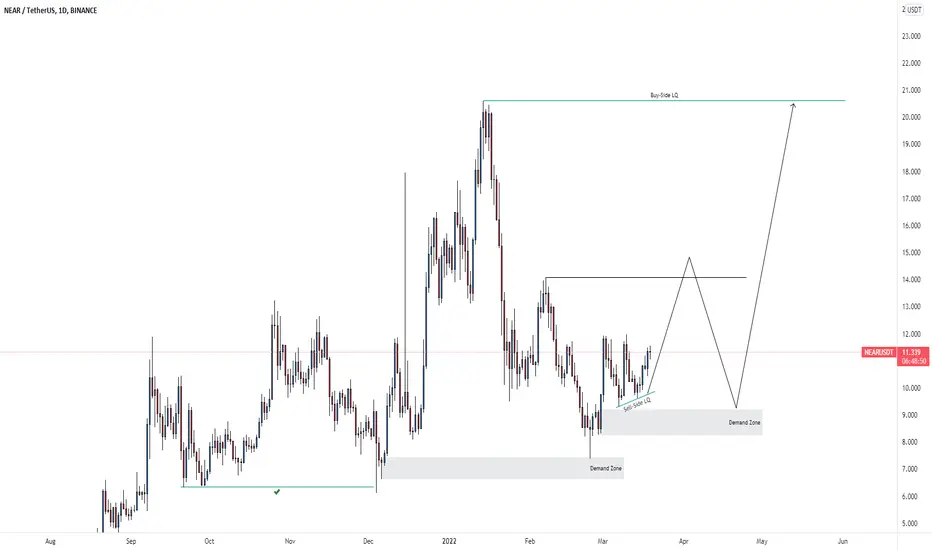
NEARUSDT LONG TERM BUYSWe have a bullish market structure, looking to move into the HTF Liquidity highs. Look for ways to position yourself into this project if you believe it in.
EURAUD H1 - LONGPrices taps into a H4 demand, broke out of structure leaving behind 2 areas of demand marked out in RED. Look for your confirmations onto those zones to take prices higher.

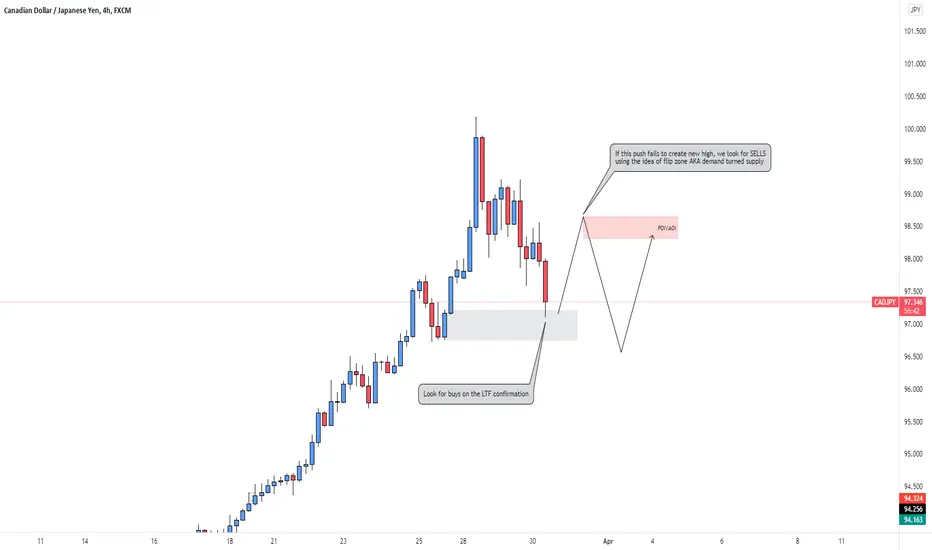
CADJPY H4 GAME PLANLook for LTF buys at current demand, with H4 bullish break out in our favour. In the event if this fails to create new high, then look for SELLS upon flip zone.
ICT BREAKER/ IOFED/ LIQUIDITY TRADEObviously in Hindsight...
Here we see a nice model, a breaker, IOFED, targeting SSL in formation of a trend line.

THE ICT BREAKER!hello, so you want a model that will get you profits? LOOK NO FURTHER!!!!
this is the ICT BREAKER, this mode (and other confluences) is ALL, YOU, NEED.
if you confluence the BREAKER with...
- BMS
- OTE
- PREM /DISC RANGE
- INTERNAL LIQUIDITY
WHAT. MORE. COULD. YOU. WANT.
what is labelled, as the purple box, THAT IS YOUR BREAKER BLOCK, YOU TRADE IN HERE WITH THE RIGHT FRAMEWORK AND CONFLUENCES.

ICT IMBALANCE / FVG / LIQUIDITY VOIDLiquidity void, Fair Value Gap, Imbalance... These terms are interchangeable.
As a Charter Member ill tell you what I've shown here, is a basic depiction, as I got asked a question on what is an imbalance?
An imbalance, is an imbalance in price, where price has NOT efficiently delivered orders in the market, price will like to revisit these areas, of imbalance, as seen here. The diagram on the left depicts the ideal model of what an imbalance is, the chart on the right is an in time example.
if you notice one of these getting filled, at a place where you are bearish/bullish... well.... there is your trade!

Orderblock with NFP.ahhh, and the orderblock i just outlined was just luck? coincidence?
research it.....
- LAST UPCLOSE BEFORE THE DOWN MOVE
- IMBALANCE INBETWEEN
- DISPLACEMENT AFTER IMABALANCE
- WITH DIRECTIONAL BIAS.

OrderBlock Basics.So, the fabled orderblock...
what have I marked here? I'd advise you to go to your 5Minute Chart, and see what I have noted.
Look at where price reacts from, if you backtest here, you should be able to understand..
WHY EVERY DOWNCLOSE/UPCLOSE IS NOT AN ORDERBLOCK.

Inner Circle Trader Strategy'shonestly, you don't need much, just an outstanding bias, and a conformation...
the framework delineated here, see it with your own eyes, you don't need indicators or tools...
look at the candlesticks, why have I wrote what I have wrote
backtest.

Short EURAUDEUR has been a weak pair in the past weeks. After the price rallied up to IPL 1.49000 which is currently the Highest Price of this week, today we have seen the price close below the last bullish OB of that retracement.
A breaker has been formed on the 4hr and this means the bears are back in control.
We go short
Like and Subscribe.

US30 WYCKOFF DISTRIBUTION FIRST LONG AND THEN SHORT.Hello everyone, I am posting here my analysis about what could happen next on US30 and why.
on 4 hour time frame we can see the PSY, BC , AR, ST , SOW and UT have already been formed.
The price has shown indecision and hence gave a reversal after breaking the RETAIL support (Providing break of structure or activating pending stop orders), it can be seen that the price is deflecting after breaking the retail support and now reversing.
To which I believe price will form a new weekly high this or next week where we could have a UTAD (Formation of Order Block) and on the restest of UTAD I would go short.
On this analysis, there are few Liquidity lines marked up above UT, which means , the price might break any of these liquidity lines (Break Of Structure) and then form UTAD (Order Block).
Please feel free to comment, like or share. Also, If you are against this idea, please raise a valid point.
Thank you..
TheEdger.

EURUSD 15M Yesterday ResultEURUSD tapping our Unmitigated OB it fill 50% so i wait for CHoCH and see BOS there and wait for the price back to OB. Put RR above the bearish wick and take profit above 5M OB.
Correct me if i'm wrong, thanks.
Goodluck!

Will Ascending Triangle fail soon?#EURUSD #FX #4H #Tommy
- Here’s EURUSD 4hr chart and I have made an assumption that the bearish wave starting from around 1.23470 is an impulsive wave cycle in Elliott wave perspective.
- It’s currently testing bottom of the orange ascending triangle with top located around 1.11240 and this very wave structure also can be expressed with an orange upward parallel channel.
- At the same time, purple short-term downward trendline keeps showing strong rejections. I will be bearish if bottom of the ascending triangle breaks below first.
- On the other hand, I will be bullish if purple trendline breaks above and even more bullish when it successfully breaks the top of the ascending triangle above.
- If EURUSD successfully breaks ascending triangle above, a considerable resistance area to enter short position is at 1.13100~1.13600.
- This resistance is a confluent zone of blue trendline, top of black channel, top of the orange channel, 0.786 retracement level, HVP pivot level, and inner trendline and is valid only until April 9th.
- If I were to design a short trading setup, it would be as below.
Short (Valid until 04/09)
EP: 1.13100
SL: 1.13970 (-870 PIPS)
TP1: 1.11790 (+1310 PIPS) -> RR: 1.51
TP2: 1.10260 (+2840 PIPS) -> RR: 3.26
