GBPUSD Hits Institutional Supply – Bearish Rejection Loading…⚠️ GBPUSD Smart Money Setup – Premium Price, Weak Low, Juicy Liquidity Below!
We’ve officially entered Smart Money playground territory on GBPUSD.
Here's what's happening:
🧠 Market Structure Narrative:
🔹 Price ran straight into a premium OB
🔹 Internal structure shift already played out
🔹 Now in distribution territory, prepping for a dump
Price has tapped into a high-probability sell zone (purple OB zone) between 1.34500–1.35000, where Smart Money is most likely positioned to unload shorts.
🟪 Order Block Confluence:
📌 OB Range:
Base: 1.34500
Cap: 1.35000
This zone caused the previous bearish impulse – unmitigated until now
Price reacted sharply upon entry = signs of institutional interest
💡 Clean, unmitigated supply = chef’s kiss setup.
🔻 Liquidity Engineering:
🧊 Below current price sits a “Weak Low” marked around 1.32400
💰 Below that: massive Sell-Side Liquidity at 1.31400
📌 This = high-probability magnet for Smart Money to drive price lower
🔁 Fibonacci Confluence (if applied):
Entry zone aligns with 70.5–79% retracement of previous impulse leg = premium risk zone for pro sellers.
💣 Entry Strategy:
🎯 Sell Zone: 1.34500–1.35000
📍 SL: Above 1.35100 (above OB + liquidity grab buffer)
📍 TP1: 1.32400 (Weak Low)
📍 TP2: 1.31400 (Sell-side Liquidity)
📍 RRR: Up to 1:5+ depending on entry precision
This is a swing trader’s dream — premium risk, maximum reward.
💡 Confirmation Tools:
✅ Bearish engulfing candle on LTF
✅ Internal BOS on M15-H1
✅ Rejection wick from OB or candle body stall = sniper entry
Be the sniper — not the FOMO chaser. 🎯
🧠 Key Lesson:
"Weak lows exist to be broken. OBs exist to be respected. Combine both = Smart Money sniper mode."
Let the trap trigger and ride the liquidity wave down.
🗣️ Drop a 💀 if you’re watching this setup play out!
📌 Save this chart — it’s a Smart Money blueprint.
Orderblock

USDJPY: Smart Money Reloads at Demand ZoneThis pair is showing some next-level institutional behavior right now, and the play is looking ripe for a long position — here's why:
📉 Previous Sell-Off = Liquidity Engineering
USDJPY had a strong downward leg creating a perfect internal liquidity pool, then took out that internal high (marked by triple liquidity tags 💵💵💵) just above a descending channel. That was your classic fakeout / inducement trap.
🎯 Price Tapped Into a Fresh Bullish Order Block
Price dipped deep into a refined OB (purple zone) aligned with the lower channel and then wicked hard out of it. That move created a bullish rejection wick, confirming buyer interest from smart money.
You can see price forming a micro HL structure at the edge of the demand zone — premium setup for continuation.
📍 Key Confluences:
✅ OB sits right around the mid-channel EQ
✅ Demand zone is built on top of a strong low (142.680 area)
✅ Strong risk-to-reward setup aiming for weak high and buy-side liquidity
✅ Rejection aligns with a bullish change of character (ChoCh) from lower timeframes
💥 Targets:
🔹 TP1 - Weak High at 144.400
🔹 TP2 - Buy Side Liquidity sweep at 145.514
🔹 Extended Target - Ride it to channel top / HTF imbalance fill above 146.000
📈 Trade Idea Summary:
Entry Zone: Anywhere in the OB range from 143.554 to 143.189
Stop Loss: Below 143.000 or the strong low
Risk-Reward: Easily 1:5+ if targeting full range move
🚨 Why It Matters:
This chart screams smart money accumulation at the bottom of a channel. Retail traders might still be shorting the retracement — but smart money is loading longs while price consolidates at demand.
If price clears the weak high, it could ignite a bullish rally into the upper supply zones where liquidity lies.
💬 Comment "UJ MOVE" if you're entering this sniper long!
🔁 Repost this if you’re tracking it with your team!

Gold (XAUUSD) Primed to ExplodeGold is looking ultra-reactive right now and ready to pop. This is textbook SMC with a clean roadmap.
🔍 Market Narrative:
Price action shows a series of equal highs + trendline liquidity sweeps, followed by a deep sell-off into a premium demand zone. What makes this setup powerful is how it:
Swept internal liquidity below structure
Tapped a strong low while entering a discount OB zone
Respected FVG (Fair Value Gap) sitting right in the golden zone (61.8–70.5%)
📍 Key Confluences:
✅ Triple inducement zones (yellow circles = retail trap triggers)
✅ Perfect bounce off the strong low (3,298.783)
✅ Price projected to react off FVG and then target the weak high + buy-side liquidity
✅ Target aligned with a -27% Fibonacci extension, i.e., 3,369.600
📈 Price Roadmap:
Current PA pushing up to break the Weak High
Slight retrace or reaction from the Fair Value Gap
Continuation bullish leg towards Buy-Side Liquidity: 3,345.470
Final extended TP at 3,369.600
🎯 Trade Plan (Long Idea):
Entry: Upon retrace into FVG (ideally between 3,314.560 – 3,312.046)
Stop Loss: Below the strong low (~3,298.783)
TP1: Weak High → 3,330s
TP2: Buy-side liquidity sweep → 3,345.470
TP3: Fib extension at → 3,369.600
RRR: Solid 1:4+ potential
🧠 Institutional Insight:
Smart Money is using retail trendline breakouts and fake resistance levels to stack orders before the real move. This play is all about accumulation + imbalance correction + liquidity run.
💬 If you’re watching Gold, drop a 🔐 or “XAU MOVE” in the comments!

Bitcoin’s Fake Pump Ends HERE! OB + FVG = Bearish Trap?📊 BTCUSD SMC Breakdown (3D Chart)
Price tapped into a High Probability Reversal Zone (OB + 61.8–79% Fib) with strong downward projection. This is a classic case of Smart Money selling into late bull euphoria. 👀
🧠 Smart Money Story:
Sell-side Liquidity Grab: Prior highs got swept—liquidity hunted 💧
Order Block (OB) + 61.8–79% Fib: This area is confluence-rich
Channel Top + Trendline Rejection = Extra confluence 🧱
Strong bearish reaction wick confirms Smart Money presence 🔥
Projection drawn toward 105,968 = -27% extension
📌 Key Technical Zones:
Zone Type Level / Range
Order Block : 108,267.68 (Purple Zone)
Premium Zone (OB + FVG) : 108,267 – 108,938
Entry Trigger : 108,251.52 (Current Price)
SL Zone (Invalidation) : Above 109,000
TP1 – TP2: 106,800 – 105,968 (TP2 = -27%)
🛠️ Trade Setup Idea (Short):
Sell Entry: 108,251 – 108,937
Stop Loss: 109,200
Take Profit 1: 106,800
Take Profit 2: 105,968
RRR: ~1:4 📉💰

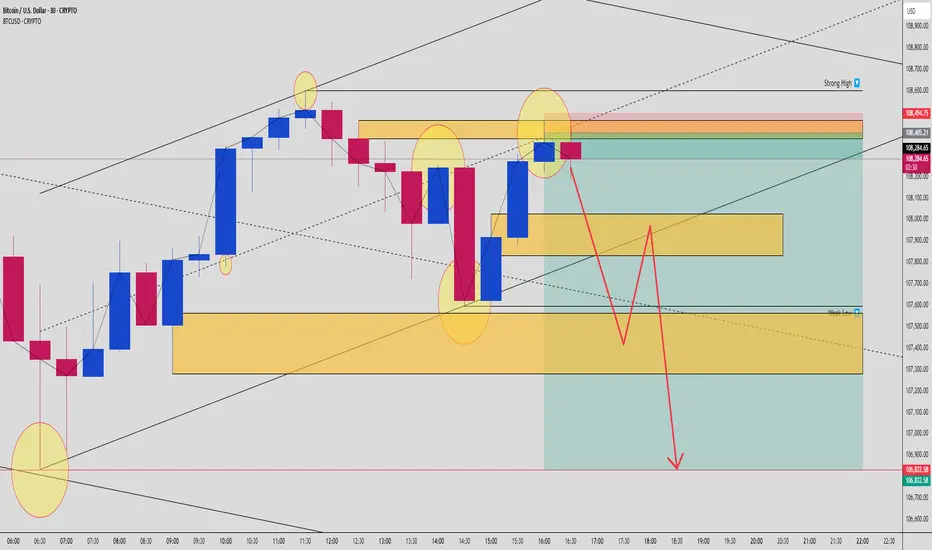
BTCUSD Smart Money Reversal: OB + FVG Trap Targets Weak Lows🚨 BTCUSD Smart Money Concept Alert (30-Min Timeframe)
A classic bearish setup is unfolding on Bitcoin, and it’s screaming trap + reversal for anyone watching closely. Here’s why this could be your high-probability short of the week… 👇
🔍 1. Liquidity Sweep at Key High
We just saw a clean sweep of prior swing highs near 108,400 – a clear signal that Smart Money has hunted liquidity above weak retail stops. That big push into the premium zone? Not real demand. It’s engineered manipulation. 🔧
📉 2. Premium OB + FVG Confluence
Price has just tapped into a juicy confluence zone:
🔲 Order Block @ ~108,400–108,494
🟦 Fair Value Gap (FVG) imbalance sits right below
🎯 All aligning with 61.8–79% Fib retracement from the prior bearish leg
This is where Smart Money institutions enter the party. Look left: it’s the same game played again and again. Trap the highs, fill the imbalance, then dump.
🔄 3. Reversal Evidence Already In Play
A bearish reaction candle confirms rejection from this OB zone. The wick shows aggression – a clear sign of selling pressure stepping in at the premium.
Expectations now shift from retracement to trend continuation toward unmitigated demand zones below.
🧠 4. Weak Low & Liquidity Engineering
Below current price lies a weak low around 107,300 – that’s your magnet. Price needs to sweep that inefficiency, and the structure suggests liquidity vacuum mode is active.
Key zone targets:
🟨 First TP: 107,800 (FVG base)
🟨 Second TP: 107,300 (weak low sweep)
🔻 Final TP: 106,832 (full mitigation zone = 1400+ pip potential)
🎯 5. Execution Plan
💼 Smart Entry:
Entry zone is anywhere from 108,250 to 108,490 (OB + FVG overlap)
SL above 108,600 (structure invalidation)
📊 Targets:
TP1 – 107,800
TP2 – 107,300
TP3 – 106,832
⚖️ RR: ~1:3 or better if executed precisely
🧩 Market Psychology:
This isn’t just technicals. It’s narrative vs. reality.
Retail sees breakout → Long
Smart Money sees sweep → Sell
Retail buys late → Fuel for Smart Money exits
🛡️ Risk Reminder:
Trade the setup, not emotions. Let price come to your zones. Stay mechanical, not emotional. Partial out and trail stops once TP1 hits. Never chase.
✅ Summary:
BTCUSD is showing a perfect bearish Smart Money setup. OB + FVG confluence, strong premium reaction, engineered weak low, and liquidity zones below. Textbook SMC pattern. Play it right, and this setup could deliver clean, high-RR profits.
⚡ Drop a “BTC READY” in the comments if you're watching this one with sniper focus.
🧠 Tag a trading buddy who still thinks we’re in a breakout!
BTCUSD (Bitcoin) Setting Up for a Trap and Crash📊 BTCUSD Smart Money Breakdown – May 23, 2025
This is a textbook liquidity trap setup — and the roadmap is crystal clear. The market already induced buyers at the top, is now tapping into an Order Block (OB) + 79% zone, and is preparing to nuke.
🔍 Market Narrative:
Strong high established – retail likely placing longs above that.
Clean retracement into Order Block zone (110,322 – 110,850) – where Smart Money is selling into demand.
PA is projected to fake a bullish breakout, reverse, and go for a deeper Fair Value Gap fill near 107,786, eventually targeting the Sell-Side Liquidity zone at 106,188.31.
📍 Key Confluences:
✅ OB + 79% Fibonacci = strong SMC reversal zone
✅ Clear FVG waiting to be filled = imbalance = magnet
✅ Weak low at 107,786.83 = perfect inducement for Smart Money run
✅ Final stop = Sell Side Liquidity sweep below 106,200
📉 Price Path Forecast:
Reject Order Block + Premium zone (110,496 – 110,850)
Retrace → FVG fill (between 108,900 – 107,800 zone)
Minor pullback or fake rally
Final move: liquidity raid under 106,188
Smart Money buys low again, setting up next bullish leg (later)
🎯 Trade Plan (Short Idea):
Entry Zone: Between 110,322 – 110,850 (OB)
SL: Above 111,000 (above inducement)
TP1: 107,786 (Weak Low)
TP2: 106,188 (Sell-Side Liquidity Pool)
RRR: Approx. 1:4 to 1:5 🔥
🧠 Institutional Logic:
Retail sees sideways structure = buys top resistance
SM sees that = sells into premium zone
This is accumulation → manipulation → distribution at its finest.
💬 Think BTC’s about to drop hard? Type “DUMP” or 🔻 in the comments! Let’s see who’s trading with the big boys.

BTCUSD Double Tap Into OB Before Massive Sell-Off! 2,000+ PipsHere’s why this could be one of the cleanest bearish setups of the week based on institutional flow and price action:
🚨 Step 1: Liquidity Engineering in Full Effect
We’ve got multiple areas where price was engineered to grab liquidity — clearly visible with those highlighted zones. Bitcoin pumped into a Strong High, tagging liquidity above a key trendline while respecting an internal parallel channel.
This move was not random. It was a textbook liquidity sweep.
🔁 Step 2: Order Block + 70.5% Fib Confluence
After the sweep, price retraced precisely into a bearish Order Block that overlaps perfectly with the 70.5% Fibonacci level — a hidden gem Smart Money loves to use for optimal entries. It’s the sniper zone.
This is where the first rejection came in, marking the start of bearish intent.
⚠️ Step 3: Break of Structure + Weak Low Exposed
As price dropped, it broke back under a weak low, confirming shift in market structure. This is your Change of Character (ChoCh) — the moment sellers regain control.
We’re now seeing retracement candles struggling to push above the OB/Fib zone. Rejection here confirms the setup.
🎯 Target Zones Breakdown:
✅ TP1 - Weak low around 110,200
✅ TP2 - -27% Extension (~109,500)
✅ TP3 - -62% Fib extension (109,268)
🚀 Extended Target - Possible sweep of Sell Side Liquidity all the way to 108,000–107,500
This is a potential 2000+ pip move if the full extension plays out.
🧠 Market Psychology in Play:
Institutions love to trap traders long after major breakouts. That last pump into the high? It wasn’t retail demand — it was liquidity generation. Now that they’ve swept the highs, they're driving price down to rebalance and mitigate.
Every highlighted zone on this chart? It’s a Smart Money footprint.
📌 Entry Game Plan:
Watch how price behaves around the current OB zone (111,250–111,618).
If price rejects and flips back under the midpoint (111,116), that’s your trigger.
Enter with tight SL above 111,750 and aim for TP1, TP2, and trail the rest to TP3 or lower.
📈 Risk Management Reminder:
Set your SL above structure.
Don’t overleverage — this is a clean setup, but patience is 🔑.
Let price come to you, not the other way around.
✍️ Final Thoughts:
This BTCUSD setup screams Smart Money — we’ve got:
Liquidity grabs ✅
Clean OB + Fib confluence ✅
ChoCh + structural rejection ✅
Strong R:R with multiple targets ✅
This might be the move to catch before the weekend liquidity sweep.
💬 Comment "BTC MOVE" if you’re watching this with me!
🔁 Tag your trading fam who needs to see this breakdown!

Gold Tap into Order Block, Ready for the Drop?Here’s a surgical bearish setup on XAUUSD, right out of the smart money playbook. Gold has tapped into a premium order block inside the golden zone (between 61.8%–79%) and is showing signs of exhaustion. This could be the beginning of a major sell-off.
🔍 Technical Breakdown:
🔻 Bearish Channel:
Market respecting both internal and external structure — clear downward channel
🟣 Order Block Zone:
Price tapped into the OB nestled between 3,332 – 3,338
➕ Aligns with 70.5%–79% Fib retracement zone (premium price)
🔂 Swing Failure Pattern (SFP):
Price wicked above previous minor high, showing manipulation + rejection
🔥 High RR Setup:
✅ Entry: 3,331.7 (current OB tap)
❌ SL: ~3,370
🎯 TP: 3,120 zone (0% fib extension + previous structure)
🧠 Confluences:
Liquidity taken above minor highs
OB + Fib alignment
Previous channel high rejection
Structural LH forming
🎯 Trade Idea:
This is a textbook distribution phase after a channel mitigation. Smart money has likely finished accumulating above highs and is prepping for markdown.
Plan:
Wait for bearish confirmation (e.g., 15min BOS or engulfing candle)
Enter short from OB
Trail SL if price breaks below the mid-channel zone
🧠 Quote for Traders:
“Price doesn’t reverse randomly. It reacts at engineered levels by the institutions.”
— Stay reactive, not predictive.

USDJPY Long Setup: Triple Confluence Zone Locked InSmart money traders love one thing more than anything — confluence. This BTCUSD setup hits all the marks:
📈 Structure Breakdown:
Market breaks structure to the upside ✅
Impulsive bullish leg breaks prior high ✅
Pullback into 61.8% golden zone + OB ✅
Rejection wick = perfect entry confirmation ✅
This is a high-probability continuation setup after BTC made a clear bullish BOS (Break of Structure) on the M30 timeframe.
🟦 Order Block Zone:
OB Range:
Top: ~106,989
Bottom: ~106,759
This OB was the last down candle before the big bullish impulse that broke structure. Price returned to mitigate here, then instantly rejected = Smart Money entry confirmed 🔒
🧮 Fibonacci Levels:
61.8%: Sliced right into it
70.5% – 79%: Deeper liquidity zone just below
The entry wick taps right into the sweet OB/Fib confluence zone and launches 🚀. It’s giving sniper precision with a low drawdown entry.
🎯 Trade Parameters:
Entry: ~106,759
SL: Below the OB zone
TP: 108,022 (previous high)
That’s an RRR of around 3.5–4.0x — a clean asymmetric play, just the way smart money wants it.
🔍 Confirmation Factors:
Bullish BOS on M30
Price returns to OB zone + golden ratio
Clean rejection candle with demand absorption
No internal structure break = bullish narrative still valid
🧠 Key Lesson:
“When OB meets Fibonacci, don’t ask why. Load up — the market just told you why.”
Let setups like this come to you. No chasing, no emotions. Let the algo-driven footprints guide you to the money.
📈 Missed this one? Save it for your playbook — this is how high-probability trades are built.
Drop a 💰 if you caught the same move!

BTCUSD: 61.8% Fib + OB = Precision Long PlaySmart money traders love one thing more than anything — confluence. This BTCUSD setup hits all the marks:
📈 Structure Breakdown:
Market breaks structure to the upside ✅
Impulsive bullish leg breaks prior high ✅
Pullback into 61.8% golden zone + OB ✅
Rejection wick = perfect entry confirmation ✅
This is a high-probability continuation setup after BTC made a clear bullish BOS (Break of Structure) on the M30 timeframe.
🟦 Order Block Zone:
OB Range:
Top: ~106,989
Bottom: ~106,759
This OB was the last down candle before the big bullish impulse that broke structure. Price returned to mitigate here, then instantly rejected = Smart Money entry confirmed 🔒
🧮 Fibonacci Levels:
61.8%: Sliced right into it
70.5% – 79%: Deeper liquidity zone just below
The entry wick taps right into the sweet OB/Fib confluence zone and launches 🚀. It’s giving sniper precision with a low drawdown entry.
🎯 Trade Parameters:
Entry: ~106,759
SL: Below the OB zone
TP: 108,022 (previous high)
That’s an RRR of around 3.5–4.0x — a clean asymmetric play, just the way smart money wants it.
🔍 Confirmation Factors:
Bullish BOS on M30
Price returns to OB zone + golden ratio
Clean rejection candle with demand absorption
No internal structure break = bullish narrative still valid
🧠 Key Lesson:
“When OB meets Fibonacci, don’t ask why. Load up — the market just told you why.”
Let setups like this come to you. No chasing, no emotions. Let the algo-driven footprints guide you to the money.
📈 Missed this one? Save it for your playbook — this is how high-probability trades are built.
Drop a 💰 if you caught the same move!

Gold Just Tapped the Trap – Ready to Bleed?🧱 Key Smart Money Zones:
Fair Value Gap (FVG) marked in the red zone between 61.8% – 70.5% fib retracement → textbook premium pricing 🧠
Price taps this FVG + OB zone, reacts bearishly → rejection candle confirms Smart Money filled up
📉 Fib Confluence Levels:
100% ➝ Swing High: ~3,234
0% ➝ Swing Low: ~3,204
Entry rejection zone was 3,217 – 3,224 → perfectly aligns with premium range
Price now returning back to equilibrium (50%) and heading toward discount levels (below 0%)
🔻 Bias: Strongly Bearish
Break of structure confirmed (from previous lows)
Rejection from FVG → confirms supply zone held
Large bearish imbalance below → price likely to seek that liquidity
⚔️ Entry Idea:
Entry: After price tapped FVG and printed bearish confirmation
SL: Just above 3,224.37 (FVG top)
TP1: 0% level @ 3,204
TP2: -27% @ ~3,192
TP3 (extended): -50% @ 3,191.25
RRR: 🔥 Easily 1:3+ if managed right
📢 Pro Tip for Ninja Traders:
Don’t chase the first candle — wait for the retrace into imbalance, look for rejection, and ride the wave back into discount zones. It’s all about flowing with Smart Money.
🧘♂️ Psychology Reminder:
"Liquidity creates opportunity. Rejection confirms intent."
Let them buy into premium → we sell with precision 🧠📉

GBPJPY Trap & Reversal | Smart Money Loading from OB Zone!We’re analyzing a high-probability bullish reversal setup forming on GBPJPY 1H, built on clean SMC logic. Here’s how this trade is setting up:
🔄 Market Structure:
Prior bearish move into a reversal area
Equal highs (liquidity built up)
Clean sweep below short-term lows ➝ Liquidity grab ✅
Price now reacting from a defined Order Block zone
🧱 Order Block Zone:
Purple OB zone marked at 192.753–192.118
This zone is resting between 61.8% and 70.50% fib levels – high confluence 🔥
💸 Liquidity Levels in Play:
Sell-side liquidity already swept
Buy-side liquidity sitting above the recent highs @ 196.413 (target zone)
🚀 Entry Plan:
Entry Point: Reacting from OB near 192.753
Stop Loss: Below the strong low (192.118)
TP Zone: 196.413 = Buy side liquidity ➝ Weak High marked for potential sweep
🧮 RRR (Risk-to-Reward):
Massive potential ➝ Approx 1:8+ RRR
This is the kind of setup institutions dream of. 🚀
📈 Key Confluences:
Equal highs = liquidity magnet
OB sitting at golden zone
Strong low protecting entry
Institutional pattern: Sweep ➝ OB reaction ➝ expansion
📉 Watch for Pullback/Entry Reconfirmation:
Price may tap deeper into the OB before expanding
Wait for bullish momentum confirmation (CHoCH on 15M or 30M TF = better entry sniper style)
📢 Pro Tip (Trader Mindset):
This setup screams “liquidity engineering”. Retail traders shorted the lower high; Smart Money is about to flip the script. Be the shark, not the fish 🦈

GBPUSD Retests Bullish Order Block – Smart Money Loading Up!📈 GBPUSD SMC Bullish Setup – Institutional Re-Entry Into Power Zone
Traders, this is a prime example of how Smart Money manipulates liquidity, taps deep into premium OBs, and prepares for explosive continuation moves. Let’s break it down step-by-step…
🔍 Market Structure Insight:
We’ve seen a clear bullish BOS (Break of Structure) after a strong impulsive move that broke past previous highs.
Now price is retracing into the bullish Order Block, giving a golden opportunity for re-entry — but only if you know what to look for.
🔲 Key Confluences:
💎 Order Block:
Marked between 1.3332 – 1.3290, this purple zone aligns with:
Breaker candle after a liquidity sweep
Prior imbalance zone
Institutional volume spike
📐 Fib Retracement:
From the swing low to high:
61.8% → 70.5% golden zone nested inside the OB
79% just below — great stop loss placement
📉 Weak High Above:
Current price action shows the market stalling near a weak high at 1.3400 — ripe for targeting in the next expansion.
📌 Strong Low at 1.3245:
Protected unless structure breaks. This helps confirm bullish bias remains intact.
🧠 Smart Money Logic:
This isn't retail "support."
Smart Money took out early sellers, pushed price impulsively, then returned to mitigate orders inside the OB before continuing the expansion.
This retracement = institutional reloading zone.
That red candle into purple? That’s the bait. 🧨
🎯 Entry Plan:
✅ Wait for bullish confirmation inside OB (engulfing, MS shift, or liquidity wick)
✅ Ideal entry at 1.3332–1.3300
✅ Stop below 79% Fib (~1.3289)
✅ Target:
TP1: 0% Fib (~1.3400)
TP2: -27% Fib extension (~1.3445)
TP3: Moon mission? 😏
RRR ~ 1:3.5+ — solid trade for swing traders and intraday scalpers alike!
🧘♂️ Psychology & Patience Reminder:
Let price come to you.
This setup rewards discipline and confirmation — don’t FOMO early.
Watch for trap wicks and engineered fakeouts at the OB zone.
You’re not chasing price.
You’re sitting where Smart Money leaves footprints. 👣
⚠️ Risk Tip:
✅ Stick to your model
✅ 1–2% risk max
✅ Scale partials at key levels
✅ Don’t revenge trade if price reacts first without you — next setup is always coming
🔁 Summary:
This GBPUSD chart is a masterclass in Smart Money structure:
Bullish BOS
Return to Order Block
Fib confluence
Weak high liquidity target
Perfect RRR setup
🧠 Let’s play it like a pro. If OB holds — the market flies. If not, we step out, risk-managed, and wait.
📣 Comment “GBPUSD SNIPER” if you’re ready for the OB bounce.
📈 Tag your trading fam to keep them on the money wave!

USDJPY Tap and Dump – Perfect Lower Timeframe ReversalSmart Money Scalpers, it’s time to eat 🍽️
USDJPY just played into a beautiful supply zone rejection on the 30-minute chart, with clean confluence from structure, trendlines, and OB reaction. Let’s break it down like a pro:
🧠 Market Structure Narrative:
🔻 Strong bearish momentum
🔹 Price created a clear lower low
🔹 Pullback into a premium zone = sniper short entry setup
You’re looking at textbook bearish order flow, with price rejecting hard from the 143.805 zone, which served as a high-risk institutional POI (Point of Interest).
🟥 Supply Zone / OB Zone:
📌 OB Range:
Top: 143.805
Bottom: 143.639
This red zone triggered the last bearish impulse and was just tapped and rejected with precision.
The reaction candle wick shows clear rejection = institutions likely mitigating and initiating shorts.
📐 Trendline Confluence:
You’ve got a perfect descending channel running down with clean touches on both trendlines.
Price bounced off the upper line → trendline + OB = double whammy setup 💥
🎯 Entry Plan:
Entry: 143.512
SL: 143.805 (above OB)
TP: 142.358 (next liquidity pocket)
This gives a juicy RRR of around 3.9–4x, depending on your exact fill.
🎯 Why This Works:
Price reacted to a clear OB
Inside a descending channel
Weak bullish push = no conviction
Favorable RRR = asymmetrical edge
Perfect combo of SMC + structure + execution = sniper-grade entry 🔫
🧠 Key Lesson:
“Let price come to you. Smart Money doesn’t chase — it traps and snaps.”
This is a trap sprung with surgical precision. Execution was key — and you nailed it.
🗣️ If this setup hit your radar too, drop a “🎯” in the comments
📌 Save this — these are the trades that build your bankroll over time.

USDCHF Premium Tap into Order Block🚨 USDCHF Smart Money Setup Unfolding – One Shot, One Kill Opportunity
Here’s why this setup is packed with confluence and how Smart Money might be laying the perfect trap before a big drop...
🧠 Structure Breakdown:
We’re currently seeing a textbook retracement into premium pricing after a clear bearish move, and Smart Money seems ready to strike again.
✅ Swing High to Low Fib Analysis
We’ve pulled from the most recent swing high to the swing low — and price is now retracing into the 61.8%–79% golden zone. That’s classic territory for Smart Money to reposition short.
📍 Premium Trap Zone:
Between 0.8375 and 0.8395, we’re stacking multiple confluences:
Fib Golden Zone (61.8% – 79%)
Bearish Order Block
Strong High (Liquidity Pool)
Diagonal Trendline Resistance
Break of structure beneath current price
Price action is walking up cleanly, likely to attract late longs — but we know better. This is liquidity engineering at its finest. 📊
🧱 Smart Money Zones:
🔲 Order Block (OB) at ~0.8380–0.8395)
This OB aligns beautifully with 79% fib retracement and sits right below a Strong High — where liquidity is waiting to get grabbed.
🎯 Entry Logic:
Wait for a tap + bearish rejection candle inside the OB.
Set stop loss just above the Strong High.
Ride the momentum back down toward discount zones.
🎯 Target Zones:
TP1: Back to 0% fib level (~0.8325)
TP2: Extension to -27% fib (~0.8295)
TP3 (if momentum flows): Sub 0.8280 levels
This setup offers a clean 1:3+ RRR with sniper-level precision. Low risk, high reward — exactly what we love!
🧘♂️ Psychology of This Move:
Smart Money creates the illusion of bullish strength to:
Lure breakout traders above the high.
Fill institutional sell orders inside the OB.
Sweep weak lows after rebalancing inefficiencies.
This is not a random pullback — it’s a calculated liquidity sweep before expansion. 🚀
⚡ Game Plan:
✅ Wait for price to reach premium zone
✅ Look for rejection (engulfing or SMC candle confirmation)
✅ Enter with SL above high
✅ Take partials at equilibrium and trail to discount
✅ Don’t rush — let price come to you 💎
🧨 Risk Management Tip:
This is a surgical setup — you don’t need to overleverage to win.
Let the chart do the heavy lifting. Stick to 1–2% risk and let the RRR carry the profit.
✍️ In Summary:
USDCHF is retracing into a major premium zone packed with Smart Money confluence — Order Block, Fib, BOS, liquidity, and trendline resistance.
This could be one of the cleanest bearish setups this week if you stay patient and time it right.
🗣️ Drop "USDCHF READY" in the comments if you're planning to catch this setup!
📲 Tag your trading partner and don’t let them miss this sniper entry!

BTC Reversal Starts Here – Smart Money Filled Up the OB! 🔄 Market Context:
Clear uptrend structure, forming higher highs
Pullback starts ➝ Lower timeframe shows bearish BOS
BTC wicks deep into bullish OB between 103,277 and 102,646
Liquidity sweep below the strong low @ 102,646 triggered ✅
Price now printing rejection from the OB zone 🚨
🧱 Key Order Block Zone:
Marked between 103,277 – 102,646 USD
Aligned with the golden zone (61.8%–70.5%)
Thick purple OB shows Smart Money’s interest 🎯
💸 Liquidity Zones:
Sell-side swept via wick under strong low
Next liquidity magnet: Buy-side Liquidity @ 107,141.59
Weak High @ 105,141.76 ➝ probable first stop 🛑
🚀 Trade Plan:
Entry: Tap and bullish rejection from OB
Stop Loss: Below strong low (102,646)
Take Profit: Partial @ 105,000 → Full @ 107,141 ✅
RRR: Estimated at 1:5+
📉 Why This Setup Rocks:
OB sits perfectly at fib retracement level
Strong low protected → Likely shift in structure next
Liquidity engineered before reversal ➝ Classic SMC recipe
📢 Pro Tip for Ninja Traders:
BTC loves to grab lows before sending price through the roof. If this 30M OB holds, higher TF (4H or 1D) could shift bullish again. This is not random—it’s engineered 📐
⚔️ Mindset Reminder:
"Patience is profit." You waited for the sweep, got OB confirmation, and now you're riding with the institutions 🧠💰

BTCUSD 30M | OB Rejection + FVG Target | Liquidity BelowSmart Money Concept Breakdown | May 18, 2025
This BTC setup is screaming institutional manipulation — and we’re ready to ride the wave. The most recent candle shows another clean rejection from the 30M Order Block, giving high confidence in bearish continuation.
🔍 Key Breakdown:
Entry Confluence:
Bearish OB between 103,569–103,634 tapped with a perfect wick
Candle rejected CRT High (high-probability manipulation zone)
Rejection confirmed with a bearish engulfing candle structure
Target Mapping:
Sell Side Liquidity: 102,643.59
Fair Value Gap: 102,200 zone
Weak Low: 101,420.70 (likely final draw on liquidity)
RR Setup:
Entry: 103,570 zone
SL: Just above CRT High at 103,811
TP1: SSL pool
TP2: FVG
TP3: Weak Low
Risk-Reward Range: From 1:2.5 to 1:5+ 💰
🧠 Institutional Logic:
The rally into the OB was likely a buy-side liquidity grab, faking retail breakout traders before dropping. If price breaks below 102,643 with momentum, expect a sweep of the FVG and weak low.
🎯 Bonus Watch:
If price returns to the OB but fails to break CRT High again = solid re-entry confirmation 📉🧠

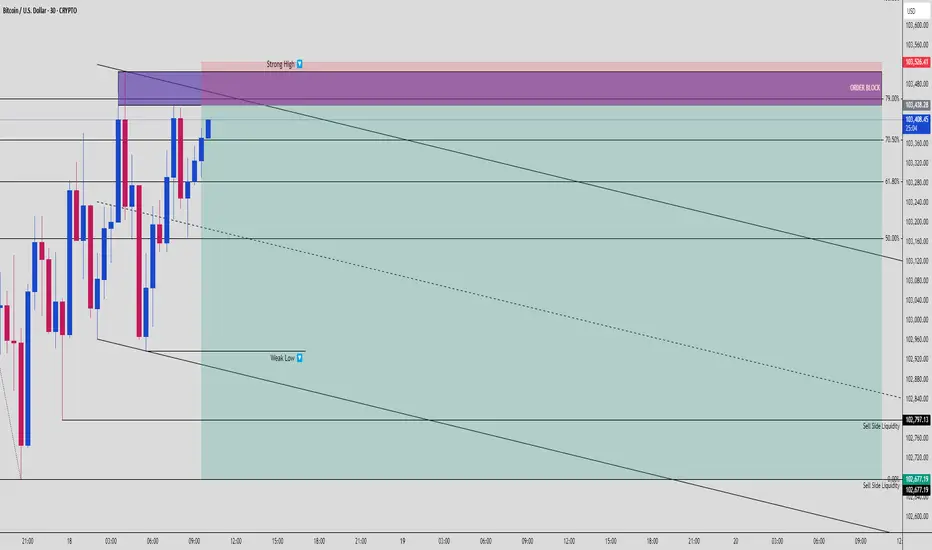
BTC Just Entered the Killzone — Order Block + Strong High Reject🔍 Bitcoin Smart Money Breakdown | May 18, 2025
We’re looking at a potential high RRR short opportunity forming on BTC/USD — chart structure screams SMC precision. Here’s what we’re seeing:
🧩 1. Key Setup Details
Price tapped into a premium Order Block between 103,438–103,526 🔴
Sitting just above a Strong High — liquidity is baiting shorts
Rejection occurred precisely at the 79% Fib retracement level, giving confluence
Bearish structure intact with lower highs & descending trendline
💣 2. Liquidity Map
Above: Strong High = buy-side liquidity trap
Below: Weak Low = prime sell-side magnet
Sell-side liquidity pools at:
102,797.13
102,677.19 (final TP zone)
This is exactly where institutions hunt for exits 🔪
🎯 3. Trade Idea
Entry Zone: 103,438 – 103,526 (OB zone)
Stop Loss: Above Strong High ~103,560
Target Zones:
TP1: 103,120 (50% Fib level)
TP2: 102,797.13 (SSL pool)
TP3: 102,677.19 (final flush zone)
Estimated Risk-to-Reward: 1:3.2 to 1:4.5 depending on SL/TP config 🧠📏
🧠 Bonus Insight:
If BTC wicks above the OB and returns with momentum = potential liquidity grab fakeout — a textbook SMC confirmation entry 👌
🎤 Caption Idea for Short-Form:
“BTC is playing right into the banks’ trap… are you on the right side of this rejection? 😮💨💰”
📲 Follow @ChartNinjas88 for elite SMC plays, sniper-level breakdowns, and real liquidity flow setups!
EUR/USD Loading for Takeoff? We got OB + Liquidity Combo.📊 EUR/USD 30-Min Smart Money Breakdown — May 15, 2025
Price is setting up for a high-RRR bullish reversal from a premium Smart Money zone — combining a textbook Order Block, Fibonacci golden zone, and uncollected Buy-Side Liquidity above.
Let’s zoom into this sniper play 🎯👇
🧠 1. The Setup
Recent bullish rally broke structure to the upside
Current retracement taps deep into:
✅ 50–61.8% Fibonacci zone
✅ A confirmed Bullish Order Block (OB)
Price currently pulling back for liquidity before an expansion move
🔍 2. Entry Strategy
Entry zone: Between 1.11762–1.11599 (purple OB + fib confluence)
Stop loss: Below 1.11500 (just under 61.8%)
Target:
🔹 TP1 → 1.12283 (Buy-side Liquidity)
🔹 TP2 → 1.12930 (Weak High = clean liquidity pool)
➡️ This gives a solid 1:3+ RRR if managed well with confirmation
📉 3. Smart Money Logic
Price is engineered to draw down into OB, liquidate early longs
Then Smart Money steps in, pushing price upward into inefficiencies + liquidity
Sell-side gets cleared, buy-side becomes the magnet
⚠️ 4. Caution Points
Wait for bullish confirmation on the 5m–15m inside the OB zone
Avoid early longs — let the trap complete!
Monitor USD news or macro catalysts that could spike volatility
This is how Smart Money traps are laid out: grab liquidity → rebalance price → expand into inefficiency zones.
If you're trading SMC without waiting for the OB reaction, you’re just gambling with smart money’s leftovers. 🍽️💸
💬 Drop a “📈” if you're watching this OB level!
📊 Follow @ChartNinjas88 for daily sniper setups and liquidity-based trades!

BTCUSD Smart Money Play: Order Block Trap Before the Dump?🚨 Bitcoin (BTCUSD) is flashing a textbook Smart Money setup — are you positioned before the move unfolds?
This chart reveals a juicy opportunity for traders who understand how to follow Smart Money footprints. Let’s break it down:
📊 Chart Context (30m Timeframe):
BTCUSD recently tapped into a significant Order Block (highlighted in purple) — this is where Smart Money typically loads up.
Notice how price showed a fake push into the premium zone, but failed to break higher — signaling potential distribution.
📉 Bearish Reaction + Fib Confluence:
Price kissed the 61.8% Fibonacci retracement, then sharply rejected — classic sign of mitigation before continuation.
The red zone (above 103,700) served as a perfect liquidity trap, where late buyers got baited.
📍 Order Block Zone (OB):
Price is stalling just beneath the OB at 103,577, showing signs of rejection.
Smart Money often uses this pattern to “tap and trap” — tapping into resting orders before driving price down.
🧠 What’s Really Happening?
Retail longs are trapped inside the red box, expecting a breakout.
Meanwhile, Smart Money is distributing into that demand before driving price toward the discount zone (marked in green).
🎯 Target Objectives:
Immediate target: 103,200 (50% Fib level)
Extended target: 102,616 — which aligns with the liquidity void below.
⚡ Risk-Reward Setup:
Entry near 103,577 with SL above 103,749
Targeting 102,616 gives an excellent R:R profile
You don’t chase Smart Money — you follow their traps, and react with precision.
📌 Trading Plan:
Wait for clear rejection or bearish engulfing on lower timeframes at OB
Manage risk wisely — even clean setups can be invalidated.
Don’t guess. React. Let the market show you intent.
💡 Final Take:
This BTCUSD setup is textbook Smart Money Concept in motion:
Order Block ➡️ Trap ➡️ Liquidity Grab ➡️ Expansion
Whether you short this retracement or wait for confirmation, this is a move you’ll want on your radar. Weekly close could reveal major direction.
✅ Comment “OB READY” if you’re watching this setup!
✅ Save this post for future reference. Smart Money always leaves clues.

Gold's Fakeout Into The Trap — Smart Money is Loading Up🟡 GOLD 30-Min Chart Breakdown — May 14, 2025
Gold just gave us a masterclass in Smart Money Concepts (SMC). Let’s dissect the juicy bits of this long setup:
🧩 1. Structure Overview
Market in a defined downward channel
Price taps the order block from previous accumulation zone
A liquidity sweep wick pierces just below the OB (classic SMC trap)
🛠 2. Key Confluences
🔵 Order Block: Held strong, respected on multiple timeframes
🔴 Liquidity Sweep: Deep wick hunts stops below OB, then bullish reaction
📉 Descending Channel: Price bounced off the bottom trendline
✅ Clean RRR Long: Setup has 1:5+ potential if targeting the upper channel
📈 3. Trade Idea
Entry: Around $3,220
Stop: Under $3,206 (below liquidity sweep)
TP: Zone near $3,257
Expecting breakout attempt if momentum breaks structure above $3,240
📉 4. Risk Notes & Management
Keep an eye on Asian session volume — fakeouts are common
Trail stop as price pushes past mid-channel
Rejection at $3,240 = consider partial close
📌 Gold loves a dramatic reversal — this one is no different. Smart money doesn’t chase — they accumulate in fear. This setup screams institutional entry zone.
💬 Drop a “💎” if you caught this with us!
🎥 Follow @ChartNinjas88 for clean SMC breakdowns like this every day!

EURUSD Just Landed in the Killzone — Bounce or Breakdown?🔥 EURUSD 15-Min SMC Precision Play — May 14, 2025
Here’s a sweet Smart Money sniper entry on EURUSD, caught right as price tagged a powerful triple confluence zone:
📊 1. Structure & Momentum
Recent bullish momentum created a weak high around 1.12660
Retracement follows with strong bearish pressure
Price lands exactly at a previous OB, Fair Value Gap, and the 61.8% fib retracement
🧱 2. Confluence Breakdown
🔴 Fair Value Gap (FVG): Unfilled imbalance tapped
🟣 Order Block (OB): The last down candle before bullish rally
🟡 61.8% Fibonacci Level: Price kissed the golden pocket
This stacking creates a high-probability reversal zone
🎯 3. Trade Plan
Entry: Around 1.12160
SL: Below 1.12090 (under 70.5% fib)
TP: At 1.12660 targeting previous weak high
RRR ≈ 1:6 — optimal asymmetric reward play
🔄 4. Management & Outlook
Watch for reaction on the 50% level at 1.12300
Break of market structure above 1.12400 = confirmation
Scaling out advised at midline levels with stop-loss trailed manually
🧠 Smart Money knows this is where the liquidity pools live. You're not late — you're patiently positioned where the institutions hunt.
🎯 Drop a “📍” in the comments if you're watching EURUSD
🎥 Follow for more sniper setups like this one — @ChartNinjas88

GBPJPY Just Hit the Sweet Spot — High RRR or Fakeout Trap?💷 GBPJPY 30-Min Chart Breakdown — May 14, 2025
This setup is a banger for traders following structure, zones, and risk-reward logic. Let’s dissect the trade logic:
🔍 1. Market Structure
Price has been moving within a well-respected ascending channel (see black trendlines).
We just printed a short-term bearish pullback, with price dipping into a refined demand zone (highlighted pink/red).
The most recent bearish impulse looked like a liquidity sweep, not a structure break.
🧱 2. Smart Money Zone
Demand zone aligns with:
✅ Previous OB (order block)
✅ Mid-channel support
✅ Equal lows & trendline liquidity just below
Dark gray box = the exact entry block
Bulls stepped in right on time — classic mitigation + reaction setup
🎯 3. Risk-Reward
Entry: Around 195.380
SL: 195.110 (tight below the block)
TP: 196.575
RRR ≈ 1:5 — beautiful sniper entry with minimal exposure and max gain
🧠 4. What to Watch Next
Break above 195.900 = confirmation of bullish continuation
If price stalls again below midline, re-entry could come after another liquidity push
Clean break of 195.100 = invalidation (watch for potential short setups below)
🔁 Trade Management Tips:
Trail stops aggressively above 195.900
Scale out partials every 50 pips if you're trading it like a swing
Add confluence from DXY/Yen strength for better context
This one checks all the boxes: structure, zone, confirmation, and a clean RRR.
🚀 Tag a trader who loves tight stop, high-RR plays.
📲 Follow @ChartNinjas88 for more Smart Money scalps & swing setups!
