FAIR VALUE GAP OR ORDER BLOCK ENTRYA fair value gap (FVG) and an order block entry are concepts used in technical analysis within financial markets to identify potential trading opportunities.
### Fair Value Gap (FVG)
A fair value gap refers to a price range on a chart where there is an imbalance between buyers and sellers, often resulting in a quick movement through this area without much trading activity. This gap can create a zone of interest where price may return to fill the gap, presenting a potential trading opportunity. Traders look for these gaps to predict price movements, expecting that the market will revisit these areas to achieve a fair value.
### Order Block Entry
An order block is a consolidation area where significant buying or selling has taken place, often by institutional traders. These blocks are typically identified by a cluster of orders that create a strong support or resistance level. When price returns to this level, it often reacts due to the presence of unfilled orders, providing a strategic entry point for traders. Order blocks are used to predict where the price might reverse or continue its trend, offering a high-probability entry signal based on historical price action.
Both concepts are used by traders to make informed decisions based on the past behavior of price and volume, aiming to identify areas where significant trading activity is likely to influence future price movements.
Orderblock

ORDER BLOCK CONFIRMATION ENTRY PART 2Sure! Here's another description of order block confirmation with a focus on practical application and detailed examples:
### Understanding Order Block Confirmation:
Order block confirmation is a technique used by traders to identify and validate significant price levels where large orders from institutional traders have been placed. These levels often act as strong support or resistance zones. Confirming an order block helps traders make informed decisions about entry and exit points in the market.
### Detailed Steps for Order Block Confirmation:
1. **Identify Potential Order Blocks:**
- **Bullish Order Block:** Look for a downtrend that ends with a strong bullish reversal, marked by one or more large bullish candlesticks.
- **Bearish Order Block:** Look for an uptrend that ends with a strong bearish reversal, identified by one or more large bearish candlesticks.
2. **Analyze Market Structure:**
- **Trend Context:** Determine whether the market is in an uptrend, downtrend, or sideways movement. This context helps in predicting the likelihood of the order block holding.
- **Key Levels:** Note the order block's alignment with significant support or resistance levels.
3. **Volume Analysis:**
- High volume during the formation of the order block is a strong indicator of institutional activity. Look for volume spikes that coincide with the large candlesticks forming the order block.
4. **Price Action Confirmation:**
- **Engulfing Patterns:** A bullish engulfing pattern at a potential bullish order block or a bearish engulfing pattern at a potential bearish order block can confirm the level.
- **Pin Bars and Rejection Candlesticks:** Candlesticks with long wicks (e.g., pin bars, hammers, shooting stars) at the order block level indicate strong rejection and confirm the presence of significant buying or selling interest.
- **Break and Retest:** Confirmation is stronger if the price breaks through the order block level and then retests it as support (for bullish order blocks) or resistance (for bearish order blocks).
5. **Indicator Confirmation:**
- **RSI (Relative Strength Index):** If the RSI shows overbought conditions at a bearish order block or oversold conditions at a bullish order block, it provides additional confirmation.
- **Moving Averages:** The interaction of price with moving averages (e.g., 50 EMA, 200 EMA) near the order block level can confirm its validity. A bounce off or crossover can be significant.
6. **Confluence of Factors:**
- Multiple confirmations such as Fibonacci retracement levels, pivot points, and trend lines aligning with the order block increase its reliability.
### Practical Examples:
1. **Bullish Order Block Confirmation:**
- Suppose the price of a stock is in a downtrend and reaches a level where it forms a large bullish candlestick, followed by increased volume.
- The RSI indicates oversold conditions.
- The price breaks above the identified order block and later retests this level, forming a bullish pin bar.
- This confluence of signals confirms the bullish order block, suggesting a potential entry point for a long position.
2. **Bearish Order Block Confirmation:**
- Consider a forex pair in an uptrend that hits a resistance level, forming a large bearish candlestick with a volume spike.
- The RSI shows overbought conditions.
- The price breaks below the identified order block and retests it, forming a bearish engulfing pattern.
- This setup confirms the bearish order block, indicating a potential entry point for a short position.
### Trade Execution and Management:
1. **Entry:** Based on the confirmed order block, place a buy order at the bullish order block or a sell order at the bearish order block.
2. **Stop-Loss:** Set stop-loss orders just below the bullish order block or above the bearish order block to manage risk.
3. **Take Profit:** Identify potential take-profit levels based on historical price action, nearby support/resistance levels, or using risk-reward ratios.
By following these detailed steps and examples, traders can effectively use order block confirmation to enhance their trading strategies and improve their chances of successful trades.


"The Bodies Tell The Story.. The Wicks Do The Damage" - ICTIn this video I'm going to go through one of ICT's most famous sayings, which is "The bodies tell the story, and the wicks do the damage". If haven't taken the time to understand what he means, then you are seriously putting yourself at a disadvantage if you are using his concepts. This is one of the most crucial and useful pieces of the ICT puzzle. You often hear him say that the wicks are painting outside of the lines, which he sees as permissable when he is trading his PD Arrays. So without further ado, I'll try my best to provide some insight.
For illustrative purposes I'll use his Market Maker Sell Model. Just to note that this is not a video teaching about his market maker models, so the focus will not be on that or his other concepts. If you don't understand a certain term or concept, please check out ICT's YouTube Channel or the countless other resources online. This video will be predominantly shedding some light on candle bodies and wicks.
I urge you to go into your own charts and do your own study. This will truly be something eye opening if it is the first time you've actually decided to take notice.
- R2F

BTC is going down to touch the DP orderblockBy closing daily candle below the IDM liquidity in BTC daily timeframe, we can expect that price falls down to touch the desicion point orderblock at 54900.
After that it should create any confirmation for buy.
But if price goes below the DP (below 51000) then it could fall down to reach ENG liquidity and Extreme OB at 41870 and 40300 and then raise up to 73853 again .
this is my personal analysis and its not a financial advice.

ETHUSDT.PTF (Time Frame): 4H. Price closed above inducement liquidity and OB (Order Block). In this scenario, I expect price to push higher, at least to the level of 3938.15 and maybe higher. After reaching this level, the analysis must be updated.

USD/JPYThe USD/JPY returns to consolidation and I want to see the price taking buy stop and high quality OB to short.

🌕🚀Long Opportunity on SOL/USDT: Leveraging POC, Fibs and SMC💰Welcome to my trading idea for SOL/USDT! We're eyeing a long position based on a confluence of factors including the Point of Control (POC), Fibonacci retracement levels, and Smart Money Concepts (SMC) with a Bullish Order Block (OB).
Entry: Our entry point is strategically set at 173.78, residing within the Golden Pocket of Fibonacci retracement levels. This zone not only intersects with significant POCs but also aligns with a Bullish OB, reinforcing its attractiveness as a potential entry point.
Stop Loss: To manage risk effectively, our stop-loss order is positioned at 165.22. Placed below the Golden Pocket, OB, and POCs, this level provides a buffer against potential downward movements.
Take Profit: Our take-profit target is set at 200.20$. This represents our first profit-taking level (TP1) and offers a favorable risk-reward ratio.
By leveraging these technical indicators and market insights, we aim to capitalize on potential bullish momentum in SOL/USDT, while ensuring prudent risk management. Remember to adjust your position size according to your risk tolerance and always stay informed of market developments. Happy trading! 🌟📈
Don´t forget to like (boost),follow me, comment and share it to your friends!

USD/JPYI want to see the price violates BSL to take buy stop within FVG on hourly USD/JPY and how it will react. Will it form the highest probability of the OB that will take SSL?


1H Orderblock IdentifiedAs you can see an orderblock is there (The red rectangle).
Based on market situation in next days, We should decide. But something big is there.
Wait for it :)

XAUUSD 4H FVG Area and Finding Lower HighXAUUSD still on bearish trend on 4H TF and want to find their lower high (2047 - 2049). If trendline break very possible to going into their lower high before (2064 - 2065) or maybe higher at their higher OB (2085 - 2088). I am looking for Buy setup on LTF at 4H FVG. On LTF there is a support area too on 4H FVG. Pretty good for entry and waiting for rejection candle and CHoCH. But if there is a rejection after hit the trendline, we looking for sell setup.


Liquidity isn't presentTrading above the the bullish order block
Poor daily volume
Resistance + 75.20, 75.75, and 76EGP
RULE of THUMB: comi breakout leads to FERTILIZERS eclipse

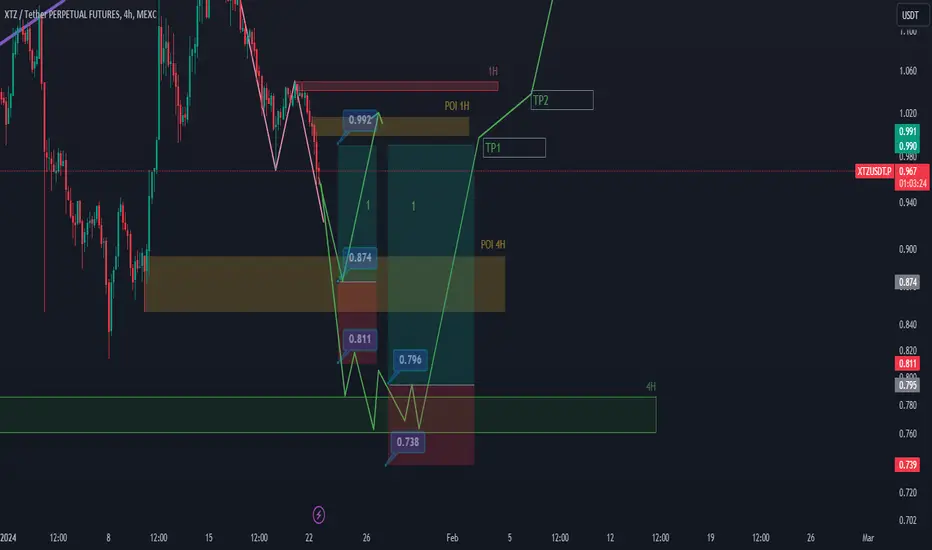
XTZUSDT.Preaching 4H Order block initiate the first long position and pending order could be placed.
if price go down to lower level near to 4H order block, according to weak upmovement in 4H time frame, i expect some fluctuation befor going up. and in oder to masive down movement in 4H time frame, pushing price to the up side s more possible
entry price, SL and TP is clear on the chart and i hope helps you makeing profit
It would be my pleasure to hear your thoughts on the analysis.
BTC/USD where is the moneh?The moneh (moneh = $ = liquidity = equal highs and lows)
Use the moneh to find
- Entry positions (expected stop hunt)
- Exit positions (equal highs and lows)

Warning : ETH Showing signs of falling!As you know we are in a downside structure and this upside move is just for grabbing more liquidities.
Now ETH after grabbing IDM liquidity is under of DP orderblock and made minor Choch so it have a potantial of downside move to 883 $ .
If price moves up to 2460 $ the falling senario will be cancelled until the price reach 3700 $
This is my own idea and its not a financial advice.

CADCHF SHORT 15MIN TIMEFRAMEOverall trend is down. Selling from area of imbalance. Sl set above the orderblock. Making risk free at 1:1 rr. Huge liquidity wick further reasoning to go to the downside.

Gold 09-12-2023Bearish Out Look Now
Start of Wave 1 Dwn
Pull Back Then More Downside
See Reaction To Sell Points
Bullish Outlook
Correction Complete On Daily TF
1 More Wave Up For Another A.T.H

2018 Rejection ===> 2002
Looking at this chart, we can see Price was moving in a a 1HR range, from 2015, we saw some rejection that took Price down to 2005 where Price failed to close below the range, and we saw a sharp rejection at the imbalance/FVG to the upside which brought us to 2014 where Price finally closed above the range, and it continued trending up to 2017.
The rejection at the FVG/Imbalance is a liquidity that needs to be taken if Price wants to make another swing high, which means Price might get to 2002 after sweeping the current high at 2018, and getting rejected.
More update will follow at NY Session where the action resides.
I would love to hear your thoughts 🤔 on this, so feel free to leave a comment ✍.
Please like 👍❤ this idea 💡 if you agree, and follow me for more updates ❕❕❕

GBPUSD BUY OPPORTUNITY 1:11 RR Using SMC method we can see on the 4hr chart, break of structure to the upside. There is a nice order block which has been modified on the 1hr and 15 min chart. Price has left sell side liquidity hoping trade triggers before buy side liquidity is filled. Before entry will be looking closely at 15 min chart. Once it hits OB we want to see break of structure on 15min timeframe to the upside and look for entry. Targeting 4hr OB. RR: 1:11.

AUD/CHF ↗️ Long Trade Setup ↗️Hello Everyone 🙋🏽♂️
Oversold + order block + Demand zone
🟠 EP 0.57523
🔴 SL 0.57369
🟢 TP1 0.57675 ⚠️( Close 33% of the trade and Set the SL on EP )⚠️
🟢 TP2 0.57830 ⚠️ ( Close 33% of the trade )⚠️
🟢 TP3 0.57986 🔥 ( Final result)🔥
We are not responsible of any losses for anyone, our trades are profitable more for long terms and we take losses as everyone,
manage your lot size as well and your SL and TP and my opinion is 0.01 lot for each 500 $.
Don't forget to hit the like bottom and write a comment to support us.
Follow us for more 🙋🏻♂️
Best Regard / EMA Trading .
Disclaimer:
----------------
It's not a financial advise, As everyone we take losses sometime but for long term trading we are profitable traders, so manage your account well with SL and TP and your lot size to keep your account safe and stay in the market

EURUSD SELL 5mWe're eyeing an OrderBlock on the 5 minute chart right near the tip of an Intermediate Term High (ITH). Our stop would account for the Fair Value Gap where the ITM formed. We would target the Intermediate Term Low, also on the 5 minute chart for a decent 1:3 RR. This trade would only be valid long before the news. If it isn't long into the trade before the news then there would be no trade.
