GBPUSD - LongUnfortunately I can't post the idea on the 5min to give you a better idea of where we are at in terms of the entry for this.
However I am looking to be tagged into this trade and have a limit order where I have set it.
Hoping to be tagged in. If we aren't we move on. and if we lose we move on.
If im able to help with any questions you may have do send them my way
Orderblocks

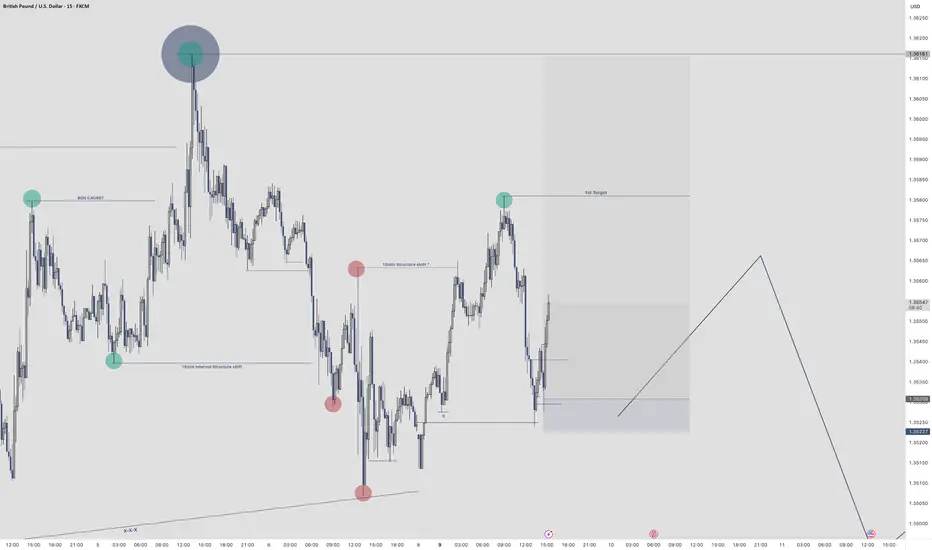
GBPUSD - LONG Looking at GBPUSD
We have a great set up occurring on the 5min timeframe for a potential long.
We will see how it plays out and will do an update video on this later.

Traders, it's time to pay close attention! 🚨 USDJPY 4H Setup Alert – High-Probability Play Unfolding! 🚨
Traders, it's time to pay close attention! 🧠📊
The USDJPY pair has just perfectly tapped into a key bullish Fair Value Gap (FVG) on the 4-hour chart — a classic move in the smart money playbook. What’s more? We've just seen a clean sweep of internal range liquidity (IRL) — a textbook liquidity grab that signals potential accumulation by larger players. 💥💼
This is not just noise — it's a significant signal. The market structure is hinting at a possible shift in momentum, and bullish pressure is building. The trap has been set, the weak hands have been shaken out, and smart money may be preparing for a strong upward push. 📈🐂
🔮 What’s the next move?
All eyes are now on the external range liquidity (ERL) — a prime liquidity pool sitting above current price levels. If price accelerates toward it, this zone could act as the magnet and the catalyst for the next explosive move upward. 🚀
🔥 Key Points to Watch:
Bullish FVG reaction ✅
IRL liquidity swept ✅
Bullish market structure forming 🏗️
ERL liquidity resting overhead — potential target 🎯
Volume profile & order flow confirming accumulation? 👀
⚠️ Stay alert and don’t chase — let the setup come to you.
Smart money might already be stepping in, and if this momentum follows through, we could be witnessing the beginning of a strong leg up.
Mark your charts and monitor closely — opportunity is knocking. 📍🕵️♂️

NZDUSD - Trade Re-cap Take a look at the NZDUSD trade re-cap.
Here I explain exactly what I was looking for in getting this 1:10RR trade from start to finish.
Hope this helps

NZDUSD - LongWhen the market opens and the spreads die down. Will definitely be entering this trade to the upside.
We are still in a HTF bullish orderflow.
This is a great buy set up as we are at a very discounted price.
Lets see how It plays out

MY BEST TRADE - CRCLCRCL. A beautiful retest on liquidity zone. The stock retraced to exact marked levels and grabbed all the liquidity two times near 102 to 104.
UP 31% till now.

EURUSD, GBPUSD - Outlook for next weekEURUSD - So we have 2x 4 hour POI's (Points Of Interest). Will be looking at potential reversals at both POI's however, within the first POI we have an area of potential liquidity that could look to be taken before we make out move back to the upside.
Therefor, the second POI could look to be our more solid option for our buying options at some point next week.
GBPUSD - This pair looks to be building its liquidity now for potential trades to the upside as today on the lower TF's it was setting quite a few traps for the potential longs and the traders that would have been shorting the breaks below structure to the left.
If you have any questions for me please do let me know

Mitigation Block in Forex Trading: What It Is and How to Use It?What a Mitigation Block Is, and How You Can Use It When Trading Forex?
Understanding specific market mechanisms like mitigation blocks may enhance strategic decision-making. This article delves into the concept of mitigation blocks, detailing their definition, function, and practical application within forex.
Definition and Function of a Mitigation Block
A mitigation block in forex trading refers to a specific order block on a chart that indicates where previous movements have stalled and reversed, marking it as a potential area for future market turns. This concept within the Smart Money framework is crucial for traders looking to manage their positions by taking advantage of strategic entry and exit points.
The idea behind these areas is rooted in the dynamics of supply and demand within forex. When a currency pair reaches a level where buyers or sellers have previously entered the market in force, causing a reversal, it suggests a potential repeat of such actions when the price returns to the area.
Characteristics and How to Identify a Mitigation Block
Mitigation blocks can be bullish or bearish, each with distinct characteristics:
- Bearish Mitigation Block: This type forms during an uptrend and is identified by a significant peak followed by a decline and a failed attempt to reach or surpass the previous high, creating a lower high. When prices drop below the previous low, the order block above the low becomes mitigation. It may be characterised by an increase in selling volume as the price approaches the level, signalling resistance and a potential downward reversal.
- Bullish Mitigation Block: Conversely, a bullish type is established during a downtrend. It is characterised by a significant trough, followed by a rise to form a higher low, and a failure to drop below the previous low. As the pair moves up, the order block below the high marks mitigation one. This area often shows an increase in buying volume as the price approaches, indicating support and a potential upward reversal.
Mitigation Block vs Breaker Block
Mitigation and breaker blocks are both significant in identifying potential trend reversals in forex trading, but they have distinct characteristics that set them apart. A mitigation block forms after a failure swing, which occurs when the market attempts but fails to surpass a previous peak in an uptrend or a previous trough in a downtrend. The pattern indicates a loss of momentum and a potential reversal as the price fails to sustain its previous direction.
On the other hand, a breaker block is characterised by the formation of a new high or low before the market structure is broken, indicating that liquidity has been taken. This means that although the trend initially looked set to continue, it quickly reverses and breaks structure.
In effect, a breaker appears when the market takes liquidity beyond a swing point before reversing the trend. A mitigation appears when the price doesn’t move beyond the trend’s most recent high or low, instead plotting a lower high or higher low before reversing the trend.
How to Use Mitigation Blocks in Trading
Areas of mitigation in trading can be essential tools for identifying potential trend reversals and entry points. When they align with a trader's analysis that anticipates a reversal at a certain level, it can serve as a robust confirmation for entry.
Traders can effectively utilise these zones by simply placing a limit order within the area once it is considered valid. Validation occurs after a new peak or trough is established following the initial failure swing that forms the mitigation area.
If a liquidity void or fair-value gap is present, the trader may look for such a gap to be filled before their limit order is triggered, potentially offering a tighter entry. Stop losses might be placed beyond the failure swing or the most extreme point.
Furthermore, if a mitigation block is identified on a higher timeframe, traders can refine their entry by switching to a lower timeframe. This approach allows for a tighter entry point and potentially better risk management, as it offers more granular insight into the momentum around the area.
Common Mistakes and Limitations
While these blocks are valuable for forex trading, they come with potential pitfalls and limitations that traders should know.
- Overreliance: Relying solely on mitigation blocks without corroborating with other trading indicators can lead to misjudged entries and exits.
- Ignoring Context: Using these zones without considering the broader market conditions may result in trading against a prevailing strong trend.
- Misinterpretation: Incorrect identification can lead to erroneous trading decisions, especially for less experienced traders.
- False Signals: Mitigation blocks can sometimes appear to signal a reversal but instead lead to a continuation of the trend, trapping traders in unfavourable positions.
The Bottom Line
Understanding mitigation blocks offers traders a strategic edge in navigating the forex market. They can be vital for recognising potential price reversals and improving trading outcomes.
FAQs
What Is a Mitigation Block?
A mitigation block in forex trading is an order block that identifies potential reversal points. It signals where a currency pair has previously stalled, indicating strong buying or selling pressure, suggesting a potential for similar reactions in future encounters with these levels.
How Do You Identify a Mitigation Block?
Mitigation blocks are identified by analysing charts for areas where previous highs or lows were not surpassed, leading to a reversal. Traders look for a sequence of movements, including a swing high or low followed by a retracement that fails to exceed the previous swing.
What Is the Difference Between a Breaker Block and a Mitigation Block?
While both indicate potential reversals, a breaker block forms when the price makes a new high or low before reversing, suggesting a temporary continuation of the trend. In contrast, a mitigation block forms without creating a new extreme, indicating a direct loss of momentum and an immediate potential for reversal.
This article represents the opinion of the Companies operating under the FXOpen brand only. It is not to be construed as an offer, solicitation, or recommendation with respect to products and services provided by the Companies operating under the FXOpen brand, nor is it to be considered financial advice.

EURUSD, GBPUSD & EURGBP analysisHere's my outlook on the 3 pairs mentioned in the title. Looking for more upside momentum after we have some sort of pullback into the premium discount prices.
Once we get some15min bearish internal orderflow on the lower Time Frames I will look to enter short term sell positions before looking to take longer term buys on the way back up.
Again, if I can be of any assistance please do let me know and I will be happy to help where I can.

GBPUSD - Long after a structural shiftBased off of yesterdays analysis.
We can see we are fast approaching a very nice POI.
Will post below my mark up chart from yesterday so you can see below. Will now be sending most of my day on the 15min TF waiting for our structural shift to the upside.
Let's see how price plays out today.
Don't just dive into the trade. Wait for your structural shift first.
If I can offer any help please do let me know

GBPUSD - Long at some pointVery similar with what we are looking for in relation to EURUSD
Will wait for a mitigation of the demand at lower price. Will wait for an internal structure break before looking to get long.
Will have a nice sleep now and will re-evaluate in the morning.
Caught 2 lovely trades on this today and hopefully I may be able to catch 1 or 2 more before the week is out.
Again, if you have any questions don't be shy to get in touch

EURUSD - Mark up for the rest of the weekAfter the CPI data was released today we had a lovely upside move. The move has caused us to trade into the previous weak higher timeframe high which I am hoping we can break and close above before the day is out.
I am now focusing on what kind of pullback we may get into out POI's. Because there is no buy side liquidity on the first POI I will need to see a structural shift on the 15min TF to confirm that internal structure swing to move back towards the upside.
If the 1st POI fails to hold I will be more aggressive with my secondary POI as that will be the premium discount price in order for us to move higher.
If that POI fails and we break the 4H structure swing then this could signal we are about to move lower.
If I can be of any assistance to anyone don't be shy to give me a message

GBPUSD - LongI missed the opportunity yesterday.
However, I've been lucky enough to get involved again as of this morning.
4H orderflow is still bullish so we will still look for the longs until the market tells us otherwise.
If I can help with anything do let me know

EURUSD - LongTried to upload this a while ago but for some reason TV was acting up
Im currently in a long position.
We had a 15min structure shift to the upside meaning I was looking at the most relevant place to get long.
Took the entry cased on the 1min timeframe
First target is set at 1.35810
Secondary targets I will be shooting for the HTF high
EURUSD - Long 15min orderflow changeI have set a pending order on EURUSD based on the structure shift and liquidity left behind to the left and now the right.
Entry order placed. lets see what happens on this position.

NZDUSD - Time to buyWhen the market opens and we have a clear longing opportunity to get long on NZDUSD
We have an inducement level to the left and already have a sign of strength to the upside.

USDCAD - Short trade continuationWas triggered in to this on Friday
As we can see we had a pool of liquidity to the left. We then had the news release of NFP.
We were tagged in and then now we are looking to take price to the previous structure lows.
As you can also see we took a lovely trade last week on USDCAD to the downside.
I am still holding 0.5% of that position alongside the current one we have just been tagged into. Very nice potential for continuation to the downside.
If you have any questions for me give me a message

GBPUSD - Very InterestingWith NFP creating massive volatility on Friday this pair is a bit messy.
We have however created an internal structure shift on the 15min timeframe to the downside lower the HTF order flow still being bullish
This could be a case of get what we can to the downside until we hit the HTF demand and look to get long.
As you can see I am already trying to forecast ahead of what could potentially happen with this pair as when it gets to certain levels and there are reactions it will come as no surprise.
If I can be of assistance to anybody please don't hesitate to message.

EURUSDVery important area now for EURUSD
Will the unmitigated OB's on the 1H stand strong or, will we continue lower. due to the HTF area of value.
Took a nice short on the 5min TF for a 1:21 RR.
Now lets see how this plays out should be really interesting
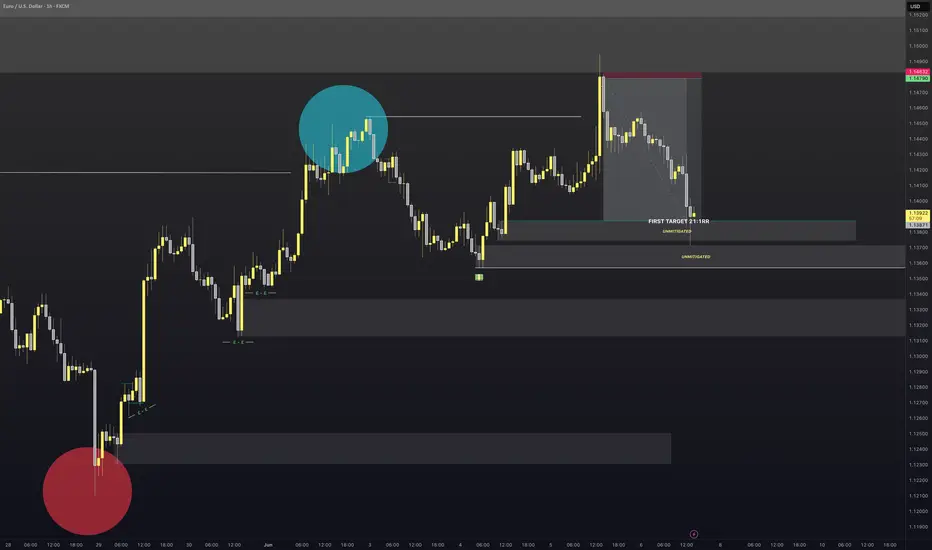
EURUSD - SellEntered this earlier on the 1min TF
Target will be the first Order Block which is 21:RR.
The reason I am targeting here is the 4H order flow is still bullish. So if we can hit the target I close 50% of the position and let the rest ride and manage accordingly to price.
Lets see how it plays out

EURUSD forming a LH swing turning pointThe EUR/USD is creating a lower high (LH) swing turning point before continuing it's upward move to 1.1600 where there is a strong order block.
What this means is that price might retrace down a little before going back up.
Note: Not a trading advice. Just my outlook.

BTCUSD 1H | Liquidity Grab + FVG Play Before Bullish Expansion📊 BTC/USD 1-Hour Smart Money Outlook — May 15, 2025
Bitcoin is setting up for a classic SMC combo move — targeting sell-side liquidity before flipping bullish and running for the buy-side liquidity at ~$106K.
Let’s break it down 👇
🧠 1. The Setup
Price broke structure to the downside ✅
Heading into a liquidity sweep of the recent lows around $100,000
Major Fair Value Gap lies between $98,100–$96,800
This gap aligns with the 61.8–70.5% fib zone — a premium rebalance area for smart money
🔍 2. Expectations
Short-Term Bearish into FVG → Sell-side liquidity gets swept
Then strong bullish reversal targeting:
🔹 First target: $103,000
🔹 Final target: $105,787 (Buy-side liquidity + Weak High)
Trade Idea: Long after FVG rejection confirmation
SL below $96,800, TP up to $106K — insane RRR of 1:4+
⚠️ 3. Risk Management
Wait for a bullish reaction inside the FVG zone
Protect capital if price closes below $96,800 → setup invalid
Look out for NY session volatility and CPI/FOMC-driven fakeouts
This is textbook Smart Money behavior: draw liquidity, rebalance price, and expand into inefficient price zones. If you're not trading with liquidity in mind — you're the liquidity. 🧠💸
💬 Comment “🚀” if you're long from the Fair Value Gap zone!
🎯 Follow @ChartNinjas88 for daily sniper setups and smart money breakdowns!

EURCHF (Order Flow + BOS + Demand + OTE)Hello traders!
As you can see our previous OB was mitigated and now we have BOS 1 H - we see good reaction, but at least 1-5min confirmation and we have green light.
Target new HH.
Have a profitable day and don't forget to subscribe for updates!
