Orderflow
ES still in decision after drop before xmasBond Auction Demand Analysis
The recent 10-year Bond Auction showed weaker demand with a 0.2 tails basis point, indicating reduced investor interest compared to previous auctions. The high bid-to-cover ratio of 2.53 suggests challenges for the stock market rally as investors seek higher yields. A 30-year Bond Auction on January 9th will provide further insights into market trends.
Jobless Claims Report Impact
The Initial Jobless Claims report showed favorable results, which could support a steady move in the market, particularly in the CME_MINI:ESH2025 ES index. Traders are closely monitoring these developments as they assess the implications for interest rates and overall market performance.
Market Reaction and Expectations
During the first session of the US market, there was little decision-making movement, indicating a need for more information on market reactions. With a national holiday approaching and a 30-year Bond Auction scheduled, a quieter market is expected in the interim.
ES on early Jan'25 CME_MINI:ESH2025
Market Balance Dynamics
The market is currently exhibiting a prolonged initial balance on the downside, indicating a period of consolidation.
Accumulation of Passive Buyers
There seems to be a potential accumulation of passive buyers taking advantage of the downtrend, suggesting that buying interest may be building.
Uncertainty in Market Movements
However, it is still too early in the market to predict definitive movements, leaving room for either further downward trends or recovery.
Order Flow / Delta Volume Indicator (PAID)Avoid Trap Trades with the Power of Delta Volume Analysis
The market is full of traps, where traders get caught in false breakouts or misleading price action. The Order Flow / Delta Volume Indicator, as seen on this BTC/USDT chart, acts as a shield against such traps by offering unparalleled insights into market sentiment and trend strength.
Key Observations from the Chart:
1. Delta Volume Line Divergence Saved the Day:
Notice how the Delta Volume Line moves against the trend during moments of potential traps. For example:
• In the highlighted sections, while price appeared to move bullishly, the Delta Volume Line showed decreasing buying pressure, signaling weakness in the trend. This divergence helped avoid entering long positions that could lead to losses.
• Similarly, during bearish traps, the Delta Volume Line indicated reduced selling pressure, providing clarity and preventing premature shorts.
2. Reliable Trend Confirmation:
The indicator aligns perfectly with price action when the trend is strong, confirming entries and exits. It ensures that traders remain on the right side of the market, minimizing emotional decisions and maximizing profits.
3. Avoiding Choppy Market Losses:
During sideways markets or false breakouts, the Delta Volume Line acts as a guiding beacon. The lack of alignment between price movement and delta volume imbalance highlights potential no-trade zones, as demonstrated in choppy areas of the chart.
4. Dynamic Background for Trend Sentiment:
The green and red background clearly illustrates bullish and bearish zones, helping traders visually gauge the dominant market sentiment without overanalyzing every candle.
How It Helps in Live Trading:
• Trap Avoidance: Delta Volume Line divergence is a game-changer. It cuts through misleading price movements and focuses on the actual pressure in the market.
• Trend Clarity: Helps identify whether buying or selling pressure aligns with the current price movement, giving confidence in trade entries.
• Volume-Weighted Insights: Filters out false signals by integrating VWAP and volume metrics, ensuring only high-quality setups are considered.
Conclusion:
This BTC/USDT chart is a testament to the power of the Order Flow / Delta Volume Indicator. It isn’t just a tool—it’s a roadmap for navigating volatile markets with confidence. The Delta Volume Line, in particular, offers a level of precision and reliability that helps traders avoid traps and capitalize on real opportunities.
Trade smarter, avoid traps, and stay ahead of the market with this essential indicator. Let the Delta Volume Line guide your next
What Is ICT Turtle Soup, and How Can You Use It in Trading?What Is ICT Turtle Soup, and How Can You Use It in Trading?
The ICT Turtle Soup pattern is a strategic trading approach designed to exploit false breakouts in financial markets. By understanding and leveraging liquidity grabs, traders can identify potential reversals and enter trades with relative precision. This article delves into the components of the ICT Turtle Soup pattern, how to identify and use it, and its potential advantages and limitations, providing traders with valuable insights to potentially enhance their trading strategies.
The ICT Turtle Soup Pattern Explained
ICT Turtle Soup is a trading pattern developed by the Inner Circle Trader (ICT) that focuses on exploiting false breakouts in the market. This ICT price action strategy aims to identify and take advantage of situations where the price briefly moves beyond a key support or resistance level, only to reverse direction shortly after. This movement is often seen in ranging markets where prices oscillate between established highs and lows.
The concept behind ICT Turtle Soup trading is rooted in the idea of liquidity hunts and market imbalances. When the price breaks out, it often triggers stop-loss orders set by other traders, creating a temporary imbalance. The ICT Turtle Soup strategy seeks to capitalise on this by entering trades in the opposite direction once the breakout fails and the price returns to its previous range.
The pattern is named humorously after the original Turtle Traders' strategy, which focuses on genuine breakouts. In contrast, ICT Turtle Soup takes advantage of these failed attempts, thus "making soup out of turtles" by transforming unproductive breakout attempts into potentially effective trades.
Typically, traders look for specific signs of a false breakout, such as a price briefly moving above a recent high or below a recent low but failing to sustain the move. This strategy is particularly effective when used in conjunction with other ICT concepts, such as higher timeframe analysis and understanding of market structure.
Components of the ICT Turtle Soup Pattern
To effectively utilise the ICT Turtle Soup setup, it’s essential to understand its core components: order flow and market structure, liquidity, and internal versus external liquidity.
Order Flow and Market Structure
Order flow and market structure are critical in analysing the ICT Turtle Soup pattern. This involves observing price movements and traders' behaviour in different timeframes. Traders can analyse higher and lower timeframe price movements in FXOpen’s free TickTrader platform.
Higher Timeframe Structure
This refers to the broader trend governing the lower timeframe trend. For traders using the 15m-1h charts to trade, this might mean structure visible on 4-hour, daily, or weekly charts.
Higher timeframe structures help traders identify the major support and resistance levels. These levels are essential as they mark the boundaries within which the market generally oscillates. Traders use these to determine the prevailing market direction and potential areas where false breakouts (stop hunts) are likely to occur.
Lower Timeframe Structure
Lower timeframe structures are examined on hourly or minute charts. These provide a more detailed view of price action within the higher timeframe’s range and account for the bullish and bearish legs that dictate a broader higher timeframe trend.
Liquidity and Stop Hunts
In general trading terms, liquidity represents how easy it is to enter or exit a market. However, in the context of the ICT Turtle Soup pattern, areas of liquidity can be identified beyond key swing points.
Stop Hunts
Stop hunts, also known as a liquidity sweep, occur when the price temporarily moves above a resistance level or below a support level to trigger stop-loss orders. This movement creates a liquidity spike as traders' stops are hit, providing a favourable condition for the price to reverse direction. ICT Turtle Soup traders seek to exploit these moments by entering trades opposite to the initial breakout direction once the liquidity is absorbed.
Internal and External Liquidity
Understanding internal and external liquidity is vital for applying the ICT Turtle Soup pattern effectively.
Internal Liquidity
This refers to the liquidity available within the range of the higher timeframe structure. It involves identifying smaller support and resistance levels within the larger range. For example, in a bullish leg, there will be a series of higher highs and higher lows; beneath these higher lows is where internal liquidity rests. This internal liquidity will be targeted to form a bearish leg as part of a higher timeframe bullish trend.
External Liquidity
This involves liquidity that exists outside the key highs and lows of the higher timeframe trend. To use the example of the bullish leg in a higher timeframe bullish trend, the low it originated from and the high it creates as the bearish retracement begins count as areas of external liquidity.
Order Blocks and Imbalances
While not directly involved in the ICT Turtle Soup setup, understanding order blocks and imbalances can provide insight into where the price might head and the general market context.
Order blocks are areas where significant buying or selling activity has previously occurred, often due to institutional orders. These blocks represent zones of support and resistance where the price is likely to react.
Bullish Order Blocks
These are typically found at the base of a significant upward move and indicate zones where buying interest is strong. When the price revisits these areas, it often finds support, making them potential entry points for long trades.
Bearish Order Blocks
Conversely, these are located at the top of significant downward moves and signal strong selling interest. These zones often act as resistance when revisited, making them strategic points for short trades.
Imbalances
Imbalances, or fair value gaps (FVGs), are price regions where the market has moved too quickly, creating a significant disparity between the number of long and short trades. These gaps often occur due to high volatility and indicate areas where the market might revisit to "fill" the gap, thereby achieving fair value.
In other words, when a price rapidly moves in one direction, it leaves behind an area with little to no trading activity. The market often returns to these imbalanced zones to facilitate proper price discovery and liquidity.
How to Use the ICT Turtle Soup Strategy
Here's a detailed breakdown of how traders use the ICT Turtle Soup pattern.
Establishing a Bias
Traders begin by analysing the higher timeframe trend, such as the daily or weekly charts, to establish a market bias. This analysis helps determine whether the market is predominantly bullish or bearish. Identifying this trend is crucial as it guides where to look for potential Turtle Soup setups.
For instance, the example above shows AUDUSD initially moving down after a bullish movement off-screen. It eventually breaks above the lower high, indicating that the higher timeframe trend may now be bullish. Similarly, the shorter-term downtrend beginning from mid-May also saw a new high, meaning a trader may want to look for long positions.
Identifying Internal Liquidity
Once the higher timeframe trend is established, traders look for a move counter to that higher timeframe trend. In the example shown, this would be a downtrend counter to the bullish structure break. They mark levels of internal liquidity; in a bullish leg, these would be below swing lows and vice versa. These areas are likely to attract stop-loss orders.
Looking for Liquidity Taps
The next step involves waiting for these internal liquidity areas to be tapped. This typically happens when the price briefly breaks through a support or resistance level, triggering stop-loss orders before quickly reversing direction.
Ideally, the price should tap into the same area or order block where the internal liquidity formed and then exhibit a quick reversal, often leaving just a small wick. This movement indicates a liquidity grab, where large players have taken out stops to facilitate their own orders.
Lower Timeframe Confirmation
After identifying a liquidity grab beyond this internal liquidity level, traders look for an entry. On a lower timeframe, they look for a similar pattern: internal liquidity being run and a subsequent break of structure in the direction of the higher timeframe trend. This involves price retracing back inside the range to fill an imbalance and meet an order block, which provides a precise entry point.
Executing the Trade
Once these conditions are met, traders typically enter the market. Specifically, they’ll often leave a limit order at an order block to trade in the direction of the higher timeframe trend. They place a stop loss just beyond the liquidity grab, either above the recent high for a short trade or below the recent low for a long trade. Profit targets are often set at key liquidity levels, such as previous highs or lows, where the market is likely to encounter significant activity.
Potential Advantages and Limitations
The ICT Turtle Soup pattern is a trading strategy with several potential benefits and drawbacks.
Advantages
- Precision: Allows for precise entry points by identifying false breakouts and liquidity grabs.
- Adaptability: Effective across different timeframes and market conditions, including ranging and trending markets.
- Risk Management: Built-in risk management by placing stop losses just beyond the liquidity grab points.
Limitations
- Complexity: Requires a deep understanding of market structure, liquidity, and order flow, making it challenging for less experienced traders.
- Market Conditions: Less effective in highly volatile or illiquid markets where false signals are more common.
- Time-Consuming: Demands continuous monitoring of multiple timeframes to identify valid setups, which can be time-intensive.
The Bottom Line
The ICT Turtle Soup pattern offers traders a powerful tool to identify and exploit false breakouts in the market. By understanding its components and applying the strategy effectively, traders can potentially enhance their trading performance. To put this strategy into practice, consider opening an FXOpen account, a reliable broker that provides the necessary tools and resources for trading.
FAQs
What Is ICT Turtle Soup in Trading?
ICT Turtle Soup is a trading pattern that exploits false breakouts. It identifies potential reversals when the price briefly moves beyond a key support or resistance level, triggering stop-loss orders before reversing direction. This strategy aims to take advantage of these liquidity grabs by entering trades opposite to the initial breakout direction.
How to Identify ICT Turtle Soup Conditions?
To identify the ICT Turtle Soup pattern, traders analyse higher timeframe trends to establish market bias. They then look for counter-trend moves and mark internal liquidity areas. The pattern is identified when the price taps these liquidity zones and reverses quickly, often leaving a small wick. This signals a liquidity grab and potential trade setup in the direction of the higher timeframe trend.
How to Use the ICT Turtle Soup Pattern?
Using the ICT Turtle Soup pattern involves several steps. First, traders establish a market bias based on higher timeframe analysis. Then, they look for liquidity grabs at marked internal liquidity areas, indicating false breakouts. The next step is to confirm the setup on a lower timeframe by observing a similar liquidity grab and structure break. Lastly, they enter trades in the direction of the higher timeframe trend, placing stop losses just beyond the liquidity grab and targeting key liquidity levels for profit-taking.
This article represents the opinion of the Companies operating under the FXOpen brand only. It is not to be construed as an offer, solicitation, or recommendation with respect to products and services provided by the Companies operating under the FXOpen brand, nor is it to be considered financial advice.
Going Long on ETH: Strong Bullish Signals!Ethereum (ETH) is currently experiencing a bullish trend, supported by several key fundamentals:
Global Adoption and Institutional Interest
The cryptocurrency market, particularly Ethereum, is seeing increased adoption and institutional interest. Major financial institutions and corporations are exploring blockchain technology and decentralized finance (DeFi) applications, many of which are built on the Ethereum network.
Technological Advancements
Ethereum's ongoing upgrades and improvements, including the transition to Ethereum 2.0, are enhancing its scalability and efficiency. These developments are attracting more developers and users to the platform, potentially driving up demand for ETH.
Market Sentiment
Recent market analysis suggests a positive outlook for Ethereum, with some experts predicting significant growth potential. The breaking out of key resistance levels has fueled optimism among traders and investors.
Utilizing Probabilities for Long Positions
I'm employing probability-based strategies to enter long positions on ETHUSD.
By incorporating probability analysis into my trading approach, I aim to capitalize on Ethereum's bullish fundamentals while maintaining a structured and disciplined trading strategy.
Let's dive in!
2W:https://www.tradingview.com/x/t6j2hT4t/
2H:https://www.tradingview.com/x/prwKqAhU/
Short Position on EURCAD: Strong Potential for TP SuccessKey Fundamentals Supporting a Bearish Bias:
- Eurozone Struggles: Recent economic reports indicate that the Eurozone is facing challenges, including sluggish growth and rising inflation. This could weaken the Euro as investors lose confidence.
- Interest Rate Outlook: The European Central Bank is taking a cautious stance on interest rates, while the Bank of Canada is likely to raise rates. This contrast could strengthen the Canadian Dollar against the Euro.
- Geopolitical Pressures: Ongoing issues in Europe, such as energy crises and trade disruptions, are creating uncertainty. This instability can further drag down the Euro's value relative to the CAD.
I'm focusing on short positions for EURCAD by using probabilities derived from historical data. By analyzing past trends and applying straightforward mathematical rules, I can spot high-probability trading opportunities.
This strategy helps me stay disciplined and make informed decisions, reducing emotional trading and increasing my chances of success.
Let's dive into the multiple timeframe top-down analysis together:
12M:
1D:
Hourly Entry:
Why EURUSD is Plummeting and How You Can Take Advantage of ItI am adopting a bearish bias on EUR/USD and will leverage probabilities derived from statistical and historical data to position myself for short trades.
By analyzing past market trends and current economic indicators, I aim to make informed decisions that enhance my trading success.
Key Fundamentals Supporting a Bearish Outlook:
- Interest Rate Differentials: The U.S. Federal Reserve is likely to maintain higher interest rates, which strengthens the USD against the EUR, especially as the European Central Bank (ECB) may consider rate cuts in response to economic challenges.
- Economic Performance: Recent economic data indicates that the Eurozone is facing significant headwinds, with disappointing growth figures that negatively impact market sentiment.
- Market Sentiment: Current market sentiment leans bearish towards the euro, with many traders already positioned short. This collective positioning could lead to further downward pressure on the EUR/USD pair.
These elements provide a solid foundation for my bearish outlook, making it an opportune moment to enter short positions.
1W:
HOURLY ENTRY:
If you require additional clarification, or wish to share your thoughts, don’t hesitate to drop a comment below!
Bullish Outlook on XRPUSDKey Reasons for a Bullish Bias:
1. Positive Market Sentiment: XRP has recently broken through an important resistance level, which shows that traders are feeling optimistic about its future.
2. Bullish Technical Patterns: An inverted Head and Shoulders pattern has formed, suggesting that XRP might be ready for a price increase.
3. Improving Regulations: Recent developments in cryptocurrency regulations are becoming more favorable, which could attract more institutional investors to XRP.
I plan to use probabilities based on historical data and the X1X2 methodology to enter long positions in XRP. Here’s why:
- Learning from the Past: By looking at past price movements and historical data of XRP, I can spot biases that might help predict future behavior.
- X1X2 Methodology: This method helps me identify key price levels to enter and exit trades, making my strategy more focused.
- Smart Risk Management: By using probabilities, I can set stop-loss orders at strategic points, reducing my risk and making more informed decisions.
In summary, with a positive market outlook and a solid trading strategy based on historical data and mathematical rules, I’m confident in taking long positions in XRPUSD.
Traders, if you found this idea helpful or have your own thoughts on it, please share in the comments. I’d love to hear from you!
12M:
2W:
1H:
Probabilities Powering BTCUSD TradesUtilizing probabilities based on historical data is a cornerstone of my bullish strategy for BTCUSD. Here’s why I believe this approach is not only effective but essential for positioning long trades successfully.
Understanding the Importance of Probabilities
Probabilities in Trading
Trading is inherently uncertain, and relying on probabilities allows traders to make informed decisions rather than guesses. By analyzing historical price movements and patterns, we can identify trends that have previously led to upward or downward movements. This statistical approach helps mitigate risks associated with emotional decision-making.
Historical Data as a Guide
Historical data provides a wealth of information about how BTCUSD has reacted under various market conditions. By employing a mechanical trading strategy that incorporates these indicators, I can increase my chances of entering profitable trades.
Mechanical Trading Strategy
What is a Mechanical Trading Strategy?
A mechanical trading strategy is a systematic approach that uses predefined rules based on historical data to make trading decisions. This method eliminates emotional bias and ensures consistency in trade execution.
Benefits of a Mechanical Approach
1. Consistency: Adhering to a mechanical strategy means that trades are executed based on data rather than emotions.
2. Backtesting: Historical data allows for backtesting strategies to see how they would have performed in the past, providing confidence in their potential effectiveness.
3. Risk Management: By employing probabilities, I can better manage risk through calculated position sizing and stop-loss orders.
Current Market Context
In the current market environment, BTCUSD shows signs of bullish momentum. The formation of higher lows indicates strength, and historical patterns suggest that we may be at the beginning of another significant upward trend. By leveraging probabilities derived from past performance, I am positioning myself to capitalize on this potential movement.
Conclusion
In summary, utilizing probabilities based on historical data through a mechanical trading strategy equips me with a robust framework for entering long positions in BTCUSD. This approach not only enhances my decision-making process but also aligns with my overall bullish bias. As we navigate the complexities of the crypto market, relying on data-driven strategies will be crucial for achieving success in our trades.
1D:
6H:
LTCUSD: Strong Bullish Momentum with 68.87% Probability for TP1!I’m optimistic about Litecoin (LTCUSD) right now, and here are some compelling reasons to consider this trade:
- Market Recovery: The overall cryptocurrency market is bouncing back, with many coins, including Litecoin, showing positive price movements after recent dips.
- Growing Adoption: More people and businesses are starting to use cryptocurrencies for transactions, which could increase demand for Litecoin.
- Tech Improvements: Litecoin is undergoing updates that make it more efficient and user-friendly, attracting more interest.
- Positive Sentiment: Many analysts are optimistic about the future of cryptocurrencies, suggesting that prices could continue to rise.
To get positioned for long trades on LTCUSD, I rely on probabilities based on historical data in a mechanical trading system.
In short, my bullish outlook on LTCUSD is supported by strong market fundamentals, and by using probabilities from historical data, I aim to position myself effectively for potential long trades.
Please share your ideas and charts in the comments section below!
12M:
2W:
6H:
NZDUSD: Bullish Sentiment Backed by Math and History!Why Use Probabilities?
In trading, probabilities help us make informed decisions based on mathematical rules and historical data. By analyzing past price movements and market behavior, we can identify patterns that suggest potential future outcomes.
This approach allows us to assess the probability of reaching Take Profit Levels.
Utilizing probabilities means I'm not just guessing; I'm relying on statistical evidence to position myself effectively in the market. This strategy helps manage risk and increases confidence in my trades, making it easier to navigate the uncertainties of forex trading.
Let's dive in:
12M:
2W:
6H:
Why I’m Betting Bearish on GBPNZD: Key Market Drivers ExplainedAs I prepare to share my trade idea for GBPNZD, my overall bias is bearish. Here are some key fundamentals currently influencing this outlook:
1. UK Economic Slowdown: The UK is facing economic challenges, with high inflation and downgraded growth forecasts. This situation tends to weaken the British Pound against other currencies, including the New Zealand Dollar.
2. RBNZ's Hawkish Stance: The Reserve Bank of New Zealand (RBNZ) is likely to maintain a strong monetary policy, focusing on controlling inflation. This contrasts sharply with the UK's more cautious approach, which supports a stronger NZD.
3. Seasonal Trends: Historically, GBPNZD has shown a bearish trend from mid-August through December. This seasonal behavior suggests that now is an opportune time to consider short positions.
In my trading strategy for GBPNZD, I rely on probabilities to guide my decisions for entering short positions.
In summary, by leveraging probabilities based on historical data and current market fundamentals, I aim to position myself advantageously for short trades on GBPNZD.
This disciplined approach aligns with my bearish outlook and enhances my trading effectiveness.
I look forward to sharing my journey in this trade and welcome any thoughts or feedback!
2W:
Hourly TF:
Why I'm Going Short on USDCAD: Analyzing Market ConditionsKey Reasons for a Bearish Outlook
1. Economic Differences: The U.S. economy is doing well, showing strong growth, while Canada’s economy is struggling. This usually strengthens the U.S. dollar against the Canadian dollar.
2. Oil Prices: Canada’s currency is closely tied to oil prices. If oil prices stabilize or drop, it could weaken the Canadian dollar further, especially since Canada’s economy isn’t performing well.
3. Central Bank Policies: The U.S. Federal Reserve might lower interest rates, which could attract more investment into the U.S. dollar. Meanwhile, the Bank of Canada is likely to stay cautious due to weak economic data.
Given these factors, I believe there’s a good chance for USDCAD to move lower. I’ll be using probabilities to guide my short positions and manage risk effectively.
Feel free to share your thoughts and ideas in the comments below!
12M:
On the 12M timeframe, there is insufficient data available. Therefore, we will move to lower monthly timeframes to identify a valid range and look for FB mitigation.
1M:
1D:
1H:
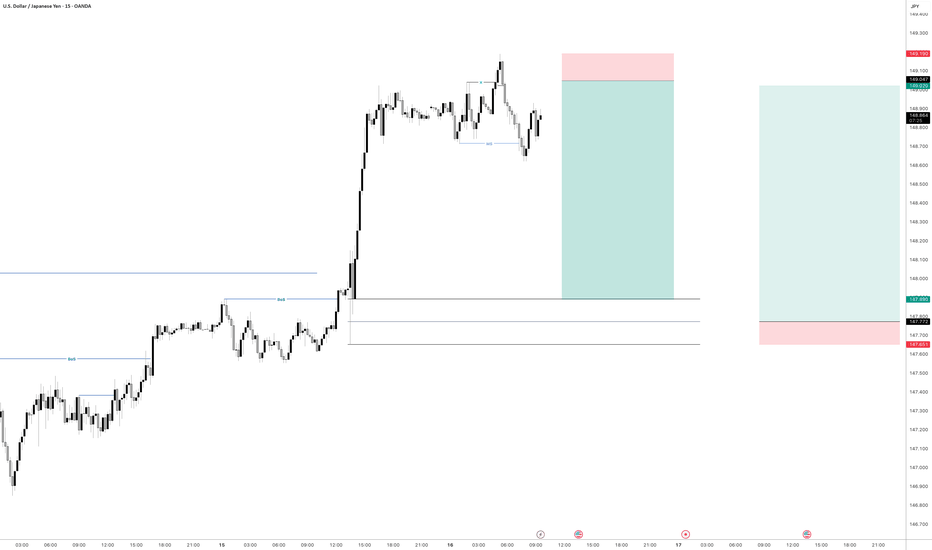
Fundamentals Favoring a Bullish USDJPY:What Traders Need to KnowIn today's trading environment, the USD/JPY currency pair presents a bullish opportunity. Here are some key fundamentals that support this bias, along with an explanation of utilizing probabilities for positioning long trades.
Key Fundamentals Supporting a Bullish Bias on USD/JPY
1. Bank of Japan's (BoJ) Monetary Policy: The BoJ has maintained its accommodative monetary policy, refraining from committing to predefined rate hikes for the remainder of the year. This stance is likely to weaken the Japanese Yen against the U.S. Dollar as traders anticipate continued divergence in monetary policy between the Fed and the BoJ.
2. U.S. Economic Growth: Recent data indicates a pickup in U.S. economic growth without significant inflationary pressures. This environment supports a stronger U.S. Dollar as it suggests that the Federal Reserve may not need to cut rates aggressively, contrary to some market expectations.
3. Market Sentiment: The overall sentiment in the forex market is leaning towards a bullish outlook for the U.S. Dollar, particularly against currencies like the Yen, which is under pressure due to Japan's economic conditions and the BoJ's policies.
Utilizing Probabilities for Long Positions in USD/JPY
When trading, I prioritize using probabilities to enhance my decision-making process.
In conclusion, by focusing on probabilities and key fundamental indicators, I am strategically positioning myself for potential long trades in USD/JPY.
This method not only enhances my trading confidence but also provides a structured approach to navigating market volatility effectively.
Let's dive into my comprehensive top-down analysis together:
12M:
2W:
1H:
XRPUSD: Bullish Setup AheadAs I prepare to share my bullish trade idea for XRPUSD on TradingView, several key global fundamentals align with my positive outlook. Here are a few significant factors to consider:
1. Regulatory Clarity: Recent developments in cryptocurrency regulation, particularly favorable rulings for Ripple Labs, have boosted market confidence. This clarity is essential for institutional investment and long-term growth in the crypto space.
2. Market Sentiment: The overall sentiment in the cryptocurrency market has shifted positively, with many traders anticipating a bullish trend. Indicators such as the MACD and Stochastic Oscillator suggest potential upward momentum, reflecting a growing interest in XRP as a viable investment option.
3. Technical Analysis: Current technical indicators show that XRP is poised for significant moves. The Relative Strength Index (RSI) is in a neutral to slightly bullish zone, indicating room for further upside before reaching overbought conditions.
In my trading strategy, I will utilize probabilities to position myself for long trades in XRPUSD.
Share Your Thoughts in the Comments Below!
12M:
2W:
4H:
AUDCAD: Leveraging Probabilities for Strategic Long PositionsKey Fundamentals Supporting Bullish Bias:
- Recent strength in commodity prices, particularly iron ore, benefiting Australia's export-driven economy
- Expectations of a less hawkish stance from the Reserve Bank of Australia, potentially supporting economic growth
- Relative weakness in the Canadian dollar due to concerns over the housing market and oil price volatility
By utilizing probabilities in chart analysis, I can identify optimal entry points for AUDCAD longs while managing risk effectively. This approach allows for a more systematic trading strategy, aligning with the current bullish bias in the AUDCAD pair.
12M:
2W:
HOURLY TF:
61.69% Probability for Bullish USOIL TP!Key Fundamentals Supporting a Bullish Outlook:
- OPEC+ Production Cuts: OPEC+ has implemented production cuts to stabilize oil prices, which can lead to a tighter supply and potentially higher prices for crude oil.
- Geopolitical Tensions: Ongoing geopolitical issues, particularly in oil-producing regions, can disrupt supply chains, leading to increased prices as markets react to potential shortages.
- Economic Recovery Signals: As global economies continue to recover from the pandemic, demand for oil is expected to rise, further supporting bullish sentiment in the market.
By combining a bullish bias with a probabilistic approach to trading, I aim to position myself advantageously in the market while managing risks effectively.
Feel free to share your thoughts in the comments below!
2W:
2H: