Market Re-Cap and Outlook for NEXT WEEKHere I am giving you a little insight as to what trades I am currently in, taken & looking to take for the week just gone and the week coming.
1 Winning trade on EU
1 Current open position on EU
EURGPB - Breakdown
AUDUSD - Breakdown
NZDUSD - Breakdown
Gold - Breakdown
If there are any pairs you would like me to share my feedback on give me a message and I will be happy to try and do so.
Thanks
Happy Hunting
Orderflow

EURUSD - Potential buying opportunityLooking at EURUSD
We are still very bullish with no sign of it slowing.
I am aware of a potential weekly liquidity point to the left, however, until EURUSD shows its hand it's important that we still remain bullish.
We have set up a lovely liquidity point before a lovely demand area.
So I will be setting a pending order at the demand area after the New York close and the Asian session begins.

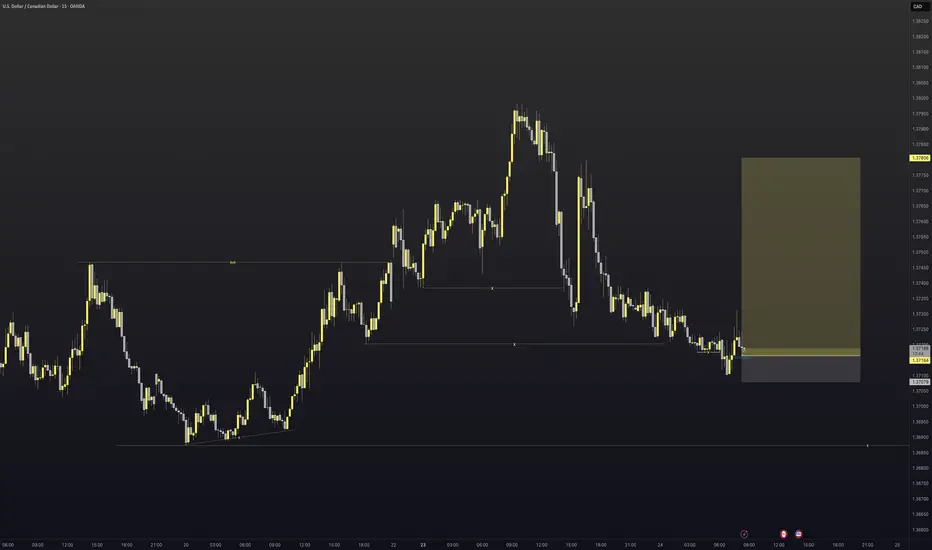
USDCAD - Long triggered We have entered into the discount area of the most recent swing point on USDCAD. With doing this we have taken out all the areas of liquidity within the trading range so it was time to look for potential long moves.
Now at current price we have had a great example of AMD where by we
Accumulate
Manipulate
and then the hope is that we begin to distribute higher.
There was also a nice fair value gap that was left behind on the 5min
So all that was left to do was execute.
Let us see how it plays out.
Win or lose great entry super happy with the trade. Lets see how it goes
Played it perfectly: grabbed long liquidity and rode down to ourHey everyone!
Move unfolded exactly as we planned:
Minor price spike – a classic false breakout to collect liquidity in the long zone.
No valid short formation, so I stayed sidelined during that spike.
Once long liquidity was swept, the market reversed sharply downward—right toward our objective.
Price then steadily slid to our lower target, closing the trade with the planned profit.
📊 Key takeaways:
Don’t force entries without clear setups.
Liquidity grabs in line with your overall scenario are powerful signals.
Patience and discipline remain the ultimate edge.
What are your thoughts? Share your experiences with similar liquidity hunts!

ETH - ORDER BOOK - BIG LEVELS Ethereum Order Book Analysis | Key ETH Levels Revealed (Real-Time Liquidity Zones)
In this video, we dive into the Ethereum (ETHUSD) order book to uncover major liquidity levels that could influence price action in the short and medium term. By analyzing real-time data, we identify where whales and institutions are placing large orders, which often act as strong support and resistance zones.
What You’ll Learn:
• How to spot large buy/sell walls on the ETH order book
• Why these levels matter for short-term traders
• Real-time reactions to major liquidity zones
• Potential long/short trade setups around key areas
This is essential viewing if you’re trading ETH intraday or swing, and want to anticipate where the next major move may come from.
⸻
Tools Used:
• ETHUSD price chart
• Real-time order book data
• Volume heatmaps
• Liquidity zone mapping
• Sentiment Tool
⸻
Stay ahead of the crowd by understanding how the market reacts to big players’ order placements. Don’t forget to leave a comment with your ETH target, and follow for more pro-level crypto analysis.
⸻
#Ethereum #ETHUSD #ETHAnalysis #CryptoTrading #OrderBook #ETHOrderFlow #LiquidityLevels #CryptoTA #PriceAction #WhaleWatching

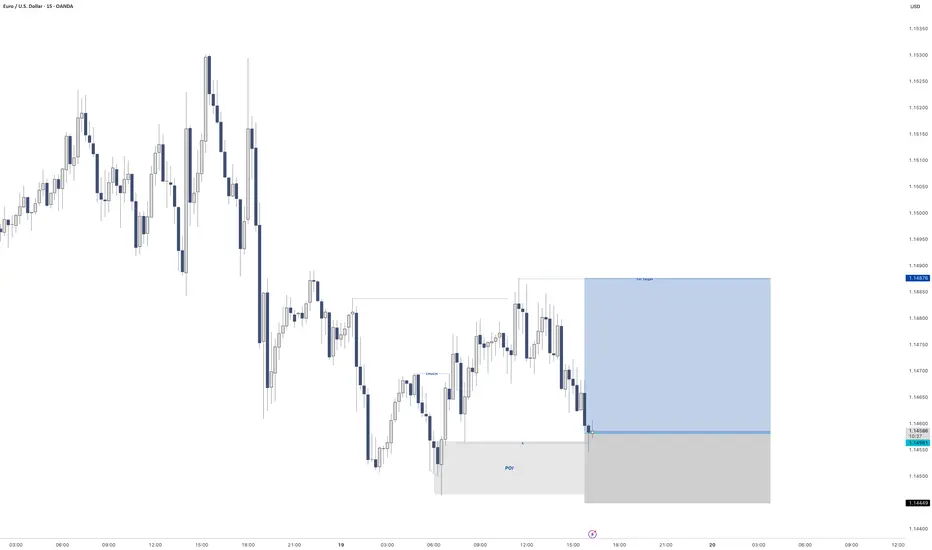
EURUSD - 2nd potential entryEvening all
Here is a still screenshot of what I am looking for the market open on EURUSD come Sunday night after the spreads have died down on the pair.
My pending order will go directly on the FVG with my stops below the manipulation of the range.
If I get tagged in great. If I don't also great if we continue to move high I mill just manage the one position.
If I am tagged in I will give you and update with a new idea and then depending on how that idea plays out win or lose I will come back and re-visit it and break it down some more.
However I have high hopes for this trade to make it up to 1.16300
Have a great weekend
and I will speak to you all soon

EURUSD - BreakdownApologies video is a bit rushed.
Wanted to get it done before the weekend arrived.
There's so much more to this video and entry reason that I have left out unintentionally like the fact we swept the Asia lows before creating a BoS. There are also a few other things like I have left out but without looking at the chart right now I cannot remember off the top of my head.
I will post the idea of this trade below so you can see that I was taking it before it played out.
Hope you all have a great weekend and a better trading week than you had this week.
Enjoy
P.S if you have any questions please do message

EURUSD - LongGreat set. Very close to Demand on the HTF to the left.
CHoCH on the 15min that left behind some liquidity.
Also created some liquidity to the right.
Very nice set up for me.
Triggered into the trade
Lets see how we go
EURUSD - SHORT We have built up quite a lot of liquidity before our major supply zone.
Will give an update in the morning after seeing where price is at

GOLD - Selling opportunity on the horizonLooking at gold.
We have a nice bearish continuation orderflow on the 15min TF.
We have a nice potential inducement level of liquidity that we are more than likely to take before moving lower.
This is a reduced risk entry due to where we are on the higher TF as we are pulling into a potential demand zone on the higher timeframe.
ITS REALLY IMPORTANT to remember where we are in terms of structure and as we well know Gold doesn't tend to fall for to long as it remains bullish the majority of the time. so in regards to the HTF like I mentioned above we are still bullish so we are expecting a reversal for the longer term at some point in the near future so this could be a case of get what we can from the market and then look for our LTF orderflow to switch Bullish before then looking for them long entries

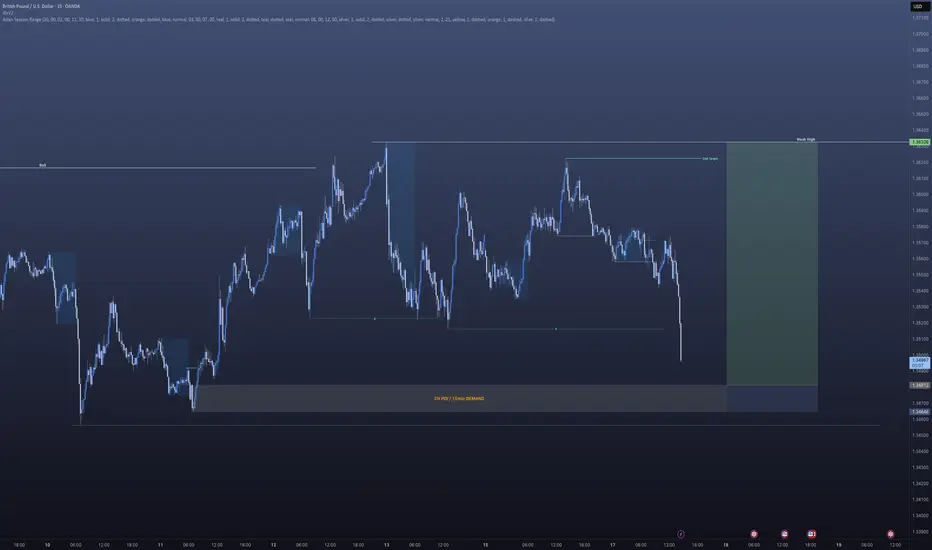
GBPUSD - Next point of interestAfternoon All,
So our GBPUSD trade from earlier didn't quite go to plan however I knew full well that we were building liquidity to the left on the higher timeframe.
This will be my next point of interest for a potential long.
Lets see how price plays out when we get down there.
GBPUSD - LongUnfortunately I can't post the idea on the 5min to give you a better idea of where we are at in terms of the entry for this.
However I am looking to be tagged into this trade and have a limit order where I have set it.
Hoping to be tagged in. If we aren't we move on. and if we lose we move on.
If im able to help with any questions you may have do send them my way

GBPUSD - LONG Looking at GBPUSD
We have a great set up occurring on the 5min timeframe for a potential long.
We will see how it plays out and will do an update video on this later.

NZDUSD - Trade Re-cap Take a look at the NZDUSD trade re-cap.
Here I explain exactly what I was looking for in getting this 1:10RR trade from start to finish.
Hope this helps

EURUSD, GBPUSD - Outlook for next weekEURUSD - So we have 2x 4 hour POI's (Points Of Interest). Will be looking at potential reversals at both POI's however, within the first POI we have an area of potential liquidity that could look to be taken before we make out move back to the upside.
Therefor, the second POI could look to be our more solid option for our buying options at some point next week.
GBPUSD - This pair looks to be building its liquidity now for potential trades to the upside as today on the lower TF's it was setting quite a few traps for the potential longs and the traders that would have been shorting the breaks below structure to the left.
If you have any questions for me please do let me know

EURUSD, GBPUSD & EURGBP analysisHere's my outlook on the 3 pairs mentioned in the title. Looking for more upside momentum after we have some sort of pullback into the premium discount prices.
Once we get some15min bearish internal orderflow on the lower Time Frames I will look to enter short term sell positions before looking to take longer term buys on the way back up.
Again, if I can be of any assistance please do let me know and I will be happy to help where I can.

XAUUSD Daily Plan — June 13, 2025 By GoldFxMinds👋 Hello traders, and welcome to your full preparation for tomorrow’s gold session.
Gold continues to respect its structural map while liquidity traps remain active on both sides of the range. We’ve seen clean sweeps and fast reactions this week, but tomorrow brings a new catalyst: key U.S. data combined with fresh geopolitical tensions that may fuel additional volatility before the weekly close.
🌐 MACRO & GEOPOLITICAL OUTLOOK:
📊 Prelim UoM Consumer Sentiment & Inflation Expectations are scheduled tomorrow:
Consumer Sentiment ➔ 52.2
Inflation Expectations ➔ 6.6%
These data points often trigger sharp USD moves and liquidity grabs.
🌍 Geopolitical tension has increased as President Trump authorized the evacuation of U.S. personnel from several Middle East locations due to rising threats in the region, particularly concerning the Iran nuclear situation.
This development triggered sharp moves across commodities, with oil rallying strongly.
Gold remains well-supported in this environment as global risk sentiment deteriorates.
Traders should expect elevated intraday volatility and potential liquidity sweeps on both sides as markets digest these developments.
🔎 The combination of macro data and geopolitical risk creates highly reactive conditions where liquidity hunts may precede any clear directional moves.
🔎 STRUCTURE OVERVIEW:
Price remains inside premium territory after recent bullish expansions.
Liquidity has already been taken above and below earlier this week, but additional traps may unfold before Friday’s close.
Larger structure remains bullish while short-term supply zones may attract quick inducements.
Tomorrow's flow will likely begin with manipulation during or after news, before real momentum develops.
🎯 BIAS
Main bias: Controlled bullish, but highly reactive inside premium.
As long as price holds above 3340, bulls remain in control on higher timeframe.
However, premium zones above 3395 may act as liquidity traps, inviting fast selloffs after inducements.
Best opportunities likely to come from either:
Controlled retracement into buy zones for continuation higher.
Fast spikes into premium traps for short-term sell opportunities.
Patience will be critical as both news and geopolitical headlines may trigger manipulations before real trend unfolds.
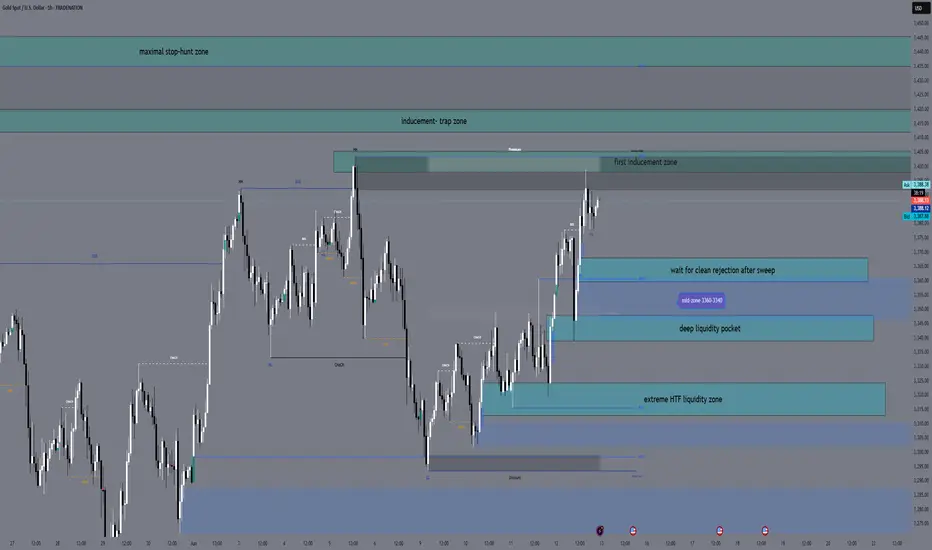
🔑 KEY ZONES TO WATCH:
BUY ZONES
🔵 3368 - 3360
Intraday pullback zone.
Look for minor liquidity dips followed by bullish rejection.
Targets: 3390 → 3405.
🔵 3348 - 3340
Deeper liquidity pocket into H4 imbalance and OB.
Engage only after strong downside sweep with sharp bullish reaction.
Targets: 3380 → 3396.
🔵 3325 - 3312
Extreme HTF liquidity zone.
Valid only if aggressive liquidation occurs into deeper discount.
Targets: 3360 → 3380.
SELL ZONES
🔴 3398 - 3405
First premium inducement area.
Look for fast spikes with M15 bearish rejection candles.
Targets: 3370 → 3348.
🔴 3412 - 3420
Secondary premium trap zone.
Valid only after upside wick rejection.
Targets: 3385 → 3355.
🔴 3435 - 3445
Maximum stop-hunt exhaustion zone.
Only valid if price aggressively squeezes into final liquidity.
Targets: 3390 → 3360.
⚠ TRADING REMINDER:
Friday’s session will likely be driven by both news and geopolitical headlines. Let liquidity play out inside the zones, wait for clear rejection signals, and execute with full confirmation. No chasing — sniper discipline only. 🎯
💎 Hit that 🚀 if you found this plan helpful.
👉 Feel free to follow for daily gold plans and share your thoughts in the comments.
We remain disciplined. We trade structure.
🌙 Rest well tonight — tomorrow we execute with precision and control.
— GoldFxMinds
GBPUSD - Long at some pointVery similar with what we are looking for in relation to EURUSD
Will wait for a mitigation of the demand at lower price. Will wait for an internal structure break before looking to get long.
Will have a nice sleep now and will re-evaluate in the morning.
Caught 2 lovely trades on this today and hopefully I may be able to catch 1 or 2 more before the week is out.
Again, if you have any questions don't be shy to get in touch

GBPUSD - LongI missed the opportunity yesterday.
However, I've been lucky enough to get involved again as of this morning.
4H orderflow is still bullish so we will still look for the longs until the market tells us otherwise.
If I can help with anything do let me know

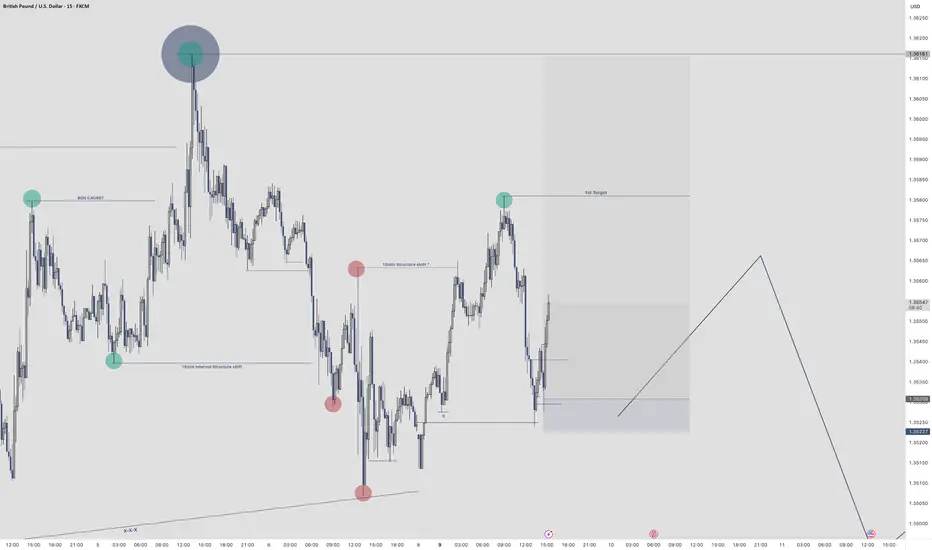
EURUSD - LongTried to upload this a while ago but for some reason TV was acting up
Im currently in a long position.
We had a 15min structure shift to the upside meaning I was looking at the most relevant place to get long.
Took the entry cased on the 1min timeframe
First target is set at 1.35810
Secondary targets I will be shooting for the HTF high
EURUSD - Long 15min orderflow changeI have set a pending order on EURUSD based on the structure shift and liquidity left behind to the left and now the right.
Entry order placed. lets see what happens on this position.

EURUSDVery important area now for EURUSD
Will the unmitigated OB's on the 1H stand strong or, will we continue lower. due to the HTF area of value.
Took a nice short on the 5min TF for a 1:21 RR.
Now lets see how this plays out should be really interesting
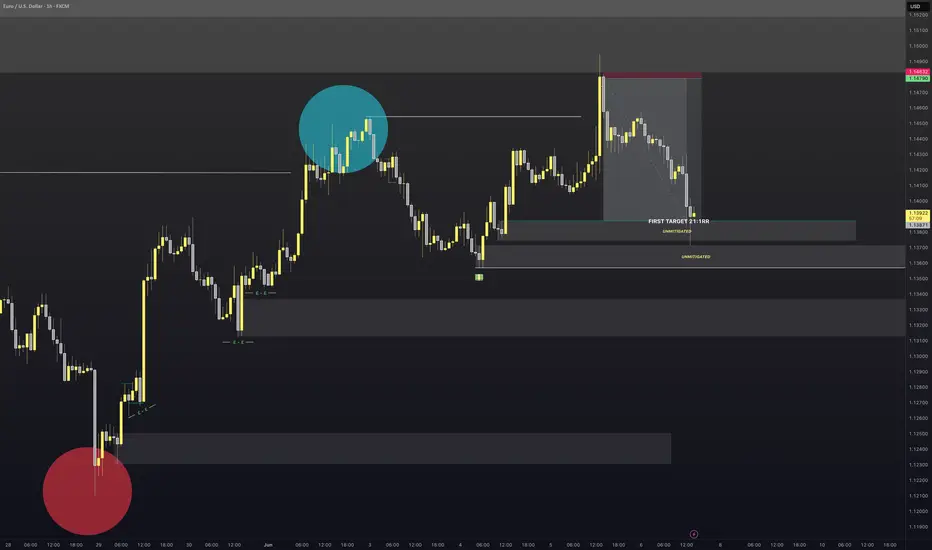
EURUSD - SellEntered this earlier on the 1min TF
Target will be the first Order Block which is 21:RR.
The reason I am targeting here is the 4H order flow is still bullish. So if we can hit the target I close 50% of the position and let the rest ride and manage accordingly to price.
Lets see how it plays out
