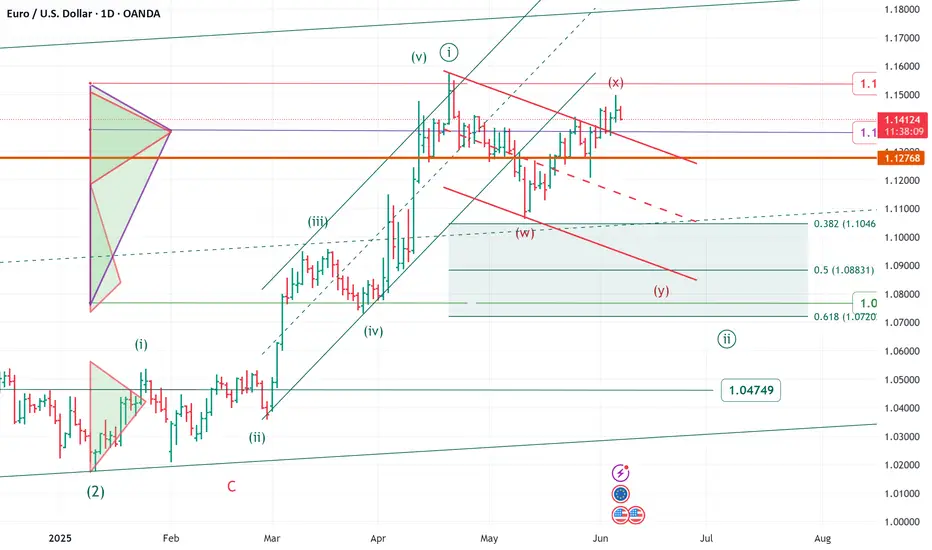
Elliott wave daily EURUSD update
Elliott wave daily EURUSD update
The price movement of the last few weeks requires a change
and update of the wave count
______________________________________
upward movement from area 1.018/genuary 2025 to area 1.1580/april 2025
looks impulsive - minute wave ((i)).
we are now in a corrective minute wave ((ii))
zigzag or flat or any double
target area 1.1040/1.0800 area
in the very short term level to monitor 1.1500 area
over 1.1500 area a flat correction more likely ( to area 1.1570)
note
FX option expiries for 6 June 10am New York cut
1.1500 (EUR 3.19bn)
1.1400 (EUR 2.38bn)
1.1300 (EUR 1.28bn)
FOREXLIVE
Oscillators
USD/CHF Testing June Low as Momentum Turns SouthRising geopolitical tensions and sliding U.S. Treasury yields have dragged USD/CHF sharply lower, delivering a bearish engulfing candle on the daily and pushing the pair back towards the June low at .8160. The move sets up a potential short should that level give way.
A clean break of .8160 would allow for positions to be established with a stop above for protection, targeting a retest of the April 21 swing low at .8040. Momentum signals are turning bearish, with RSI (14) breaking its uptrend and drifting further from neutral, while MACD looks set to cross the signal line below zero.
While a long setup is also a consideration should .8160 hold, recent price action and momentum shifts suggest it’s a low-probability play.
Good luck!
DS

Nasdaq Futures: Tariff Talk, Tech Fatigue Turn TideHaving surged more than 20% from the April lows, we could be nearing a turning point for Nasdaq 100 futures.
Bullish momentum is showing signs of shifting lower, while Wednesday’s inverted hammer candle—on a day when tech stocks were given every excuse to rally thanks to the soft U.S. inflation report and subsequent decline in Treasury yields—warns the rally may be running out of steam.
With Donald Trump talking about setting firm tariff rates for individual nations within the next two weeks, we’re already seeing signs of weakness in futures, bolstering the prospect for a three-candle evening star pattern being completed. Sitting in a rising wedge, directional risks seem to be skewing lower.
If the price breaks and closes beneath wedge support, it would create a setup where shorts could be established with a stop above Wednesday’s high to protect against a resumption of the bullish trend.
21436 is a minor support level that screens as an initial target, although 20800—where the price bounced strongly from on May 23—makes for a more appealing case from a risk-reward perspective.
A push and close above 21969—a minor resistance level established earlier this year—would invalidate the bearish bias.
Good luck!
DS

Cisco Wave Analysis – 11 June 2025
- Cisco reversed from the key resistance level 65.60
- Likely to fall to support level 62.20
Cisco recently reversed down from the key resistance level 65.60 (which has been reversing the price from the start of February).
The downward reversal from the resistance level 65.60 created the daily Japanese candlesticks reversal pattern Evening Star.
Cisco can be expected to fall to the next support level 62.20 (a low of the previous minor correction 2 from the end of May).

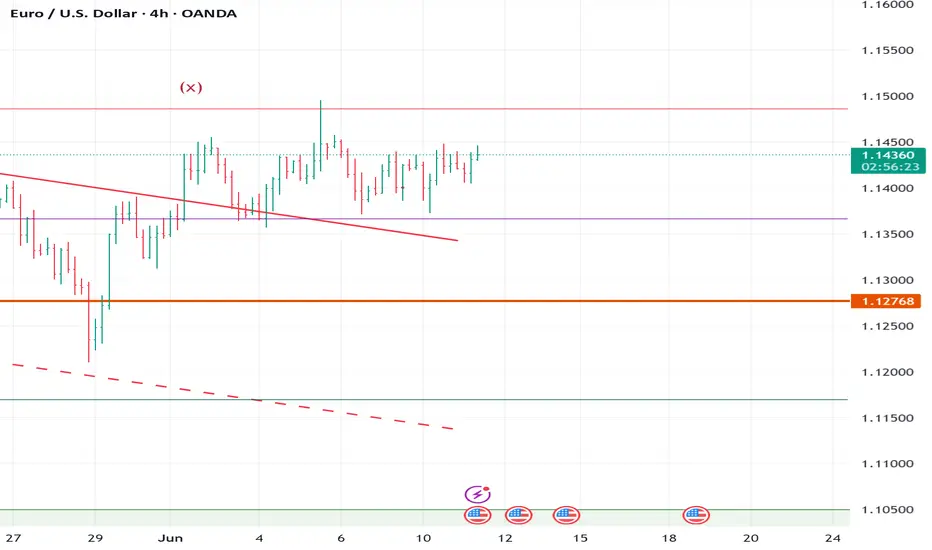
ELLIOTT WAVE EURUSD H4 update
EW Trade Set Up H4
minute wave (ii) running
is not already clear wheter it will develope in a sideway or sharp correction usually wave 2 is sharp in a zigzag to 0.618 retracement value.
short term key levels (area)
1.1445
1.1425
1.1365 POC
1.1320
1.1220
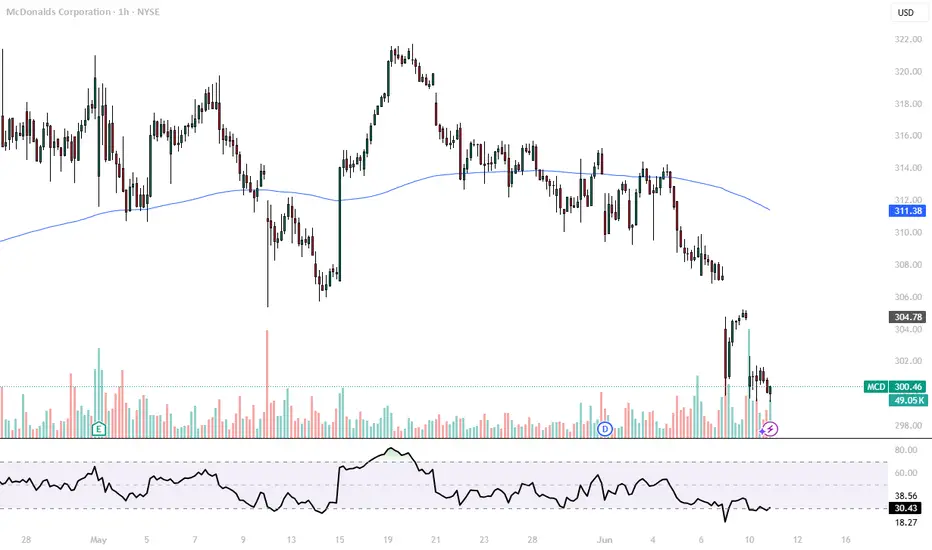
McDonald 1H Long PositionMy self-built strategy has sent me a signal for a long position. I bought a tranche of NYSE:MCD long and will be targeting the upper gaps as my profit targets. The first station will be around $306, and the second target lies between $318 and $319. Currently, the 1H chart is forming a nice divergence and had a huge volume spike, and my strategy indicates a high probability setup for this chart.
Given the current market volatility, I’ll be keeping a close eye on my open position to be able to react quickly if needed.
VIC hope you are watching it.---
### 🇻🇳 Vin Group (VIC): An On-the-Ground Perspective from Vietnam 📈
After first visiting Vietnam in 2022, it became clear Vin Group is doing a lot of interesting things in Vietnam. To me, Vin Group seemed like an obvious thing to get exposure to a lot of the growth in Vietnam.
* **Accessibility Note:** HOSE:VIC is not easily available outside Vietnam, other than within Vietnamese indexes.
---
### The NASDAQ:VFS Anomaly & Free Float Insights
While in 2023, NASDAQ:VFS (VinFast) went to prices that defied all logic on US markets, US media most likely had no idea about $VIC. All you needed to do was see that HOSE:VIC held most of the NASDAQ:VFS shares (I thought it was 80%, but some suggestions indicate it might have been closer to 99%).
* **Key Takeaway:** A lot of retail investors won't understand free float risks. Starting my investing journey in the crypto space, I am well versed in dealing with assets with low float.
**(Image 1: VFS Marketcap)**
` `
*VFS Marketcap*
**(Image 2: VIC Marketcap & The Disconnect)**
` `
*VIC Marketcap – Note: VIC is in VND, VFS in USD. At one point, HOSE:VIC (approx. $12B USD) held VFS shares valued vastly higher, highlighting a significant market disconnect.*
> Needless to say, I wanted exposure to the things Vin Group was doing but chose to wait rather than join that insanity.
---
### An Expat's View: Seeing Vietnam's Transformation zmiany
As of Q4 2023, I moved to Vietnam. Living here, I get to see what's going on. Though I am still a foreigner, I get a different perspective.
> You see, when you look in the mirror every day, it's hard to see the changes. Then you see that family member you haven't seen in a while who still thinks you're 6, but you're actually 16. This is the case in Vietnam; many people came years ago and think it's the same or worse, or perhaps just watched a movie.
---
### Understanding Vietnam's Economic DNA: Đổi Mới and its People 🚀
To understand economics in Vietnam, you must first understand **Đổi Mới** – those changes are the start of economic success in Vietnam.
* **Human Capital:**
* First-generation university/college-educated individuals are very common.
* First-generation English, Chinese, or Korean speakers are gaining more access to markets outside Vietnam. (Korean is significant for FDI and cultural influence like movies/TV).
* **The Vietnamese Grit:** Many Vietnamese had very rough younger lives, and grit is a character trait they could win prizes for. It's seen in an extreme you don't find in other places. They just won't quit.
* **International Relations:** International business requires friendliness, and they choose to be friendly with everyone.
> Investing is about backing winners so that you can win with them.
---
### Navigating Vin Group's Diverse Portfolio:
**1. Real Estate Market & HOSE:VIC :**
The real estate market has struggled after the incident with Truong My Lan. A lot of stuff is empty and unsold. I have no clue when Vietnamese housing will top or bottom. While HOSE:VIC is largely made up of real estate, I believe that with lower mortgage rates now, they will sell properties they have and don't want, moving debt and assets off the balance sheet.
**2. VinFast ( NASDAQ:VFS ) & Xanh SM 🚕:**
* **Indonesian Expansion:** Watch for expansion into Indonesia – a massive, often underestimated market. (Unless it's someone who follows National GDP rankings globally and other macroeconomics.)
* **Path to Profitability:** VinFast just needs to reach a point where it's no longer cash-flow negative.
* **Long-Term Value:** The money will come from the Vision training they are doing.
* **Xanh SM (Taxi Service):**
* Now the largest taxi company in Vietnam.
* Creates organic demand (buy pressure) for VinFast cars.
* **A Better "Green" Product:** Unlike my experience in Canada where "green" options often felt forced and uncompetitive, Xanh SM is something you take because it's simply a *better product*. Smart, innovative people can make something "Green" AND better for the consumer. If you haven't tried it, just try it – it's better in every way (specifically the VinFast cars).
* **Scooter Critique:** The VinFast scooter needs a very simple change. The handle to hold onto the scooter located on the back is really bad. If I had one request, it would be to change that handle; it's awful. Put a large man in the front and try it.
**3. Vin Bus 🚌:**
Wow, the bus is the same quality as the newest buses I have seen in Canada, with one huge change: They are *extremely clean*. I have never been on a dirty VinBus.
**4. Vin Homes 🏡:**
Truly amazing, with great amenities. Lots of people run or play sports in the early morning. Mall access, VinBus access.
**5. Other Ventures:**
* **VinSchool & VinMec:** I've heard a lot of great stuff, but I haven't used them personally.
* **VinWonders Theme Park:** Also a lot of fun.
* **Vin Group Hotels:** Can also be really great.
---
### My Investment Journey with HOSE:VIC charted
**(Image 3: My Entry Point)**
` `
*So when did I actually get into Vin Group? In 2024.*
**(Image 4: Weekly MACD Signal)**
` `
*To me, this weekly MACD made it really obvious downside momentum was done. It was a matter of time to buy it up.*
* **Stop-Loss:** Having a stop-loss was also pretty obvious with the 2023 low.
* **Sentiment:** Sentiment was also really low.
* **Conviction:** Yet, I kept using the products of HOSE:VIC subsidiary companies, thinking the only way I see this company not doing better is if it goes bankrupt. The products are definitely amazing.
* **Debt vs. Rates:** If you looked at the company balance sheets, debt was a risk, but Vietnam changed its rates, and eventually, most nations will change their rates.
---
### Price Targets & Risk Management for HOSE:VIC 📈📉
**(Image 5: Long-Term View & Current RSI)**
` `
* **Long-Term Target:** I think this Company could go well over **200k VND**.
* **Short-Term Caution:** Price going straight up is risky. With 2024 buying, you could have a narrow stop-loss. In 2025, with this price movement, a simple weekly reversion to the mean would be very rough.
* **Overbought RSI:** The RSI hit 97 – not a number that makes me think, "Wow, lots of room to grow immediately."
> For me, I want to hold enough stock that I am okay if, before going to 200k VND, we first go back to 60k VND.
---
**Disclaimer:**
*The information provided in this post is for educational and informational purposes only. It does not constitute financial advice, investment recommendations, or a solicitation to buy or sell any financial instruments. All investments involve risk, and the past performance of a security, market, or trading strategy does not guarantee future results. I am not a financial advisor. Please conduct your own thorough research and consult with a qualified financial professional before making any investment decisions. You are solely responsible for any investment decisions you make.*

Hang Seng Futures: Bulls eye March highsHang Seng futures have broken above resistance at 24,050 following the latest batch of positive trade headlines, leaving the index on track for a potential retest of the March highs.
Those eying longs could buy dips towards 24050 with a stop beneath the level for protection. Both RSI (14) and MACD are trending higher without flashing overbought signals, favouring a bullish stance.
Given how far the price has already run on Wednesday, the preference would be to wait for better entry levels rather than chasing the move higher.
Good luck!
DS

ETH Bulls Back in Play Above $2800ETH/USD has pushed above $2800, a key level it has done significant work either side of going back to 2022. Having broken above the important 200-day moving average earlier this week, and with indicators like RSI (14) and MACD pointing to growing topside momentum, a close above $2800 may encourage other bulls to join in the run higher.
If the price can hold $2800, longs could be established above the level with a stop below for protection. The price action around $2800 during February reinforces the need to see the breakout stick before entering the trade.
$3000 screens as a potential target, as does $3525—the 78.6% retracement of the December–April bear move. Beyond, $3750 was tagged on multiple occasions late last year, making it another possibility before the record highs come into view.
If the price is unable to stick the $2800 break, the setup would be invalidated.
Good luck!
DS

11 june Nifty50 brekout and Breakdown leval Nifty 50 Index, here's a breakdown of the "Sell Levels" from a trading strategy point of view:
📉 Key Sell (Put Entry / PE) Zones:
25,140 – Below this level:
Tagged as "Below nigetive trade view"
This suggests initiating bearish positions (sell or buy PE) if price falls below this
25,040 – Opening Support / Resistance:
If price breaks below this with volume, it's a confirmed breakdown, suitable for short trades.
24,980 – above 10m hold CE by RISKY ZONE:
Below this, call options (CE) become risky. Could start unwinding.
24,980 – Below 10m hold PE By Zone:
Strong confirmation to hold PE positions.
24,908 – CE By Safe Zone:
A very strong bearish confirmation if price dips below this.

AMD Approaching Key Supply Zone – Rejection or Breakout?📌 Thesis:
AMD is approaching a critical 1D supply zone ($122–$130) with bearish RSI divergence, suggesting possible short-term exhaustion.
🔍 Technical Overview:
✅ Structure: Bullish recovery confirmed with Break of Structure (BoS).
📈 Price Action: Higher highs into known supply zone.
📉 RSI: Forming lower highs, showing classic bearish divergence — a common warning signal near key resistance.
🧭 MACD: Still positive, but momentum is slowing.
📊 Volume: Healthy, but not confirming a breakout (yet).
📌 Base Case (Bias):
Rejection from supply zone is likely, given weakening momentum. Watch for bearish reversal candles around $122–$130.
If rejection confirms:
🎯 First target: EMA cluster ($116).
🛑 Invalidation: Clean breakout above $130 with volume.
🔁 Alternate Scenario:
If AMD breaks and holds above $130, divergence is invalidated.
Next upside target: $140–$150 (previous resistance zone).
✅ Trade Plan:
🔹 Short setup: Bearish rejection + divergence confirmation at supply zone.
🔹 Long setup: Breakout + retest of supply zone turned support.
Conclusion:
This is a technical inflection point for AMD. Price action in the coming sessions will likely define the short-term direction. Trade the setup, not the prediction.

Has JD.com Bottomed?JD.com has languished for a couple of months, but some traders may think the Chinese e-commerce stock has bottomed.
The first pattern on today’s chart is the April low of $31.80. JD closed below the level once in May but quickly rebounded. That could be interpreted as a false breakdown.
Second, MACD made a higher low as prices made a lower low . Such “bullish divergence” can potentially signal reversals.
Third, the stock crossed above the 8- and 21-day exponential moving averages and is pulling both higher. That may suggest its short-term direction is now pointing upward.
Fourth, the rising 200-day simple moving average could reflect the presence of a longer-term uptrend.
Last, consider the February low around $38. JD stalled around the same area in April and May. With the stock more than 10 percent below that old resistance, could chart watchers see further space to the upside?
Check out TradingView's The Leap competition sponsored by TradeStation.
TradeStation has, for decades, advanced the trading industry, providing access to stocks, options and futures. If you're born to trade, we could be for you. See our Overview for more.
Past performance, whether actual or indicated by historical tests of strategies, is no guarantee of future performance or success. There is a possibility that you may sustain a loss equal to or greater than your entire investment regardless of which asset class you trade (equities, options or futures); therefore, you should not invest or risk money that you cannot afford to lose. Online trading is not suitable for all investors. View the document titled Characteristics and Risks of Standardized Options at www.TradeStation.com . Before trading any asset class, customers must read the relevant risk disclosure statements on www.TradeStation.com . System access and trade placement and execution may be delayed or fail due to market volatility and volume, quote delays, system and software errors, Internet traffic, outages and other factors.
Securities and futures trading is offered to self-directed customers by TradeStation Securities, Inc., a broker-dealer registered with the Securities and Exchange Commission and a futures commission merchant licensed with the Commodity Futures Trading Commission). TradeStation Securities is a member of the Financial Industry Regulatory Authority, the National Futures Association, and a number of exchanges.
TradeStation Securities, Inc. and TradeStation Technologies, Inc. are each wholly owned subsidiaries of TradeStation Group, Inc., both operating, and providing products and services, under the TradeStation brand and trademark. When applying for, or purchasing, accounts, subscriptions, products and services, it is important that you know which company you will be dealing with. Visit www.TradeStation.com for further important information explaining what this means.

BEARS TAKEOVER IN PSU BANK INDEX ??The PSU Index saw a strong rally after a falling wedge breakout but now faces resistance near 7250, with bearish RSI divergence hinting at weakening momentum. A pullback is likely, and price action at 6838 or 6572 will decide whether the uptrend resumes or a downtrend begins—impacting key PSU bank stocks like SBI, PNB, and BOB.
Key Pointers:
📉 Falling wedge breakout led to a strong bullish rally.
⛔ Resistance near 7250 is restricting upside.
⚠️ RSI bearish divergence suggests weakening momentum despite rising prices.
🔄 Two scenarios ahead:
Pullback + bullish signs → uptrend likely to resume.
Pullback + no bullish signs → possible start of a downtrend.
📊 Key pullback support levels:
6838 (major pullback)
6572 (major pullback)
📉 Impact: Stocks like SBI, PNB, and BOB may see short-term fluctuations in line with PSU Index movements.

REGN – Bullish Engulfing + RSI Divergence at Weekly DemandRegeneron (REGN) is showing strong technical signals of potential reversal from a key weekly demand zone, replicating a setup similar to March 2021.
🔹 Bullish Engulfing Candle forms directly at the demand zone after a multi-month downtrend.
🔹 Volume Spike confirms strong buyer interest.
🔹 RSI shows bullish divergence, breaking its internal structure and holding above 30.
🔹 MACD crossover is setting up, with histogram and signal lines echoing the same configuration from March 2021 — which led to a significant rally.
This is a textbook confluence setup:
Structure (demand zone)
Momentum (RSI divergence)
Confirmation (volume + engulfing)
Trigger alignment (MACD timing)
A decisive follow-through above recent highs could confirm the reversal and initiate a new bullish leg.

ETH is going for itAfter reclaiming the range, now the breakout on the daily RSI. Everything looks set for ETH.

Carvana is setting up for a dropI believe CVNA is printing expanding triangle as wave 4 in larger 5.
If this count is correct, currently wave D of triangle is close to its end and soon, around $325-340, the trend should reverse and go down to complete the triangle with wave E which will erase >60% of market cap.
After this move the stock is expected to climb up again.

GBP/AUD: Bias Lower While Below 50DMATrading beneath the 50-day moving average and support at 2.0800, and with momentum signals shifting from neutral to bearish, directional risks for GBP/AUD appear to be tilting lower.
Those considering shorts could look to initiate positions beneath 2.0800, with a stop placed above it or the 50-day moving average for protection. Bids may emerge around 2.0675, but for the trade to stack up from a risk-reward perspective, support at 2.0500 screens as the more appealing target.
For those eyeing the setup, keep in mind that UK labour market data is about to drop, posing a potential volatility event. The preference would be to wait and see how the pair trades following the release rather than acting preemptively. A move back towards 2.0800 that stalls would improve the appeal of the trade.
Good luck!
DS

Why I Think Gold Will Continue Buying...Technical AnalysisHey Rich Friends,
Happy Monday! I think Gold will continue to buy today and maybe this week. This is only my technical analysis so make sure to check the news and cross-reference any indicators you have on your charts.
- The candles have crossed and closed above the previous high on H1 and H4 showing bullish momentum.
- After the break of the previous high, H1 was resistance has been retested as support confirming bullish momentum.
- The stochastic is facing up, the fast line (blue) is above the orange line (slow) and 1 or both lines have crossed above the 80% line. These are bullish confirmations for me.
Additional information:
- Wait for the current candle to close for more bullish confirmation.
- I would set buy stops/TPS to 3400. I will be using previous highs as TPs and previous lows as SL.
Only enter this trade if it make sense to you.
Peace and Profits,
Cha

Altcoins in Focus: Aptos, KAIA, and Ravencoin (RVN)Amid Bitcoin’s rapid growth and renewed interest in Ethereum, investors are increasingly turning their attention to altcoins—alternative cryptocurrencies showing strong potential for sharp gains. As of early June 2025, Aptos (APT), KAIA, and Ravencoin (RVN) stand out for their price surges and growing interest from major exchanges and analysts.
Aptos, a next-generation blockchain platform developed by former Meta (ex-Diem) engineers, has secured its place among the top 50 by market cap. In recent days, the token broke through a resistance level at $9.20, signaling a possible continuation of the uptrend. Its appeal lies in its scalability and its unique MoveVM architecture, which makes it attractive for developers in DeFi and NFT applications.
KAIA, a new token in the AI and metaverse ecosystem, gained over 15% this week following a Binance listing and integration with several major Web3 projects. Investors see KAIA as a potential “new Render,” focusing on neural computation and digital identity infrastructure.
Ravencoin (RVN), a long-time presence in the crypto space, is regaining popularity. With its focus on asset tokenization and copyright protection on the blockchain, RVN surged 14% after announcing partnerships with several independent music platforms.
The rise of these altcoins demonstrates that there is room in the crypto world not just for the giants, but also for innovative, purpose-driven projects capable of capturing market and user interest.

PEP – Bullish Divergence at Weekly DemandPepsiCo (PEP) has retraced into a key weekly demand zone, where price previously launched long bullish legs. At the same time, a bullish divergence is forming between price and RSI, suggesting selling momentum may be weakening.
Structure has clearly shifted bearish over the past two years, with multiple breaks of structure (BoS). However, the current setup shows strong confluence for a potential mean reversion or reversal swing.
Two key supply zones are mapped:
First target (5:1 R:R) at the $141 area — recent supply.
Second target (12:1 R:R) near $162 — major macro supply.

PLTR 479% Parabolic Rally Meets RSI Divergence at Critical ZonePalantir (PLTR) has completed a near-perfect parabolic advance, rising more than 479% over 378 days from its demand base in early 2024. The move has been relentless — supported by breakout volume and accelerating price structure.
However, we are now at a potential inflection point.
Price is stalling at the upper end of the parabolic curve, right near a prior rejection level. At the same time, the RSI has been forming multiple bearish divergences, signaling weakening momentum despite new highs.
This exact combination — parabolic rise + RSI divergence — has preceded sharp corrections in the past.
The previous drop from this region led to a -47% decline, which found support in the $70–75 zone — now marked as a 2D demand area. That zone could again act as a magnet if momentum fades.
If PLTR breaks above $135 with strong volume, the divergence could be invalidated, but for now, the chart suggests caution. This may be a topping structure or the start of a broad sideways range.

EUR/USD 4H – Potential Quasimodo + Bearish Divergence SetupCurrently monitoring EUR/USD for a potential sell setup based on several strong technical confluences:
⸻
🧠 Price Structure: Possible Quasimodo (QM) Pattern
• The chart is showing early signs of a Quasimodo pattern (QM) formation.
• Left Shoulder and Right Shoulder are developing, with a higher high (false break) between them.
• The recent Dominant Break above 1.14948 could be a liquidity grab — classic in QM setups.
• Price appears to be retesting the right shoulder area, signaling potential for a bearish reversal.
⸻
📉 AO Indicator: Bearish Divergence as Confirmation
• Clear bearish divergence between price action and the Awesome Oscillator (AO):
• Price made a higher high, but AO printed a lower high.
• This signals weakening bullish momentum — a powerful confluence for a potential drop.
⸻
⚠️ Confluences for Sell Setup:
1. ✅ Potential QM Pattern forming
2. ✅ Dominant Break followed by a potential right shoulder retest
3. ✅ Strong bearish divergence on AO
4. ✅ Price failing to break and close strongly above recent high (~1.1494)
⸻
📍 Sell Trade Plan (if confirms):
• Entry Zone: Around 1.14400–1.14600 (right shoulder zone)
• Stop Loss: Above previous high (~1.15000)
• Take-Profit Options:
• TP1: Previous structure support around 1.13600
• TP2: Deeper support zone ~1.13000–1.12700
• TP3 (Aggressive): Full QM target near 1.12100 (as marked on the chart)
⸻
⏳ Wait For:
• Bearish rejection or momentum candle on 4H or 1H
• AO to cross below 0 or accelerate red bars for extra confirmation
⸻
💡 Conclusion:
EUR/USD is showing signs of a bearish reversal with a textbook QM setup supported by AO divergence. If the right shoulder holds and bearish momentum kicks in, this could offer a high-probability short opportunity.

UCAD Bulls Look for 3rd Test After Sept. '24 Highs TouchOANDA:USDCAD Bulls were able to find support at the Sept. 2024 Highs after having traveled down a Falling Support for the past 2 months!
Now we see Bulls pushing price higher creating a Rising Support with 2 tests having been successful and currently coming down for a 3rd test!
Now Price has already broken a Previous Level of Structure which was a Past Resistance on June 4th. This level also lands right at the 34 EMA and based on the Bollinger Bands, this test will also be a Mean Reversion where Price after having traveled in one direction will revert back to the mean of the Bollinger Bands for Continuation, which in this case will be Bullish!
After the 2nd Test of the Rising Support, we can see a Massive amount of Volume enters.
Price also is trading Above the 50 on the RSI and is currently coming down to test that level.
I am looking for Price to test the 1.3683 area and if Price shows support for a 3rd Test, this will be a great opportunity for Long Positions!
Fundamentally, USD will be bombarded heavy news being CPI numbers with analysts forecasting a .2% Increase in Inflation! Also PPI, Unemployment Claims and Prelim UoM Consumer Sentiment & Inflation Expectations.
