How To Short Sell This Forex Pair In A 4h (Time Frame) EntryAm always a curious person and thats what
allows me to penetrate any culture.I have this knack for adventure.
This is means i enjoy challenging myself.
I dont want to live a boring life.So even when i visit
a "Extremely High" poverty area, am good.
Because i know i have to check in.
Every place in the world has these places.
You have to check in with the G's of
that area otherwise you cooked!!. These areas
are notorious to high crime, and disease.
So if you dont check in bro you f'*d!
Remember every trading signal has to have a double confirmation
think of this double confirmation like
checking in the "hood".
You might be the king in your area
but in another area bro you aint the king.
You have to stay humble.
If you want to learn more you have to check in
with the financial trading experts like myself.
Is that fair? heck no.But you gots to check in man.
If you want more coaching just hit
me up for a reason fee on a monthly
basis and i got you.
Rocket boost this content to learn more.
Disclaimer:Trading is risky learn risk management
and profit taking strategies.Also don't use margin.
Use a simulation trading account
before you trade with real money.
Oscillators

Example of how to draw a trend line using the StochRSI indicator
Hello, traders.
If you "Follow", you can always get new information quickly.
Have a nice day today.
-------------------------------------
We use the StochRSI indicator to draw a trend line.
We draw a trend line by connecting the peaks of the StochRSI indicator, i.e. the K line, when they are created in the overbought area or when they are created in the overbought area.
That is, when the K line of the StochRSI indicator forms a peak in the overbought area, the trend line is drawn by connecting the Open values of the falling candles.
If the candle corresponding to the peak of the StochRSI indicator is a rising candle, move to the right and use the Open value of the first falling candle.
When drawing the first trend line, draw it from the latest candle.
Since the third trend line indicates a new trend, do not draw anything after the third trend line.
The currently drawn trend line corresponds to the high-point trend line.
-
Therefore, you should also draw the low-point trend line.
The low-point trend line is drawn by connecting the K line of the StochRSI indicator when the top is formed in the oversold zone.
The low-point trend line uses the low value of the candle when the K line of the StochRSI indicator forms the top in the oversold zone.
That is, it doesn't matter whether the candle is a bearish candle or a bullish candle.
The drawing method is the same as when drawing the high-point trend line, drawing from the latest candle.
The top of the best K line of the StochRSI indicator was not formed within the oversold zone.
(The top is indicated by the section marked with a circle.)
Since the trend line was not formed, the principle is not to draw it.
If you want to draw it and see it, it is better to display it differently from the existing trend line so that it is intuitively different from the existing trend line.
-
The chart below is a chart that displays the trend line drawn separately above as a whole.
It is also good to distinguish which trend line it is by changing the color of the high-point trend line and the low-point trend line.
The chart below is a chart that distinguishes the high-point trend line in blue (#5b9cf6) and the low-point trend line in light green (#00ff00).
The low-point trend line is a line drawn when the trend has changed, so it does not have much meaning, but it still provides good information for calculating the volatility period.
-
To calculate the volatility period, support and resistance points drawn on the 1M, 1W, and 1D charts are required.
However, since I am currently explaining how to draw a trend line, it is only drawn on the 1M chart.
-
I use the indicators used in my chart to indicate support and resistance points.
That is, I use the DOM(60), DOM(-60), HA-Low, HA-High, and OBV indicators to indicate support and resistance points.
Since the DOM(-60) and HA-Low indicators are not displayed on the 1M chart, I have shown the 1W chart as an example.
The indicators displayed up to the current candle correspond to the main support and resistance points.
Although it is not displayed up to the current candle, the point where the horizontal line is long is drawn as the sub-support and resistance point.
It is recommended to mark them separately to distinguish the main support and resistance point and the sub-support and resistance point.
The trend line drawn in this way and the support and resistance points are correlated on the 1D chart and the volatility period is calculated.
(For example, it was drawn on the 1M chart.)
The sections marked as circles are the points that serve as the basis for calculating the volatility period.
That is,
- The point where multiple trend lines intersect
- The point where the trend line and the support and resistance points intersect
Select the point that satisfies the above cases at the same time to display the volatility period.
When the point of calculating the volatility period is ambiguous, move to the left and select the first candle.
This is because it is meaningless to display it after the volatility period has passed.
If possible, the more points that are satisfied at the same time, the stronger the volatility period.
If the K-line peak of the StochRSI indicator is formed outside the overbought or oversold zone, it is better to exclude it when calculating the volatility period.
-
The chart below is a chart drawn on a 1D chart by summarizing the above contents.
The reason why there are so many lines is because of this reason.
For those who are not familiar with my charts, I have been simplifying the charts as much as possible these days.
However, when explaining, I have shown all the indicators to help you understand the explanation.
-
Thank you for reading to the end.
I hope you have a successful trade.
--------------------------------------------------

StochRSI indicator and support and resistance levels
Hello, traders.
If you "follow" me, you can always get the latest information quickly.
Have a nice day today.
-------------------------------------
The StochRSI indicator on the left chart is slightly different from the StochRSI indicator on the right.
The StochRSI indicator on the left chart is the StochRSI indicator provided by default in TradingView, and the StochRSI indicator on the right chart is an indicator with a modified formula.
The StochRSI indicator is a leading indicator that is reflected almost in real time.
Therefore, it reacts sensitively to price changes.
Although it is advantageous because it reacts sensitively, it also increases the possibility of being caught in a fake, so I thought that a slight delay(?) was necessary, and so I created the StochRSI indicator on the left chart.
If you look at the relationship between the K and D of the StochRSI indicators on the two charts, you can see that there is a big difference.
In the end, you can predict the movement by checking whether the movement of the K line has escaped the overbought or oversold section.
However, I think that you will receive information that can determine the sustainability of the trend depending on the positional relationship between K and D.
Therefore, it is important to distinguish the inflection points that occur in the StochRSI indicator.
This is because these inflection points provide important information for drawing trend lines.
Therefore, the StochRSI indicator on the left chart, which better expresses the inflection point, is being used to draw the trend line.
(Unfortunately, this indicator was not registered on TradingView because I did not explain it well.)
-
As a new candle was created, the StochRSI indicator on the left chart is showing an inflection point on the K line.
The StochRSI indicator on the right chart is showing a transition to a state where K < D.
We will have to check whether the inflection point was created only when today's candle closes, but I think that the fact that it is showing this pattern means that there is a high possibility of a change in the future trend.
Since the next volatility period is expected to start around July 2nd (July 1st-3rd), I think it has started to show meaningful movements.
-
It is true that you want to buy at the lowest price possible and sell at the highest price.
However, because of this greed, one mistake can lead to a loss that can overturn nine victories, so you should always be careful.
Therefore, if possible, it is better to check for support and respond.
In that sense, I think it is worth referring to the relationship between K and D of the StochRSI indicator on the left chart.
This is because the actual downtrend is likely to start when K < D.
-
In order to check for support, you definitely need support and resistance points drawn on the 1M, 1W, and 1D charts.
Ignoring this and checking for support at the drawn support and resistance points can result in not being able to apply the chart you drew to actual trading.
Therefore, you should draw support and resistance points first before starting a trade.
Otherwise, if you draw support and resistance points after starting a trade, you are more likely to set support and resistance points that reflect your subjective thoughts, so as I mentioned earlier, you are more likely to lose faith in the chart you drew.
If this phenomenon continues, it will eventually lead to leaving the investment market.
-
It is important to determine whether there is support by checking the correlation between the StochRSI indicator and other indicators at the support and resistance points drawn on the 1M, 1W, and 1D charts.
Even if the inflection point of the StochRSI indicator or other indicators occurs at a point other than the support and resistance points you drew, you should consider it as something that occurred beyond your ability to handle.
In other words, you should observe the price movement but not actually trade.
As I mentioned earlier, if you start to violate this, you will become less and less able to trust the chart you drew.
-
Accordingly, the basic trading strategy I suggest is to buy near the HA-Low indicator and sell near the HA-High indicator.
However, since the HA-Low and HA-High indicators are expressed as average values, they may move in the opposite direction to the basic trading strategy.
In other words, if the HA-Low indicator is resisted and falls, there is a possibility of a stepwise downward trend, and if the HA-High indicator is supported and rises, there is a possibility of a stepwise upward trend.
Therefore, the basic trading strategy mentioned above can be considered a trading strategy in the box section.
In the case of deviating from this box section, it is highly likely to occur before and after the volatility period indicated by the relationship between the trend line using the StochRSI indicator mentioned above and the support and resistance points drawn on the 1M, 1W, and 1D charts.
Therefore, special care is required when conducting new transactions during the volatility period.
This is because there is a high possibility of being caught in a fake when trading during the volatility period.
-
The DOM(60) and DOM(-60) indicators are good indicators to look at together with the HA-Low and HA-High indicators.
The DOM indicator is an indicator that comprehensively evaluates the DMI, OBV, and MOMENTUM indicators.
Therefore, the DOM(60) indicator is likely to be at the end of the high point range, and the DOM(060) indicator is likely to be at the end of the low point range.
In the explanation of the HA-Low and HA-High indicators,
- I said that if the HA-Low indicator receives resistance and falls, there is a possibility that a stepwise downtrend will begin,
- and if the HA-High indicator receives support and rises, there is a possibility that a stepwise uptrend will begin.
In order for an actual stepwise downtrend to begin, the price must fall below DOM(-60), and in order for a stepwise uptrend to begin, it must rise above DOM(60).
In other words, the DOM(-60) ~ HA-Low section and the HA-High ~ DOM(60) section can be seen as support and resistance sections.
-
If these correlations start to appear, I think you will be able to create a trading strategy that fits your investment style without being swayed by price volatility and proceed with trading.
The reason for analyzing charts is to trade.
Therefore, the shorter the time for chart analysis, the better, and you should increase the start of creating a trading strategy.
-
Thank you for reading to the end.
I hope you have a successful trade.
--------------------------------------------------

Btc have big long chanceI want to get an optimistic scenario from Bitcoin, which can increase up to five times as far as the history of Hawings.
🇮🇷Long Live Iran🇮🇷
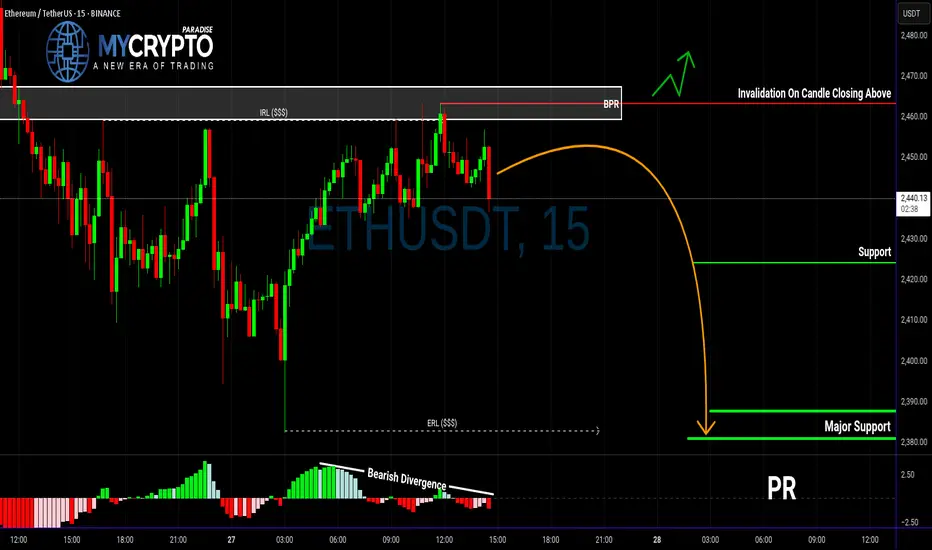
ETH in Trouble? This Breakdown Could Be Just the BeginningYello, Paradisers — are you spotting the same warning signs we did before the last major ETH correction? If not, now’s the time to pay close attention.
💎ETHUSDT is currently showing multiple bearish signals across both higher and lower timeframes. On the higher timeframe, we’ve confirmed a bearish Change of Character (CHoCH), which is often the first major clue that momentum is shifting from bullish to bearish. This shift suggests that ETH could be preparing for a deeper move down.
💎On the 15-minute timeframe, price has reacted directly from the BPR zone. What adds even more weight to this reaction is the clear bearish divergence we’re seeing on the MACD indicator. Together, these signs point to increased bearish pressure in the short term.
💎More importantly, ETH has already taken out Internal Range Liquidity (IRL), which often sets the stage for a move toward the External Range Liquidity (ERL). When IRL gets swept and momentum remains bearish, it’s typically a sign that the market is hunting for liquidity on the other side of the range—and that’s exactly where we believe ETH is headed next.
💎That said, to take this setup with high confidence, we’re waiting for a clean bearish candlestick pattern to form. Confirmation is key. A solid entry backed by strong price action improves the probability of success and allows for tighter, more efficient risk management.
💎However, if ETH breaks out and closes decisively above our invalidation zone, the entire bearish idea is off the table. In that scenario, patience will be our best tool—we’ll wait for price action to realign and only re-enter the market once a new high-probability setup presents itself.
🎖Strive for consistency, not quick profits. Treat the market as a businessman, not as a gambler. Patience and discipline are what separate the professionals from the herd. Stick to the process, trust the strategy, and you’ll stay ahead of 90% of the market.
MyCryptoParadise
iFeel the success🌴
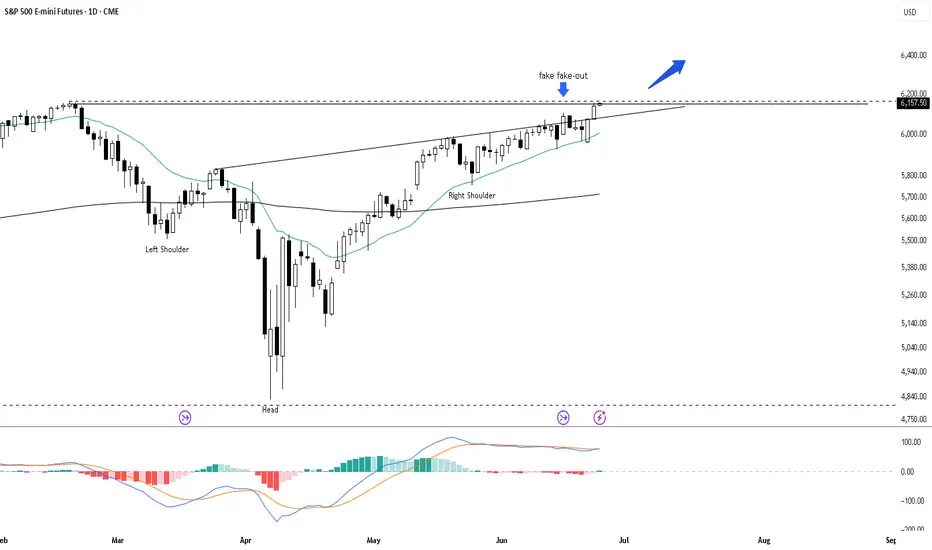
The S&P did it!The S&P 500 has reached a new ATH. The monthly RSI looks strong as well. This could trigger an explosion into the target area.

USD/CAD: Momentum Turns South Again with Fed Cut Bets BuildingDownside risks flagged in a separate trade idea earlier this week finally materialised for USD/CAD, resulting in the initial target being achieved. With the price now trading marginally below those levels and momentum indicators still bearish, another short setup has presented itself.
If USD/CAD continues to hold beneath 1.3650, shorts could be initiated below the level with a stop above for protection. The obvious target would be support at 1.3550, where the price bounced strongly in May.
With market pricing for Fed rate cuts continuing to build, narrowing yield differentials between the United States and Canada, downside is also favoured from a fundamental perspective.
Good luck!
DS

ADA About to Explode or Fakeout Trap?Yello Paradisers — is ADA quietly setting up for a powerful reversal, or are we about to walk straight into a painful bull trap? This zone could decide everything, and here’s why you need to pay close attention.
💎Cardano (ADAUSDT) is currently sitting right on the supportive trendline of a descending channel, while also forming a classic double bottom pattern. What makes this even more significant is the presence of bullish divergence on RSI. This combination alone already hints at a potential bullish reversal, but there’s more to it.
💎The current zone also served as a previous resistance area, and it has now flipped into support—this “resistance-turned-support” structure adds confluence and increases the probability of an upward move. When multiple bullish signals align at a major structural level like this, it usually sets the stage for a strong bounce.
💎Aggressive traders who entered early from current levels are already seeing a potential 1:1 risk-to-reward ratio. However, for safer and more strategic positioning, conservative traders can wait for a pullback to this support zone. Waiting for a bullish confirmation candle after the pullback can offer a better entry with a healthier RR and higher probability of success.
💎That said, if the price breaks below the current support and closes a candle below our invalidation level, the entire bullish idea will be invalidated. In that scenario, the smart move is to remain patient and wait for a new setup to form. Chasing trades after invalidation is how most retail traders get trapped—don’t be one of them.
🎖Strive for consistency, not quick profits. Treat the market as a businessman, not as a gambler. This is the only way you’ll make it far in your crypto trading journey. Be a PRO.
MyCryptoParadise
iFeel the success🌴

Skeptic | RSI Masterclass: Unlock Pro-Level Trading Secrets!Hey traders, it’s Skeptic ! 😎 Ready to transform your trading? 95% of you are using the Relative Strength Index wrong , and I’m here to fix that with a game-changing strategy I’ve backtested across 200+ trades. This isn’t a generic RSI tutorial—it’s packed with real-world setups, myth-busting insights, and precise rules to trade with confidence. Join me to master the art of RSI and trade with clarity, discipline, and reason. Big shoutout to TradingView for this epic free tool! 🙌 Let’s dive in! 🚖
What Is RSI? The Core Breakdown
The Relative Strength Index (RSI) , crafted by Welles Wilder, is a momentum oscillator that measures a market’s strength by comparing average gains to average losses over a set period. Here’s the formula:
G = average gains over n periods, L = average losses.
Relative Strength (RS) = | G / L |.
RSI = 100 - (100 / (1 + RS)).
Wilder used a 14-period lookback , and I stick with it—it’s smooth, filters noise, and gives a crystal-clear read on buyer or seller momentum. Let’s get to the good stuff—how I use RSI to stack profits! 📊
My RSI Strategy: Flipping the Script
Forget what you’ve read in books like The Handbook of Technical Analysis by Mark Andrew Lim— overbought (70) and oversold (30) aren’t just for shorting or buying. I go long when RSI hits overbought, and it’s been a goldmine. I’ve backtested over 200 trades with this approach, and it’s my go-to confirmation for daily setups. Why does it work? When RSI hits overbought on my 15-minute entry chart, it signals explosive buyer momentum. Here’s what you get:
Lightning-Fast R/R: I hit risk/reward targets in 30 minutes to 2 hours on 15-minute entries (longer for 1-hour entries, depending on your timeframe).
Massive R/R Potential: An overbought RSI on 15-minute can push 1-hour and 4-hour RSI into overbought, driving bigger moves. I hold for R/Rs of 5 or even 10, not bailing early. 🚀
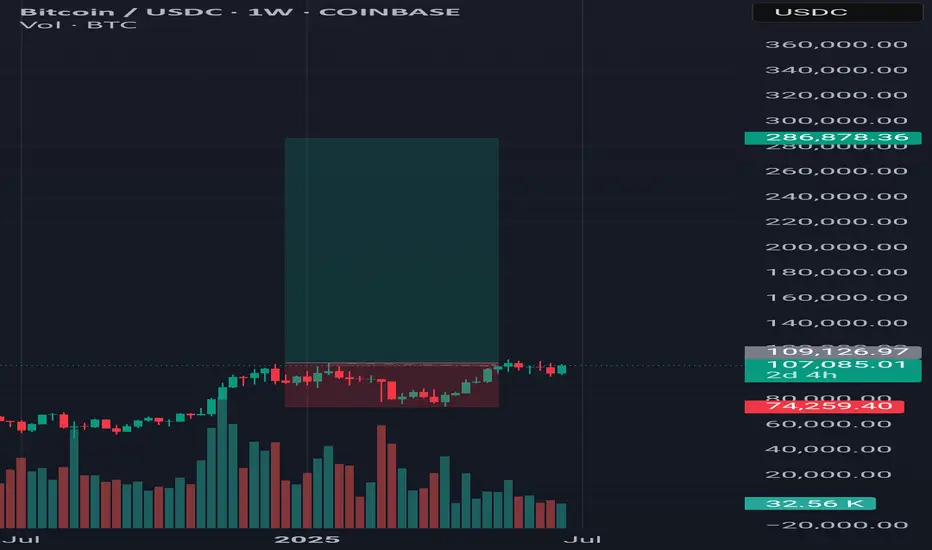
Rock-Solid Confirmation: RSI confirms my entry trigger. Take BTC/USD:
BTC bounces off a key support at 76,000, sparking an uptrend.
It forms a 4-hour box range, but price tests the ceiling more than the floor, hinting at a breakout.
Trigger: Break above the box ceiling at 85,853.57.
On 15-minute, a powerful candle breaks the ceiling, and RSI hits overbought—that’s my green light. I open a long.
Soon, 1-hour and 4-hour RSI go overbought, signaling stronger momentum. I hold, and BTC pumps hard, hitting high R/R in a short window.
This keeps trades fast and efficient—quick wins or quick stops mean better capital management and less stress. Slow trades? They’re a mental grind, pushing you to close early for tiny R/Rs. 😴
Pro Rules for RSI Success
Here’s how to wield RSI like a trading weapon:
Stick to the Trend : Use RSI in the direction of the main trend (e.g., uptrend = focus on longs).
Confirmation Only: Never use RSI solo for buy/sell signals. Pair it with breakouts or support/resistance triggers.
Fresh Momentum: RSI is strongest when it just hits overbought/oversold. If the move’s already rolling, skip it—no FOMO, walk away!
Customize Zones: Overbought (70) and oversold (30) can shift—it might show reactions at 65 or 75. Adjust to your market’s behavior.
Backtesting RSI: Your Path to Mastery
To make RSI yours, backtest it across at least 30 trades in every market cycle— uptrend, downtrend, and range. Test in volatile markets for extra edge. 😏 Key takeaways:
Range Markets Kill RSI: Momentum oscillators like RSI (or SMA) are useless in ranges—no momentum, no signal. Switch to ROC (Rate of Change) for ranges—I use it, and it’s a beast. Want an ROC guide? Hit the comments!
Overextended RSI Zones: On your entry timeframe (e.g., 15-minute), check higher timeframes (e.g., 4-hour) for past RSI highs/lows. These are overextended zones—price often rejects or triggers a range. Use them to take profits.
Final Vibe Check
This RSI masterclass is your key to trading like a pro—fast R/Rs, big wins, and unshakable confidence . At Skeptic Lab, we live by No FOMO, no hype, just reason. Guard your capital— max 1% risk per trade, no excuses. Want an ROC masterclass or more tools? Drop a comment! If this fired you up, smash that boost—it means everything! 😊 Got a setup or question? Hit me in the comments. Stay sharp, fam! ✌️

Long position for 1INCHUSDT in 4H 2.74 RRLong Position for 1INCHUSDT in 4H with a 2.74 RR
Long 0.1748
TP 0.1904
SL 0.1691

NZD/JPY: Bullish Breakout or Another Fade?NZD/JPY hasn’t closed above the 200-day moving average since July 2024, racking up more than ten failed bullish breaks in that time—seven of them in the past month alone. If today’s probe finds more traction, it could be the catalyst to bring bulls off the sidelines, especially on a close above 88.00 where wedge and horizontal resistance intersect.
If that plays out, traders could look to initiate longs above 88.00 with a stop below it or the 200-day moving average for protection. Minor resistance sits at 88.39, offering a nearby hurdle for the setup. Should that give way, 89.20 or 90.00 stand out as logical upside targets.
Alternatively, if the pair fails at the 200-day moving average again, the setup could flip, allowing shorts to be established beneath the level with a stop above for protection. 87.00 or wedge support around 50 pips lower may come into play as downside targets.
Momentum indicators favour upside near term. RSI (14) has broken its downtrend and moved further above 50, while MACD is on the cusp of a bullish crossover, confirming the signal.
Good luck!
DS

US30: Short setup brewingSitting in a rising wedge with bearish divergence after running into resistance at 43100, the US30 contract finds itself at an interesting juncture on the charts. If it can’t stage a definitive break above these levels, a short setup could be on the cards.
If the contract cannot break and hold above 43100, traders could look to initiate short positions targeting the 200-day moving average initially. If that were to give way, the target could be lengthened to 42000, where wedge support is currently found. A stop above 43100 would protect against reversal.
While MACD has staged a bullish crossover, the momentum signal is countered by what’s still bearish divergence between RSI (14) and price despite the latest bounce.
Given the proximity to month end—a period notorious for window dressing and false signals—the preference would be to wait for another retest and failure at 43100 before initiating the trade.
A de-escalation in trade tensions, lower crude prices and the prospect of a Fed rate cut as soon as July have been tailwinds for the contract over recent days. If it can’t continue to rally in this environment, it questions just what would be required to deliver further upside, just as negative tariff headlines potentially loom.
Good luck!
DS

Breakout on multiple levelsWe're having a breakout on price, RSI and MACD - unless we dump into the daily close.

SPX Bullish Breakout: 18% Upside to $7,300The S&P 500 has broken out of an inverse head and shoulders formation, targeting approximately $7,300 within three months. The MACD shows strong bullish momentum with a recent crossover above the signal line. The price is holding above the 21-day EMA, further confirming bullish momentum.
U.S. Small Caps Eye Breakout as Fed Rate Cut Bets BuildUnless it’s accompanied by a recession, there are few things U.S. small cap stocks enjoy more than rate cuts—especially given how many rely on the kindness of others to fund their growth ambitions. With another soft core PCE report expected at the end of the week, and with some Fed officials signalling a preparedness to cut rates again as soon as July, the ducks look to be lining up for a potential bullish break in the U.S. Small Cap 2000.
Recent price action backs this up, coiling within an ascending triangle on the daily chart just beneath horizontal resistance at 2170 and the key 200-day moving average just above. Price momentum is also on board, with RSI (14) breaking its downtrend and moving further above 50. MACD has crossed the signal line above zero, reinforcing the bullish message.
One look at how price has interacted with the 200-day moving average in the past suggests the higher probability play would be to wait for a break and close above the level before establishing longs, allowing a stop to be placed beneath it or 2170 for protection against reversal.
2320 looms as an obvious target, coinciding with a known resistance level. If hit, traders can assess whether to cut, hold or reverse the trade depending on how price reacts at that level.
Good luck!
DS

ELLIOTT WAVE XAUUUSD H4 update
EW Trade Set Up H4
minuette wave (iv) running?
possible leading diagonl subminuette i upside move from 3120a of 150525 to 3439a of 130625 till now, subminuette wave ii running
alternative: minuette wave (iv) still running
key levels (area)
3390
3355 POC
3310

USD/CAD: Failed Break Leaves Bears in ControlWhether it’s Monday’s bearish pin candle, the rejection at the 50-day moving average, or what increasingly looks like an evening star pattern forming, directional risks for USD/CAD look to be skewing lower following the false break of 1.3750.
Those looking to position for renewed weakness could initiate shorts beneath 1.3750, with a stop above the level to guard against a reversal. 1.3650 and 1.3550 both stand as prospective targets, depending on the risk-reward profile you're seeking.
While momentum indicators are off their lows, with RSI (14) rolling over beneath 50 and MACD still in negative territory, the overall picture continues to favour downside over upside.
For those considering the setup, be aware Canadian inflation data will be released later Tuesday, with the key core rate (the average of the median and trimmed mean reads) expected to ease marginally to an annual clip of 3%. While offshore factors remain the dominant driver of USD/CAD moves, a stronger-than-expected result would likely benefit the trade.
Good luck!
DS

Hong Kong 50: Bulls Back in Business Above 23,700Monday’s bounce from support at 23,200 has seen the Hong Kong 50 push above minor resistance at 23,700, generating a potential long setup to play the broader improvement in risk appetite seen in recent hours.
Longs could be initiated above 23,700 with a stop beneath for protection, initially targeting the June 12 high of 24,429. A break above that would open the door for a possible run towards the March 20 swing high of 24,895.
RSI (14) has broken its downtrend and remains above 50, suggesting bullish momentum may be starting to build again. While not yet confirmed by MACD, it’s beginning to curl back towards the signal line above zero, hinting that too may not be far away.
Good luck!
DS

$SOL Local Bottom FormingCRYPTOCAP:SOL closed the day back within the POI.
RSI oversold.
Should see a retest ~$136 to confirm the local bottom.

Is Altseason Around the Corner? BTC.D looks tired AF!BTC dominance just hit the top of a rising wedge that has been building for over a year. Price is stalling at 65.64 percent, sitting right against long-standing resistance.
Momentum is weakening. Stochastic RSI is at 72 and starting to roll over. RSI is sitting just under 70 and showing early signs of fading.
The structure suggests we are close to a decision. If BTC dominance starts to fall from here, the conditions for an altcoin run are in place.
Key levels to the downside are already mapped. First is 59.97 percent. Then 58.70 percent. After that, 56.88 percent. The 100-week simple moving average is also sitting at 56.51 percent. If dominance breaks below that level, it opens the door for a larger shift in market flow.
Previous retracements in BTC dominance have aligned with strong moves in altcoins. This current setup is technically clean and nearing resolution.
It is not confirmed yet, but the signals are starting to stack. This is a moment worth watching.

Cup of the Morning for DXYThe TVC:DXY seems to be forming a Cup and Handle Pattern on the 1Hr Chart!
Cup and Handle pattern is considered a strong Reversal Pattern where we should expect Bullishness for the USD.
After the 2nd or Equal High to the 1st was formed, Price made a Retracement to the 38.2% Fibonacci level and found Support to the begin forming the "Handle" or Consolidation Phase of the Pattern.
Price must Break and Close above the "Brim" or Equal Highs of the Cup @ 99.113 to Confirm the pattern!
Once confirmed, we can then look for price on DXY to rise up to the next level of Resistance in the 99.6 area!

The 3 Step Rocket Booster Strategy – Bullish Setup BreakdownHey traders!
Here’s a trade idea on GBP/USD using a multi-timeframe trend strategy I call the Rocket Booster Strategy. It’s based on trend strength, oscillator signals, and price action confirmation.
---
📊 Weekly Chart – The Big Picture
The Stochastic RSI on the weekly chart recently pulled back near the 80 zone. This isn’t a reversal — it’s a healthy pause in a strong uptrend. I’m watching for a breakout continuation as momentum builds up.
---
📉 Daily Chart – Oversold Alert
On the daily chart, the Stochastic RSI dropped below 20, signaling that GBPUSD might be ready for a bullish reversal. It’s setting the stage for a solid long opportunity — as long as the trend agrees.
---
🕯 4H Chart – Bullish Engulfing Entry
This is where it gets exciting — a clear Bullish Engulfing pattern has formed on the 4-hour chart. That’s my entry trigger. This confirms the reversal idea with a strong price action signal.
---
✅ Rocket Booster Strategy Criteria
To take a long trade using this strategy, I require all 3 of the following:
1. ✅ Price is above the 50 EMA
2. ✅ Price is above the 200 EMA
3. ✅ A breakout or gap-up is either happening or imminent
All three conditions are currently aligning on GBPUSD — this is a potential high-probability setup.
---
💡 Optional Tip for Automation
If you’d like to automate this entry using alerts on TradingView, you’ll need a paid monthly plan to unlock multiple alerts and advanced conditions like candlestick detection or EMA confirmation.
---
⚠️ Disclaimer
Trading is risky. Always use:
Proper risk management
Well-placed stop-losses
A demo account to test your strategy
And take profits with discipline 🧠💰
---
🔚 Final Thoughts
This is a clean example of trend trading with structure and precision.
I used multi-timeframe analysis, the Stochastic RSI, and price action to time the entry. If you're learning trading, this is a great case to study or test in your journal.
Let me know what you think or how you'd manage this trade.
Happy trading! 📈💥
---

Bitcoin Holds $100k as Risk Assets Shrug Off Mideast TensionsWeakness in risk assets has been relatively contained so far on Monday in Asia, despite the escalation in geopolitical tensions in the Middle East over the weekend—including in bitcoin.
Yes, it’s down, but not by any margin that sets this open apart from the usual. And having bounced after a brief dip below the psychologically important $100,000 level—which also doubles as wedge support—it’s generated a potential long setup if risk appetite improves.
Longs could be considered above $100k with a stop beneath today’s low to protect against a reversal. Targets include $102,500, $106,500 or even $109,000, depending on your preferred risk-reward.
While momentum signals are neutral to mildly bearish, the price action so far has been constructive for the setup.
Good luck!
DS
