Here I buy OST and OST will go upHere I buy OST and OST will go up. The price is testing the major resistance, so now I buy and the bullish breakout will start. And OST will go up. See you up there
Ostbtclong

OST/BTC (4H Bullish Bias)OST/BTC
-The logical resistance at 100 sat has been broken
-Just a few minutes left before the 4H candle closes
-If everything goes well, it is likely to increase up to 128 sat
-We can also see good volume with this breakout candle
-The market is looking Bullish in the short term


OST / Bitcoin | IHS Setup and PlanSo basic pattern spotted. Measured Height of the Head and found target near 200-230 levels. Keep your eye on SL below 125 daily closing price.


OSTBTC is ready for new pumpDuring last days OST showed shortlived pumps and once more its trying to pump from the level where the first pump started. Hourly RSI is on the lowest level and already started to recover. Looks like this time it can be permanent climb. 137 sat is pivot point. Put SL to 130 and TP 165. Good luck

OST (Sept 19) #OST $OST #BTC $BTCBuy : Close to 115 as possible
Sell : 125-135-145
Mid-Hold : 165-200
Stop : 100

Ost/Bitcoin (June 29) #OST $OST #BTC $BTCAccumulate : 160-175
Sellzone : 250-300
Holdzone : 385-565
Stoploss : Under 150


OST/Bitcoin (27 May) #OST $OST #BTC $BTC#BUY #WAIT
Buyzone : Close to 330 as possible
Sellzone : 410-490
Stoploss if price is lower than 310


OSTBTC can dump!I think what traders may be wrong and OSTBTC may DUMP in next day.
See to volume
Telegram: t.me/joinchat/Id7nNEzaTE4hlD6brEJ-Aw

OSTBTC Latest Technical Analysis - Altcoin Technical Analysis.OSTBTC Right in Progress of Adam and eve pattern you wait for confirmation.
You can take a trade after Neckline break Upside with Fully bullish Volume.
Note: This is only for Educational Purpose this is not Investment advice.
Please support the setup with your likes, comments and by following on Trading View.
Thanks
Adil Khan

$OST - LONG - 1D - TRADE IDEA- entry at break of ascending triangle
- stop below support invalidates idea
-targeting previous highs
- Lock in some profits at 50% of current range
- Believe that this is in accumulation range so currently playing inside the range with this play
- may see break higher which will be shown on follow up twitter chart
- good R:R on this trade

Daily Bullish Signal $OST #OST (15 Feb 2019)RED ARROW indicates the EXPECTED Time and Targets
Level Stoploss point up to maximize profit and reduce risk
I'm working all the time, even in Bearish Market

Daily Bullish Signal $OST #OST (19 Jan 2018)BLUE ARROW indicates the EXPECTED Time and Targets
Level Stoploss point up to maximize profit and reduce risk
I'm working all the time, even in Bearish Market

OSTBTC. The support is greatMy new analysis, this time very "fibonacciana"
OST is confirmed as a coin with a lot of volume, and a grit accumulation phase.
YES up

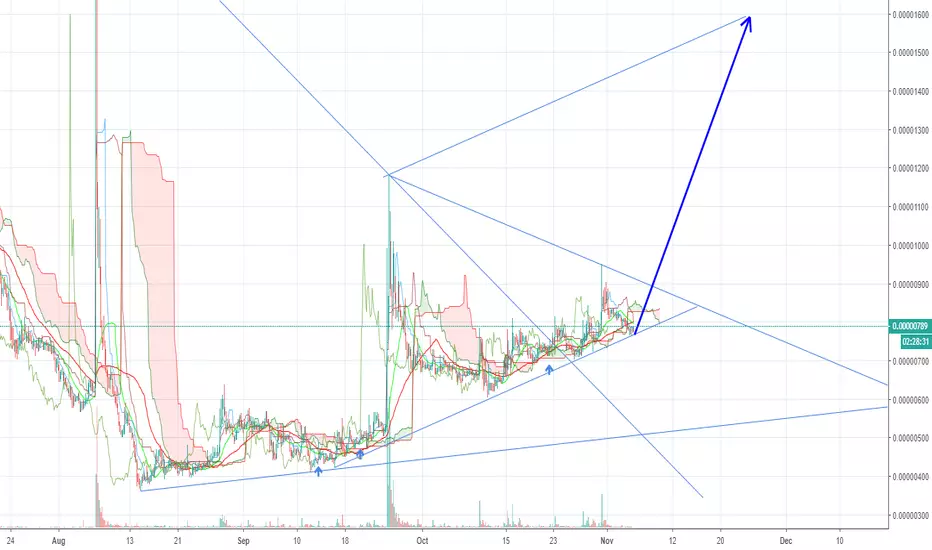
Daily Bullish Signal $OST #OST OST/BTC (05 November)BLUE ARROW indicates EXPECTED Time and Targets
Follow me for more signals daily

Daily Bullish Signal #OST #OSTBTC (13-09)#OST (OST/BTC)
Buy : 400-420
Flash Sell : 450
Short Sell : 470
Long Sell : 500-550-600
Stop : 355
Follow me for more signals daily
PM me if you need help
