Has Bitcoin become a "SAFE" asset ? These charts show that......
After we heard the US Federal Reserve hold rates yesterday, Markets Fell some.
And Bitcoin joined them for a couple of hours but Look now.
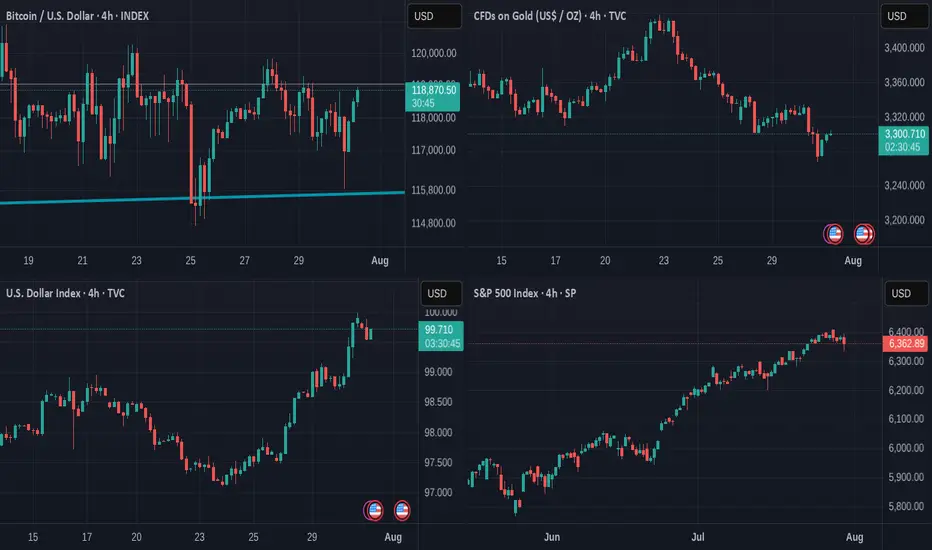
While the $ falls, the S&P Falls, GOLD is the traditional haven of safety and we can see how it Rose in Value over the last 12 hours
The $ has Fallen over the last 8 hours
S&P Stalled for the last 24 hours
And the STRONGEST positive moves over the last 12 hours were from BITCOIN rising, though it is taking a breather for the moment.
SO, has it become a SAFE HAVEN ?
Put it like this. Bitcoin has NOT lost value like it used to when under pressure.
We have yet to see what would happen once it reaches its cycle Top. Will it retreat as it has historicaly...
But for now, it does seem to be a strong store of Value and remains with potential and likelihood of further rises.
The TOTAL CRYPTO MARKET CAP chart below
This shows us that the investor market seems Very confident in the Crypto Market,,Just going from strength to strength.
The TOTAL 2 Market Cap chart shows us something very interesting.
The TOTAL2 chart is the Total Market Cap MINUS BITCOIN
Compare the 2 charts and you will see how the TOTAL chart has risen way over its previous cycle ATH but the TOTAL2 is currently being rejected off its previous ATH line.
This clearly shows us that BITCOIN is the strength in the Crypto Market.
It is the same story on the TOTAL3 chart ( TOTAL minus BTC & ETH )
It is the same on the OTHERS chart ( Top 125 coins minus top 10 by market Cap )
BITCOIN CARRIES THE MARKET
These are early days but the Future of Bitcoin does seem VERY good
So far this cycle, the largest retrace was -31%
This drop was NOT a sharp Drop over a short period of time. It was an expected and controlled drop over 112 days.
But the zoomed out version of that chart tells us something VERY GOOD
PA has risen above and Tested and held that line of resistance that had rejected PA at Cycle Top ATH in 2017 and 2021.
That is a HUGE move and we wait to see if we Hold and move higher away from this line.
SO, Is Bitcoin a Safe Haven ?
It is certainly looking more and more like it.
PA is secure, has held position well and is in Price discovery...slowly and with caution...but always moving forward.
The traditional 4 yeat Cycle would end in late Q4 this year and so we have to wait and see what happens then.
But Bitcoin PA has moved into New ground on so many fronts now.
The traditinal BEAR market may not appear, in which case, YES, Bitcoin could become a New SAFE HAVEN
Buy Bitcoin
Hold Bitcoin
OTHERS-D
#Others Update #1 – July 23, 2025#Others Update #1 – July 23, 2025
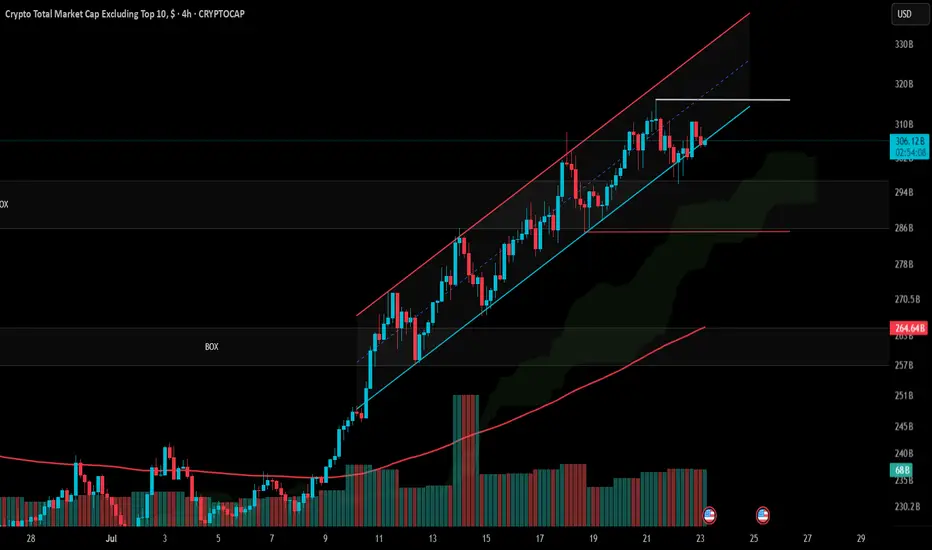
The Others chart (crypto market cap excluding top 10) had been following a well-defined ascending channel. However, in recent candles, the price has started slipping below the lower boundary of this channel — a potentially bearish sign for altcoins.
Despite still technically being within the broader impulsive structure, it’s critical for price to reclaim and hold above $316B to maintain bullish momentum.
If the market corrects back to the origin of the impulsive leg, we may see a drop toward $285B, which would likely cause a 10–20% decline in altcoins overall.
The structure is not entirely broken yet, but Others is hovering at a risky edge. If you're holding altcoins, now is the time to be extra cautious.
We start ALT Season now with 3 targets!Hello guys,
As you can see we have 3 targets🎯 green, blue, red,
which target we will reach?
It depends on the Fractal scenario on the right, So we will wait 2 clear trends,
each one has 3 tops and Clear correction between the up trends,,
Don't lose your positions and don't jump between currencies!
Also Don't burn your wallet with Future!
Spot is Enough!

Do you believe in miracles?Others dominance is crazily undervalued way beyond anyone's imagination, it's been a crazy 4 year bear market for alts. Big question is, when will it end. Can't fathom this industry getting killed by exchanges, just look at others.d go man, crazy low.
If this were the equivalent to 2019/2020 and 2015/2016, any buy in this range is a one in a lifetime opportunity.
If this is like December 2016, well, that would save us years of struggle. Hard to tell what's going to happen but I still believe Trump will give us an extended bullrun that will peak when the FIFA world cup is on somewhere around July 4th 2026.
Great depression? this goes way beyond that, what more of a great depression do you want. Just brutal.

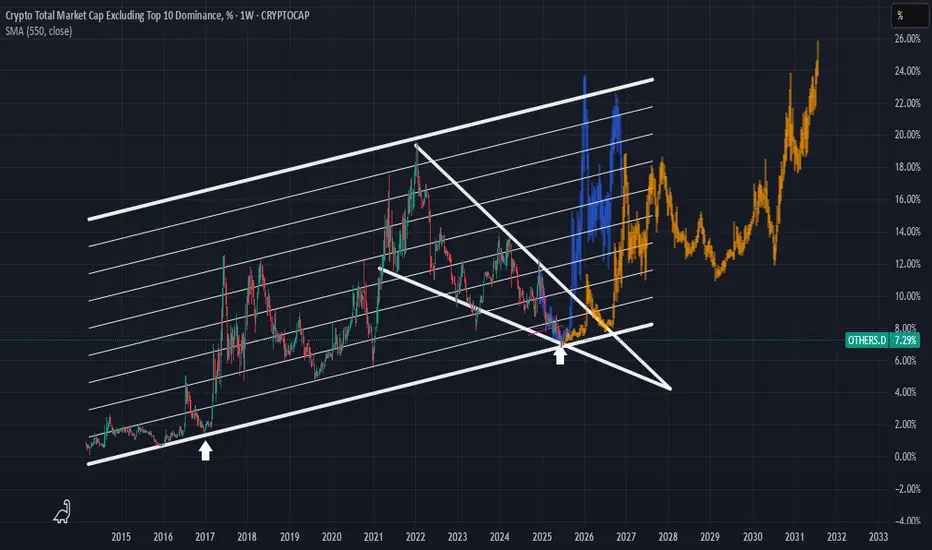
Very similar to January 2016You are looking at the Crypto Total Market Cap Excluding the Top 10 cryptocurrencies (OTHERS.D) on a weekly timeframe. This chart is often used as an "Altcoin Index" to gauge the strength of the broader cryptocurrency market beyond the major players like Bitcoin and Ethereum.
Here's my observation about being in a period similar to January 2016.
The technical analysis on this chart is built around a few key concepts:
1. Long-Term Ascending Channel: The dominant feature is a large parallel ascending channel that has contained the altcoin market cap's movements since 2015. The upper line has acted as a resistance level during bull market peaks, and the lower line has served as a major support level during bear market bottoms.
2. Historical Fractal (The "January 2016" Idea): My idea centers on a historical comparison, or a "fractal."
- The first white arrow points to a period in late 2016. At this time, the altcoin market cap found a bottom right on the support line of the ascending channel. This bottoming phase preceded the explosive 2017 bull run.
- The second white arrow points to a projected time in late 2025 / early 2026. The chart suggests that the market is currently in a similar bottoming pattern near the same long-term support line.
3. Falling Wedge: I've drawn a large falling wedge pattern starting from the peak in late 2021. This is typically a bullish reversal pattern, suggesting that the long downtrend could be nearing its end. The price is currently interacting with the apex of this wedge, a critical decision point.
4. Price Projection: The orange and blue bar patterns are copies of the price action that followed the 2016-2017 bottom. By pasting this fractal to the current time, the chart visualizes a potential future where history rhymes, leading to a massive new bull market for altcoins extending into 2027 until the end of the roaring 20s.
The Bullish Case (According to the Chart)
The argument presented by this analysis is clear:
• The altcoin market is at a historically strong support level (the bottom of the ~10-year channel).
• This is the same support level that kicked off the massive 2017 bull market.
• The market is consolidating within a falling wedge, which has a higher probability of breaking to the upside.
If this analysis holds true, the current period could be seen as a significant accumulation zone before the next major market expansion, much like the period around January 2016 was.
Important Considerations and Risks
While this is a compelling technical setup, it's crucial to maintain a balanced perspective. Here are some factors to consider:
• Past Performance is Not a Guarantee: This is the most important principle in financial markets. While historical patterns can provide valuable insight, they do not guarantee future results.
• Market Dynamics Have Changed: The cryptocurrency market of 2025 is fundamentally different from that of 2016.
• Maturity and Size: The market is significantly larger and includes substantial institutional investment, which can alter market behavior and volatility.
• Macroeconomic Factors: Global economic conditions, such as interest rates and inflation, now have a much stronger influence on the crypto market than they did in its earlier days.
• Regulatory Environment: Increased global regulatory scrutiny can introduce uncertainty and risks that were not present in the 2016-2017 cycle.
• Subjectivity of Technical Analysis: The trendlines and patterns are drawn based on an analyst's interpretation. Another analyst might draw them slightly differently, leading to a different conclusion.
Conclusion
The idea that "we're in January 2016 all over again" is a valid interpretation based on the technical patterns in this chart. The analysis points to the altcoin market being at a critical long-term support level, similar to the setup that preceded a major historical bull run.
This chart lays out a clear bullish roadmap. However, everyone should treat it as a potential scenario, not a certainty. I'll continue to monitor if the price respects these historical levels so that you guys are mindful of the broader market and macroeconomic factors that could influence the outcome.
Disclaimer: This analysis is for informational purposes only and is based on the technical analysis presented in the user-provided image. It should not be construed as financial advice. All investment decisions carry risk, and you should conduct your own research.
Altcoins Market Cap: We on the Verge of a 5T Exposion!Hey crypto traders! Let’s dive into this monthly chart of the Altcoins Market Cap. You won’t believe what’s brewing!
We’re currently approaching a critical channel support at 200B, a level that might act as a springboard for massive rally — check out the jumps from channel support in 2019 and 2023! Each time the market cap hit this support, it skyrocketed, and now we’re at that pivotal moment again.
The chart projects a jaw-dropping target of $5T within the next 24 months if history repeats itself!
The price action shows we’re testing the lower boundary of this ascending channel, with the market cap sitting around 239.65B. A bounce here could send altcoins on a parabolic run, potentially hitting 5T by mid-2026. But if support fails, we might see a dip toward 100B — let’s keep an eye out!
Key Levels to Watch:
Support: 175B (channel support)
Resistance: 1.55T, 5T (projected target)
Breakdown Risk: 100B
Are altcoins about to explode to 5T, or will we see a deeper correction? Drop your thoughts below!
PS take a look at others vs. btc price action here:

$OTHERS: Decision Time for AltcoinsDecision Time for Altcoins
Unless something drastic changes — like Trump firing Powell and cutting rates to 0% — the chart suggests a potential correction.
MACD is overheated, RSI is overbought, and we're hitting major resistance. An ABCD or extended ABCDEF pattern seems likely, with a upside target around $260B amd a downside support at $230B in total altcoin market cap.
Of course, the market can always choose to ignore the signals and continue its uptrend directly to the next resistance at $260B.
Stay sharp. Let’s see how it unfolds.
DYOR.
#Altcoins #Crypto #Bitcoin #ETH #MACD #RSI #TechnicalAnalysis #CryptoMarket #DYOR #PriceAction

APE coin cup & Handle. This chart shows good potential as the #Alts start to take back center stage form #BTC
neckline around 79c
could be a triple if Alts can sustain an uptrend.
it's been a while
but the time is now
if it is to be the case.

#OTHERS.D ~ Do you believe in Castles in the SKY?I believe that the Others dominance metric divided by an ounce of real money #Gold gives us a valuable insight into the fabled altseasons.
Because as this chart shows theres only been 4 in actuality
and you normal get a double bubble in a cycle.
So I believe we are at the cusp of turning things around as most people have given up on the concept of altcoins ever pumping again.
But it was just the business cycle #PMI that has depressed prices for the past few years.

Next goalFrom a general view of the chart, we find, according to the analysis, that this rise is not a motive, but rather a correction, and this indicates that there is another strong decline coming soon unless it breaks the analysis failure area specified above.
*In principle, I am not a supporter of any direction, but I am only giving my point of view, which may be right or wrong. If the analysis helps you, then this is for you. If you do not like this analysis, there is no problem. Just ignore it. My goal is to spread the benefit. I am not one of the founders of the currency.

OTHERS data points to biggest ALT-Season Good Day Investors and traders,
This the OTHERS on the weekly and I have taken some measured moves in what could be expected in time and price.
The OTHERS chart in my opinion is the last form of the higher risk curve which generally happens at the very end of cycles The others does not include the top ten crypto, so it a very good form of risk on.
I have been looking at the OTHERS chart fairly often of recent times because this is the time for it to really outshine Bitcoin and lead the market with fairly explosive gains.
I have marked a couple of possible time lines that could occur and both seem to be lining up in sort of way or another. From what I can see, others has one big wave remaining, and it’s the one you don’t want to miss
The Indicators
Fibonacci retracement
I have placed a potential take profit zone from the 1.272 to the 1.618 levels and anywhere in between. I have added an up trending channel that OTHERS would have to hold to stay somewhat relevant or then could be susceptible to adjustment.
2.RSI
I have measured the first breakout of the RSI from the 2015-17 and 2019-21 bull runs along with this one so far. The one more relevant to us is 2015-17 as this is the cycle we are more closely following. There seems to be a recurring trend of 90 plus bars before a top to OTHERS. One more thing that really stands out to me in the RSI this the first time it has shown a very strong bearish divergence. normally it seems to maintain or gain strength. right to the very end. time will reveal the real issue here.
3. ISO
The average sentiment oscillator to also show very consistent data for us. I have two measurements. The one points to late July and the the other late October. To me this could be the potential ALT-season time frame from July as it fizzles in the October time frame.
My suggestion to you is follow what you have been taught so far, do not get greedy, take profits when they are there and trust your game plan and stick to it. ALT- SEASON can you a lot of money, or lose you a lot of money. By design, its there to take any profits you have may have, or catch any late coming stragglers. Don’t get caught up in the hoopla.
Once again, I ask you for you input, I really want to hear from you.
Check my bio for more links and information
Kind regards,
WeAreSat0shi

Parcl - PRCL-USD - 30 Million Market Cap (100x Potential)www.tradingview.com
CHATGPT Research Summary:
Parcl: Unlocking Real Estate Exposure on the Blockchain
Introduction:Parcl is a groundbreaking decentralized platform that enables traders and investors to speculate on real estate market price movements much like they trade crypto or equities. By combining real-time housing data with blockchain technology, Parcl offers around-the-clock, borderless, and highly liquid exposure to global residential real estate markets. In this comprehensive blog post, we’ll explore what Parcl is, how it works, what it means to own the EGX:PRCL token, the unique opportunities it provides for investors (including AI-driven strategies), its core strengths, and the risks and challenges it faces. The tone is professional, investment-focused, and designed for the TradingView audience.
What is Parcl and How Does It Work?
Parcl allows users to trade real estate price indices for global cities without ever owning or transacting physical property. Each index represents the aggregated median price per square foot/meter for residential properties in a specific city. Users can go long or short on these indices using perpetual contracts with up to 10x leverage, entirely on-chain and settled in USDC.
Built on Solana, Parcl leverages the blockchain's high speed and low fees to offer a seamless and cost-efficient trading experience. Users only need a Solana-compatible wallet (e.g., Phantom) to deposit USDC, select a city index, and place a trade. There are no barriers such as down payments, brokers, or escrow delays — just rapid, decentralized access to global housing markets.
Data integrity is ensured through Parcl Labs, which aggregates millions of housing data points daily to generate real-time city indices. These feeds are streamed on-chain via oracles like Pyth Network, ensuring transparency and reliability.
What Does It Mean to Own EGX:PRCL ?
The EGX:PRCL token is the governance and utility token of the Parcl ecosystem. Holders of PRCL can:
Participate in protocol governance by voting on changes to platform parameters, fee structures, and market expansions.
Access premium real estate data and analytics through Parcl Labs.
Receive airdrops, rewards, or staking incentives as part of community growth and loyalty initiatives.
While PRCL doesn’t currently offer revenue sharing, it grants holders influence over protocol decisions and potential future economic alignment as the ecosystem matures.
A New Asset Class for Investors and AI Agents
Parcl opens up a completely new asset class: blockchain-native, synthetic real estate exposure. This has major implications:
For retail investors, it democratizes access to real estate, which was previously limited by geography, capital requirements, and illiquidity.
For sophisticated traders, it enables granular bets (e.g., short New York, long Miami) and high-frequency strategies previously impossible in traditional real estate.
For AI agents and algorithmic investors, Parcl provides composable, on-chain access to a diversified asset class that can be rebalanced and traded programmatically.
In short, Parcl makes real estate a liquid, programmable, and globally accessible financial primitive.
Core Strengths: Why Parcl Stands Out
Solana-native speed & cost-efficiency: Enables fast execution and micro-investments ($1+), ideal for retail users and automated agents.
Unique data infrastructure: Parcl Labs’ real-time indices provide unparalleled accuracy and granularity.
Sophisticated perpetual AMM model: Handles liquidity and market balancing with dynamic funding rates and cross-margining.
Growing community and product-market fit: With 80,000+ users and over $1.3B in cumulative volume, Parcl is becoming the most liquid real estate trading venue in the world.
Risks and Threats to Consider
Regulatory uncertainty: Synthetic real estate products may eventually face classification as securities or derivatives in some jurisdictions.
Liquidity dependencies: The AMM model depends on sufficient USDC liquidity pools; low liquidity could cause slippage or insolvency risk.
Smart contract vulnerabilities: As with all DeFi platforms, there is non-zero risk of exploits or oracle manipulation.
Platform dependency: Parcl is tightly coupled to Solana — if the chain experiences downtime or congestion, the protocol may be impacted.
Investors should also be aware of token unlocks and potential dilution from early backers and treasury allocations.
Future Outlook and 100x Potential
With a current market cap near $30 million, Parcl represents a high-upside, early-stage bet on tokenized real estate. If the project gains traction and achieves broader adoption, it’s feasible to imagine a future market cap of $2.5 to $3 billion, representing a 100x potential from current levels.
Factors that could drive this include:
Expansion to more global cities
Increased PRCL utility and staking incentives
Growing demand for real-world assets (RWAs) on-chain
Enhanced support for automated and AI-driven strategies
Final Thoughts
Parcl is redefining what it means to invest in real estate. By transforming local, illiquid property markets into a global, composable, and liquid asset class, Parcl enables both human and AI investors to access and trade the housing market like never before.
Whether you’re a trader looking for uncorrelated exposure, a long-term investor seeking innovation, or a technologist building AI agents — Parcl offers a compelling opportunity.
⚠️ Disclaimer: This is not financial advice. Always do your own research and make investment decisions based on your individual risk profile.

Really quick TOTALS charts - possible WARNINGS
It is Very clear when you look at these 4 charts
TOTAL - TOTAL2
TOTAL 3 _ OTHERS
The Top Left chart is the TOTAL chart and is the only one that includes BITCOIN and it is the ONLY one that is above all of its MA's
All of the other charts are heading into resistance on one or more MA's
ALT coins are sailing in to headwinds.
THIS DOES NOT MEAN THEY WILL GET REJECTEWD BUT IT OOES MEAN YOU SHOULD BE CAUTIOUS
Simple as that

Mr. Rusell (Small Cap index) & Altseason go hand in hand. That's right it does.
Why?
Because small businesses employ nearly half of the workforce of the United States.
So when financial conditions exist for confidence to grow at this level of the economy expressed via hiring and expansion of said businesses the ripple effects are huge.
Which can be seen during Altcoin boom's (banana zones)
This cycle especially as one whole Bitcoin is out of reach for the common man. When Retail hot money does return to crypto expect small cap low numerical valued coins to really start outperforming BTC

DMTR/usdt next target 1.2$ BULLISH MEGAPHONEHi trader,
We witness the biggest altseaon in history. Dont fall for those kids cry that we dump lower.
Last low was buy for altseason.
Im introducing you the DMTR chart and it looks like it has potential for a bullish megaphone.
Trust me this coin will go viral soon and have a lot volume and exchanges.
u looking for a altcoin that has over x50 potential not a problem im telling you now.
sincerely,
loyaltrader777

Altcoin Season - Just around the corner!!!In this analysis I share my hypothesis on #OTHERS CRYPTOCAP:OTHERS as to why the big awaited alt season is right around the corner !
After analysing how the Trump mania season unfolded, I could see plenty of similarities:
1. Price filled the supply before the last retrace - gray rectangle
2. Then it broke the downtrend line and made a decent move up - red dot
3. Price correction to the 618 retrace on fib AND in the supply -> became demand from #1
4. RSI formed a hidden bullish divergence, marking a potential start of the rally
5. Time passed from #2 trendline breakout to the big impulse -> around 50 days
-> now we are around 60 days, which means more time to accumulate, bigger impulse
In an ideal scenario, the total OTHERS cap (all crypto excluding top 10) should at least reach the last high of 450 billions, and to pour some hopium, to around 600-700 billions...
So if you filled your bags around recent prices on your alts, you should expect at least 10-20x imo!

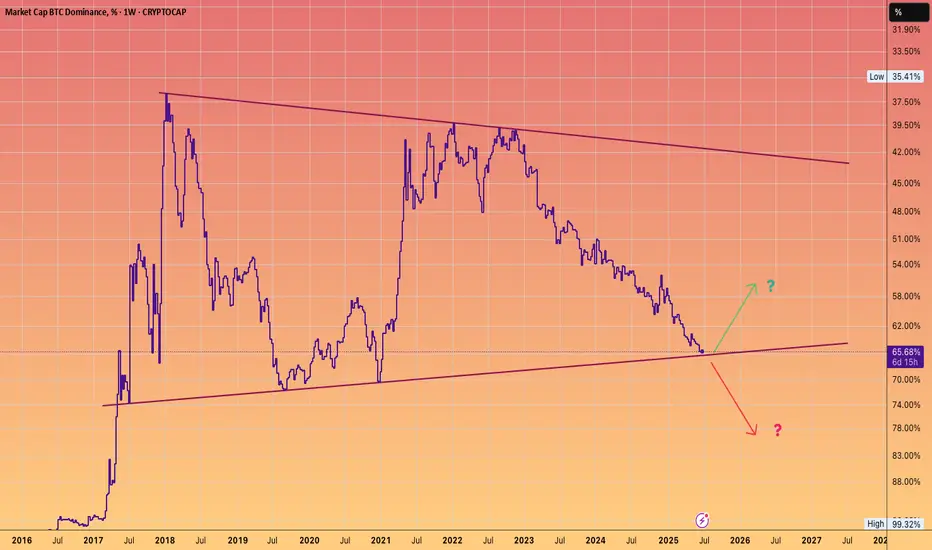
BTC DOMINANCE at pivotal juncture.Which direction do you favour?
The chart is inverted, so the up move will result in #Alts outperforming #Bitcoin.
Stablecoin Dominance vs Altcoins – Final Altseason Loading?This chart visualises a powerful relationship — stablecoin dominance (USDT.D + USDC.D) versus OTHERS dominance (i.e. altcoins excluding BTC and ETH).
Put simply:
When this chart moves down, stablecoins are flowing into altcoins — risk-on behavior, altseason ignites.
When it moves up, capital rotates back into stables — risk-off behavior, weakness across alts.
This has nailed every major altseason impulse and correction cycle over the past few years.
Right now, we’re seeing this pair push higher into a key supply zone — the same distribution range it previously broke down from. My expectation is a retest of that breakdown zone, which should align with a short-term correction in the altcoin market.
📉 Once this retest plays out and we see signs of weakness at supply, I anticipate continuation bearish in this pair — leading to stablecoins flowing back into altcoins.
That next leg down into higher time frame demand could mark the final altseason push, before the broader market tops out. If we follow the usual cycle pattern, that last alt impulse will likely drag retail back in for the top — just before distribution takes over and the bear phase begins.
🧠 In short:
Push into supply → altcoin correction
Breakdown → capital rotation back into alts
Final altseason + market top → bottoming of this chart + reversal bullish
This will be a key chart I’ll track closely over the next few months — it offers one of the cleanest reads on altcoin liquidity flow and timing for top formation.
1W:

USDT.D/OTHERS.D - Altcoin Season IndicatorPrice rejected from the 3M HTF supply and major BSL on the prior highs. Price has now gave a confirmed 1W bearish market shift, indicating a market wide altcoin reversal is playing out and the next bullish impulse higher isnt far off....
Watching for rejections in this weekly supply on this pair as marked and looking for a bearish daily market shift to give confirmations of a potential reversal bearish in line with the recent weekly bearish market shift that occurred from the BSL sweep into 3M supply and refined supply within it.
As shown, this chart is an altcoin indicator and im expecting that last altcoin season and cycle to occur after this chart tops out into supply and then continues lower into the SSL low at 0.29% and into the 3 month demand below it.
Seeing similar indications from the other charts shared like BTC.D and BTC.D+ETH.D+USDT.D+USDC.D, where they show continued weakness in alts for now with a HYTF bullish reversal in altcoins not far off.
3D:
1W:

BTC Dominance Looking very bullish CRYPTOCAP:BTC.D should go up towards 66% and expect the CRYPTOCAP:OTHERS to take a hard dump. Bull flag pattern in the short term.

Altcoins (Market Cap) - Excluding Top 10 Coins - Inverted H&SBullish setup on the daily chart. CRYPTOCAP:OTHERS have once again made a inverted head & shoulders pattern which is a bullish reversal pattern. With the yellow chart below showing the Global M2 Liquidity index breaking out aswell. With more money in circulation, the propabilty is that more money will enter the market over time. Although, there can be latency.
For now I will trust the patterns in the chart of Others and follow it to see IF we can confirm the Inverse H&S. We have to break the neckline which should be around 310-325 B for June and July. But still, after that we need a pullback to confirm that neckline and make it support for continueation.
It´s a very interesting world right now. And much can happen. But IF this break out. It would probably be one of the most explosive bull markets to remember for a long time.. I myself are holding quality coins and tokens. Im not in memecoins, whats so ever. With the adoption happening right now in crypto I don´t believe that is the right market to be in right now.
Nothing on this profile should be interpreted as financial advice. Always do your own research and investment decisions. Im only expressing my thoughts and beliefs. Nothing else. Crypto is a risky business but It also has a lot of reward If being right. I can´t find equal yield in any other markets for now. If you know any, plz comment below =)
BINANCE:BTCUSD
CRYPTOCAP:OTHERS
CRYPTOCAP:TOTAL
MARKETSCOM:ETHEREUM
BINANCE:SOLUSD
BINANCE:SUIUSD
ICEUS:DXY

Altcoin Cycle - Cycle bottoms spottedAs I demonstrated on this picture. I believe I identified the cycle bottoms and marking a new cycle low. With the BITSTAMP:BTCUSD price rising now and CRYPTOCAP:BTC.D about to meet hard resistance levels, I believe this will increase the propability of a start of the altcoin cycle. Also known as the Altcoin season.
CRYPTOCAP:OTHERS
CRYPTOCAP:OTHERS.D
COINBASE:ETHUSD
BINANCE:SOLUSD
INDEX:BTCUSD
BINANCE:BTCUSD

others - altcoins It looks like the altcoin season is about to begin and we will witness an alt party or alt season.
