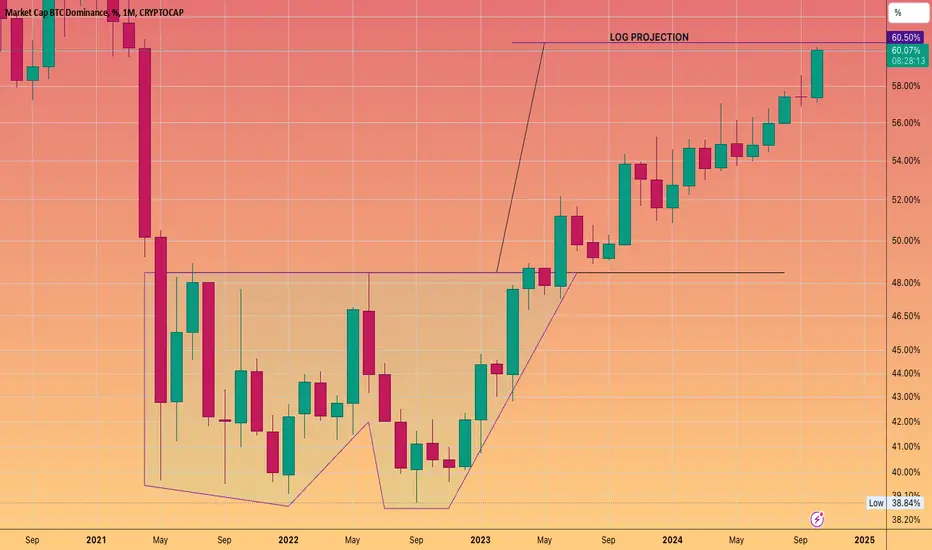
TP zones for OthersThis shows a massive cup and handle structure. TP zones are mentioned in this figure.
OTHERS-D

Alts market cap others#Alts market cap OTHERS Major downtrend breakout completed on weekly linear chart!
#Altcoins are generally poised for new highs!

Altcoins excluding Ethereum about to complete right shoulderBreaking above the neckline of this inverse head and shoulders can take the Others chart’s price action to around 670 billion. *not financial advice*

$TOTAL3 & $OTHERS Alt Season Breakout vs $BTC.D !!!If you’re still wondering whether Alt Season is here or not, this is the only chart you need to see to prove it is.
BTC.D has been going down while CRYPTOCAP:TOTAL3 has broken previous ATH with CRYPTOCAP:OTHERS lagging a bit behind.
This shows the rotation from CRYPTOCAP:BTC -> Mid Caps -> Small Caps
Monetary policy, more importantly rate cuts, have signaled “Risk On”, and the market has responded accordingly.

Alts about to go vertical CRYPTOCAP:OTHERS on the verge of a breakout into a potentially dizzying rallye.
Probably cut short tho some time around Q1 2025.
Still enough time to make it – LFG!

Altcoins are about to run hard!Good day Traders-investors,
Today im looking at the others chart. This only altcoins lower than top ten and it excludes stable coins. I have provided three different time lines, The one week (Top left) the one month (top right) and the 2 week on the bottom. All of them are looking very bullish and are building to fairly substantial move over the next two months.
This also coincides with the timeline of the cycle (not included here) a big move is coming. According to the cycle (bitcoins cycle) bitcoin will run for approx 4 weeks, top out and then correct. The bounce of the correction will lead to altcoins top weeks after bitcoins.
The others first need to pass the area of 156 158 million as a first major resistance level. After that a run to 256 million is likely in fairly quick succession. If the others does happen to hit this level it will serve as major resistance and should top out there. I would most likely expect it to hit it than not to.
Indicators to look for..
On the weekly, the RSI has broken through the resistance levels and right now is retesting it as support, all good.
On the monthly, The RC1 3 lines has an all important cross with the red line. The ASO is about to have a across with the blue line crossing above the red line.
On the 2 week, the RSI is trying to push in the last resistance area, the rci3 lines have already had major movement are aligned for more growth and the ASO has had a cross and looks to be widening.
These are all very positive for the OTHERS.
please don't hesitate to ask any questions or add comments down below.
Kind regards
WeAreSat0shi

#Altcoins run hasn't even started yet!#Alts market cap #Others completes the right shoulder of the cup and handle formation on a weekly basis!
Epic moves that will turn into #altseason are inevitable!

Simple Conditions for Alts to Continue Moving vs BTCVery simple chart and conditions for altcoins to gain or lose dominance vs Bitcoin in the present market:
Others dominance needs to hold above ~9.15% and break and then hold above ~10.5%. Do that and it'll keep gaining dominance towards ~12-13%
Lose 9.15% and fail to reclaim it a 3rd time and alts will continue losing market dominance vs Bitcoin, heading down towards ~7.5-8%
I like to think there is a good chance we at least test the area above 10.5% seeing as we failed to remain below 9.15 after two attempts, the 2nd with a higher low. Failed breakdowns often tend to lead towards breakouts or at least breakout attempts (and vice versa)
That said, we may still yet test 9.15 or below one more time and... if we do, we'd want to see another higher or at least a same low and then a recovery of 9.15 if lost for it to head back up towards 10.5.
Some very roughly drawn possible paths are shown on the chart.
Best of luck!

Others x Altcoins #Altcoins are in the early stages of a parabolic run!
#Alts market cap #Others is preparing for the mega rally phase seen in 2020-2021!
#Altseason gets closer every day!

Don't F@ck up the Banana zone!This is the Others marketcap vs the Bitcoin Market cap chart.
With their respective Banana zones for the past couple cycle and the current one we have already started.
The KEY takeaway is you should be feeling the FOMO and kind already have been deployed into your favourite #Alts
This #altseason may yield one of the worst performances in a cycle --- which I have warned a few times now. And finish sooner than you think.
If you had waited for confirmation of a altcoin breakout and rotated/bough at the sad face this how your returns would have been crippled.
21 X ----> 5.8X 2017
6.4X ----> 3X 2021
3/4X -----> 1.75X/2.3X 2025
Drastically different.
I hope you have found this chart informative. Smash the likes.

The real excitement The real excitement starts when this trend line breaks. Until then, the higher CRYPTOCAP:BTC climbs, the more funds will be available for rotation.

BITCOIN DOMINANCE about to hit double bottom target.Let's see how it reacts once there
Does it pus on through
tap it
does it consolidate
or start its reversal
Altcoins - Basing in October: Will November Bring the Big Move?It seems we’re still in a basing or rotating cycle. We’re close to a trendy move, regardless of whether it’s bullish or not, as we near the end of this consolidation phase.
October has turned out to be #Flatober instead of #Uptober. That’s alright; the tighter the consolidation, the greater the chance November will make a definitive move in any direction.
I still lean bullish, but this week’s daily price action is a bit worrisome. Crypto appears to be used as a hedge, while equities remain the predominant risk-on asset going into CPI, making new highs as crypto retraces back to last week’s initial levels.
Basing for #October > Moving on to #November.
OTHERS Dominance - Altcoin DominanceThe chart is OTHERS.D. Essentially altcoin dominance in the market and an indicator of altcoin strength in the market.
Price is respecting a HTF uptrend since 2020, tapping into the HTF trend line which kicked off the prior altcoin seasons in the last cycles on each tap. Price is also coming into the HTF monthly demand range with high volume as price mitigates this area. We are also following the HTF bullish orderflow thats been established since 2020. Over the last few months price has capitulated into HTF demand, fulfilling all my targets and we are forming a range in key levels, whilst establishing some bullish orderflow on the daily timeframe from these lows and key levels.
I think based on the range profile on the daily, we are accumulating here in a local accumulation range, supported by high volume nodes on each wick into these levels, with a sweep of the range lows and now establishing bullish orderflow in the daily range from our HTF bullish levels where ive anticipated the HTF bullish reversal to form as covered in my prior forecasts and breakdowns.
I believe this is the start of a reversal setting up on OTHERS.D, from these HTF bullish levels and we should start to see the altcoin market pick up as this drives higher..
My first draws on LQ are at the 10.13% and 10.5% levels of this daily range.
Once price closes above the prior weekly swing high at the 10.5% level, this will confirm a new weekly HH and a shift in trend from the weekly timeframe, which should then follow into the monthly putting in a new HH in line with the HTF trend.
3M:
2M:
1M:
2W:
1W:
1M/1W/1D:
3D:
1D:

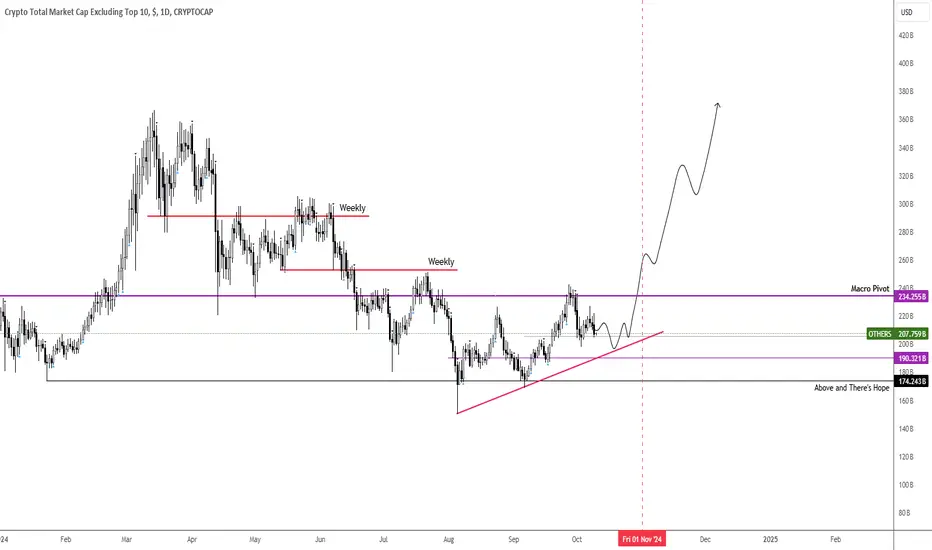
OTHERS / Altcoin Index ready to break to new highs?As we approach the next FOMC meeting where we most likely see the first rate cut, will Altcoins start to perform again? Since the march highs we had a big retracement.

CHEAP ShitcoinzIf you believe in the Crypto 4 year cycle
Here is a thread of cheap altcoins in USD terms, that have good technical patterns or sitting on previous support zones from which prices have rallied before.
There are no guarantees only probabilities.
Your capital is at HUGE risk gambling on S coins.
With that being said.
Let's kick it off with LOOM network.

$OTHERS Altcoins One Last 25% Leg DownAltcoins looking like they've nearly bottomed.
Price action closing below the Weekly 200MA and .236 Fib setup the last 25% leg down.
I expect CRYPTOCAP:OTHERS to top out in Q4 2025 ~2.1T which is the 4.764 fib where last cycle topped at.

What about altcoins, will the "BULLRUN" begin !What about altcoins, will the "BULLRUN" begin !
In this review:
>Others Marktecap
>Total2 Marketcap
>Total3 Marketcap
>Others Dominance
>BTC Dominanace
>ETH/BTC
>ETHUSD many forms
>ETHUSD/NVDA
Lets start with Others Marketcap
--We see that the volume is slowly increasing in the retest zone. this is positive for us.
When we examine the Rsı levels, we see that it is at the covid level. for such an index, this is "oversold"
RSI(14) 1w and Gaussian Channel
CM Slingshot and LMACD
--------------------------------------------------------------------
TOTAL2 Marketcap 1w
level 1= Accumaltion
Trend mildline
level 2= Bullrun
1008 passed from the summit to today. That's enough :D
Total2 with Keltner Channel
-----------------------------
Total3 Marketcap
"SAME"
2020 vs 2024 !
--------------------------
Others Dominance
is waiting for the UP movement at the channel bottom leve =)
-----------------------------------------
ETH/BTC 1w
2016-2024
------------------
ETHUSD
CHart 1/5
Ethereum Log Curve Zones
Chart 2/5
RSI Level and 1008 days
2020 vs 2024
Chart 3/5
Keltner Channel // Top, Bottom and Retest zones
Chart 4/5
-Bullrun EVE
Chart 5/5
CYCLE chart ( just some MATH:D)
Parallel Channel MODE
------------------------------------------
TOTAL2/Nasdaq
3...2...1... GO !
----------------------------------------
ETHUSD/NVIDIA
Its Ready =)
When you analyse all these chart, the following rings in your head:
>>>ALTSEASON is inevitable.

ALTCOIN CRASH COMING
MartyBoots here. I have been trading for 17 years and I am here to share my ideas with you to help the Crypto space. The Bull market is here
Even tho the bull market is here we can still have crashes. The ALTCOIN market has just hit a critical level . This needs to be watched carefully.
Please watch the video for more information
Have a great evening.

AIRDAO on the comeback trail?This S coin has undergone a rebrand it seems , a main-net release?
I don't know, I rarely dive into the fundamentals of a project... whilst a narrative is nice
and sector rotation is a thing
the age of the ALT coin and any the state of the community / marketing are generally the most important.
Which is all told in the price action of the charts anyway! :)
Supply/demand ---> support/resistance ---> accumulation/distribution
anyway as this chart shows there may be life in this old dog of a S coin.
And it is currently in a low risk (USD) entry zone.
(Don't forget to keep a Moonbag in these S coins as you take profits ... as you never know if it will be blessed this cycle with extreme out performance)

OTHER.D Bouncing off a key trendlineTHIS IS IT
THIS IS WHAT YOU HAVE BEEN WAITING FOR THE PAST 3 YEARS.
#ALTSEASON
IS UPON US
As Raoul PAL says Don't F**K This UP
WE HAD the pre party PUMP
NOw is the real deal
(caveat it may not fulfil your expectations so we must take what we can get)

defi summerthis chart portrays the total market cap of the defi dominance.
it's currently sitting at 3.98% with an inverse h&s on a weekly timeframe.
my projected upside target sits at the ath of about 7.95%
---
the last meaningful defi summer we experienced was in 2020.
☀
let's make this one count.
---
i'm projecting this defi market cap dominance to hit 8% into the presidential election where a soft top will likely be created.
i've shared a lot of plays over the last few months with our members, and we're just chilling into november.
---
tldr; hodl into a 3-4 month long alt season, and tp into the presidential election.

SOL/OTHERS Chart is MIND-BLOWINGSolana has destroyed the cumulative performance of every Altcoin by 627% since Christmas 2022.
All you had to do was buy CRYPTOCAP:SOL and chill bruh
