Do you believe in miracles?Others dominance is crazily undervalued way beyond anyone's imagination, it's been a crazy 4 year bear market for alts. Big question is, when will it end. Can't fathom this industry getting killed by exchanges, just look at others.d go man, crazy low.
If this were the equivalent to 2019/2020 and 2015/2016, any buy in this range is a one in a lifetime opportunity.
If this is like December 2016, well, that would save us years of struggle. Hard to tell what's going to happen but I still believe Trump will give us an extended bullrun that will peak when the FIFA world cup is on somewhere around July 4th 2026.
Great depression? this goes way beyond that, what more of a great depression do you want. Just brutal.
Othersdominance

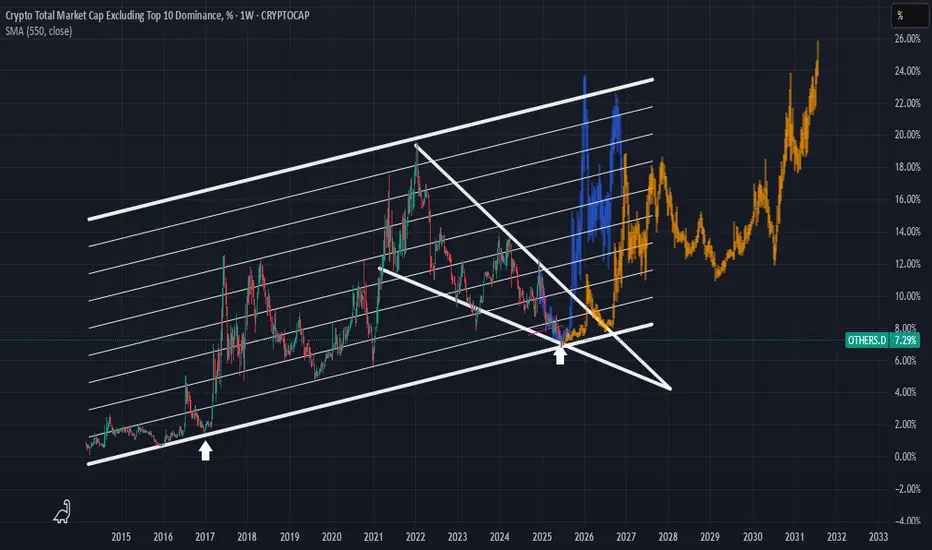
Very similar to January 2016You are looking at the Crypto Total Market Cap Excluding the Top 10 cryptocurrencies (OTHERS.D) on a weekly timeframe. This chart is often used as an "Altcoin Index" to gauge the strength of the broader cryptocurrency market beyond the major players like Bitcoin and Ethereum.
Here's my observation about being in a period similar to January 2016.
The technical analysis on this chart is built around a few key concepts:
1. Long-Term Ascending Channel: The dominant feature is a large parallel ascending channel that has contained the altcoin market cap's movements since 2015. The upper line has acted as a resistance level during bull market peaks, and the lower line has served as a major support level during bear market bottoms.
2. Historical Fractal (The "January 2016" Idea): My idea centers on a historical comparison, or a "fractal."
- The first white arrow points to a period in late 2016. At this time, the altcoin market cap found a bottom right on the support line of the ascending channel. This bottoming phase preceded the explosive 2017 bull run.
- The second white arrow points to a projected time in late 2025 / early 2026. The chart suggests that the market is currently in a similar bottoming pattern near the same long-term support line.
3. Falling Wedge: I've drawn a large falling wedge pattern starting from the peak in late 2021. This is typically a bullish reversal pattern, suggesting that the long downtrend could be nearing its end. The price is currently interacting with the apex of this wedge, a critical decision point.
4. Price Projection: The orange and blue bar patterns are copies of the price action that followed the 2016-2017 bottom. By pasting this fractal to the current time, the chart visualizes a potential future where history rhymes, leading to a massive new bull market for altcoins extending into 2027 until the end of the roaring 20s.
The Bullish Case (According to the Chart)
The argument presented by this analysis is clear:
• The altcoin market is at a historically strong support level (the bottom of the ~10-year channel).
• This is the same support level that kicked off the massive 2017 bull market.
• The market is consolidating within a falling wedge, which has a higher probability of breaking to the upside.
If this analysis holds true, the current period could be seen as a significant accumulation zone before the next major market expansion, much like the period around January 2016 was.
Important Considerations and Risks
While this is a compelling technical setup, it's crucial to maintain a balanced perspective. Here are some factors to consider:
• Past Performance is Not a Guarantee: This is the most important principle in financial markets. While historical patterns can provide valuable insight, they do not guarantee future results.
• Market Dynamics Have Changed: The cryptocurrency market of 2025 is fundamentally different from that of 2016.
• Maturity and Size: The market is significantly larger and includes substantial institutional investment, which can alter market behavior and volatility.
• Macroeconomic Factors: Global economic conditions, such as interest rates and inflation, now have a much stronger influence on the crypto market than they did in its earlier days.
• Regulatory Environment: Increased global regulatory scrutiny can introduce uncertainty and risks that were not present in the 2016-2017 cycle.
• Subjectivity of Technical Analysis: The trendlines and patterns are drawn based on an analyst's interpretation. Another analyst might draw them slightly differently, leading to a different conclusion.
Conclusion
The idea that "we're in January 2016 all over again" is a valid interpretation based on the technical patterns in this chart. The analysis points to the altcoin market being at a critical long-term support level, similar to the setup that preceded a major historical bull run.
This chart lays out a clear bullish roadmap. However, everyone should treat it as a potential scenario, not a certainty. I'll continue to monitor if the price respects these historical levels so that you guys are mindful of the broader market and macroeconomic factors that could influence the outcome.
Disclaimer: This analysis is for informational purposes only and is based on the technical analysis presented in the user-provided image. It should not be construed as financial advice. All investment decisions carry risk, and you should conduct your own research.
#OTHERS.D ~ Do you believe in Castles in the SKY?I believe that the Others dominance metric divided by an ounce of real money #Gold gives us a valuable insight into the fabled altseasons.
Because as this chart shows theres only been 4 in actuality
and you normal get a double bubble in a cycle.
So I believe we are at the cusp of turning things around as most people have given up on the concept of altcoins ever pumping again.
But it was just the business cycle #PMI that has depressed prices for the past few years.

Stablecoin Dominance vs Altcoins – Final Altseason Loading?This chart visualises a powerful relationship — stablecoin dominance (USDT.D + USDC.D) versus OTHERS dominance (i.e. altcoins excluding BTC and ETH).
Put simply:
When this chart moves down, stablecoins are flowing into altcoins — risk-on behavior, altseason ignites.
When it moves up, capital rotates back into stables — risk-off behavior, weakness across alts.
This has nailed every major altseason impulse and correction cycle over the past few years.
Right now, we’re seeing this pair push higher into a key supply zone — the same distribution range it previously broke down from. My expectation is a retest of that breakdown zone, which should align with a short-term correction in the altcoin market.
📉 Once this retest plays out and we see signs of weakness at supply, I anticipate continuation bearish in this pair — leading to stablecoins flowing back into altcoins.
That next leg down into higher time frame demand could mark the final altseason push, before the broader market tops out. If we follow the usual cycle pattern, that last alt impulse will likely drag retail back in for the top — just before distribution takes over and the bear phase begins.
🧠 In short:
Push into supply → altcoin correction
Breakdown → capital rotation back into alts
Final altseason + market top → bottoming of this chart + reversal bullish
This will be a key chart I’ll track closely over the next few months — it offers one of the cleanest reads on altcoin liquidity flow and timing for top formation.
1W:

USDT.D/OTHERS.D - Altcoin Season IndicatorPrice rejected from the 3M HTF supply and major BSL on the prior highs. Price has now gave a confirmed 1W bearish market shift, indicating a market wide altcoin reversal is playing out and the next bullish impulse higher isnt far off....
Watching for rejections in this weekly supply on this pair as marked and looking for a bearish daily market shift to give confirmations of a potential reversal bearish in line with the recent weekly bearish market shift that occurred from the BSL sweep into 3M supply and refined supply within it.
As shown, this chart is an altcoin indicator and im expecting that last altcoin season and cycle to occur after this chart tops out into supply and then continues lower into the SSL low at 0.29% and into the 3 month demand below it.
Seeing similar indications from the other charts shared like BTC.D and BTC.D+ETH.D+USDT.D+USDC.D, where they show continued weakness in alts for now with a HYTF bullish reversal in altcoins not far off.
3D:
1W:

Altcoin Cycle - Cycle bottoms spottedAs I demonstrated on this picture. I believe I identified the cycle bottoms and marking a new cycle low. With the BITSTAMP:BTCUSD price rising now and CRYPTOCAP:BTC.D about to meet hard resistance levels, I believe this will increase the propability of a start of the altcoin cycle. Also known as the Altcoin season.
CRYPTOCAP:OTHERS
CRYPTOCAP:OTHERS.D
COINBASE:ETHUSD
BINANCE:SOLUSD
INDEX:BTCUSD
BINANCE:BTCUSD

OTHERS ROADMAPTo me the view is pretty clear.
* The purpose of my graphic drawings is purely educational.
* What i write here is not an investment advice. Please do your own research before investing in any asset.
* Never take my personal opinions as investment advice, you may lose your money.
Actions Nightmare Is About To Be FinishedHello, Skyrexians!
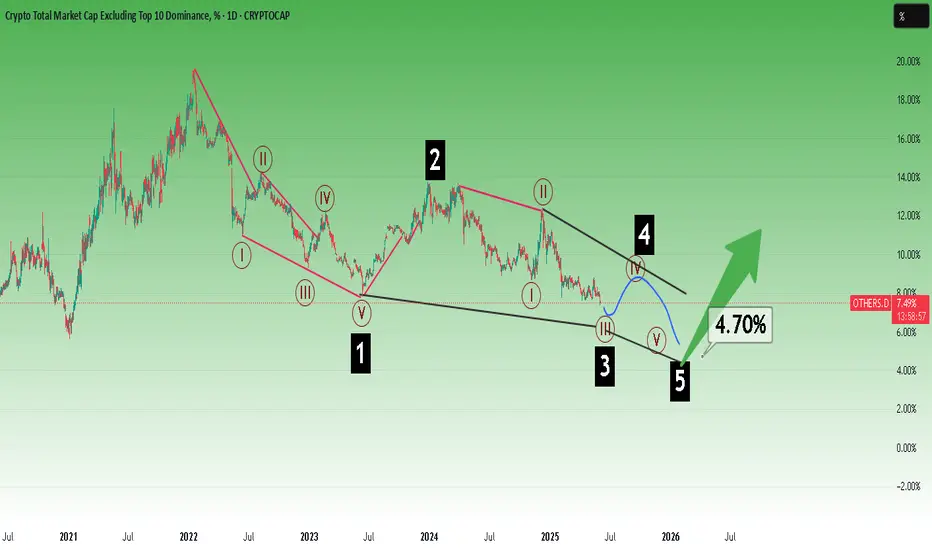
Recently I shared this article about CRYPTOCAP:OTHERS.D where I pointed out that this chart is about to print another one lower low. Now it's happening, but this is wave 5 and now it's time to look for the altcoins bear market bottom.
Here we have 4h time frame and the internal structure of the final wave 5. Our main reversal signal can be divergence on Awesome Oscillator, and now it can happen if this drop will be decelerated. Price is inside the large green box - reversal zone. If we will see 3 rising columns on the histogram it's going to be the reveal signal with the yellow Elliott waves structure. This structure can be changed if price continues going down now without pullbacks. In this case I will recalculate waves and may be it will reach 7%. Also it shall match with BTC dominance which also has some space to go up. It shall at least retest the high at 65.5% (potential shortened wave 5).
Best regards,
Ivan Skyrexio
___________________________________________________________
Please, boost this article and subscribe our page if you like analysis!

Altcoins Are Ready For Big DropHello, Skyrexians!
It's very important when BTC, USDT and CRYPTOCAP:OTHERS.D dominances analysis perfectly matches with each other. I bet for Bitcoin and Tether dominance growth in the upcoming weeks and dump for altcoins.
Let's take a look at the 2 days time frame. Price was not even able to reach 0.38 Fibonacci level, but reached wave 4 top inside wave 3. In conjunction with zero line cross on Awesome Oscillator it's enough to say that we are in the wave 5 now. This dump will continue at least 7.5% low retest with the maximum target at 6.7%.
Very important, I see significant sentiment shift from bullish to bearish. When such article like this will collect more support than hate altseason will be ver close!
My previous analysis which played out well:
Best regards,
Ivan Skyrexio
___________________________________________________________
Please, boost this article and subscribe our page if you like analysis!

4 X Crypto Dominance charts showing Where the money goingCRYPTO MARKET DOMINANCE CHARTS
These are 4 hour charts, showing PA from Mid April to now.
BTC.D - ETH.D
OTHERS.D - USDT.D
RED line = 50 SMA
BTC.D - Dips, Showing money flow into other Assets. PA has fallen below the 50 SMA and yet the price has remained static above 100K. The fact that the Dominance chart is dropping is more a sign of the increase in Selling, Profit taking and the increase in Dominance of other Assets and the fact that the price is unchanged, slightly higher, also shows the demand for BTC remains strong.
ETH.D - Climb showing some ETH recovery though no where near the climb that Bitcoin has made. The ETH Dominace can also be reflecting the increased Dominance of ALTS on the ETH network. In the last 24 hours, The ETH dominance has Fallen slightly
OTHERS.D - Rapid climb - Top 125 coins minus the Top 10 ny market dominance.
MID to LOW Cap ALTS taking most of the Money. This will include all ALTS on any Vlockchain, including the TH network. Some Massive gains here signaling ALT Season though I am uncertain how long this will ast.
BE CAUTIOUS
USDT.D Drops showing money leaving Stable coins and moving to Assets. When stable coins get sold off, it is a sign of confidence in the market, Foe me, MOST of the money flowing into ALTS right now are coming from the Stable coin sell off
As I mentioned just now, I remain cautious about this right now,
Watch that BTC.D like a Hawk because THAT is the signal of change in this.
The Table below explains ( sorry for the formatting )
BTC.D- BTC - ALTS
increase- increase- Decrease
increase- Decrease- Decrease Rapid
increase- Stable- Stable
Decrease- Increase- Increase Rapid
Decrease -Decrease- Decrease / Stable
Decrease -Stable- Increase

A disappointing #Altcoin season? Maybe! OTHERS.d/BTC.dMaking gains in #Crypto has gotten harder and harder with each passing cycle for the vast majority of participants.
That is an unquestionable truth that I see and hear from people.
#Bitcoin itself is in it's 4th Hype cycle... which is bearish
2013 Mt Gox ponzi cycle top/collapse
2017 Eth/ICO craze, CME futures. CNBC XRP shill top.
2021 Uniswap/DEFI innovation , Elon doge /Coinbase IPO top.
2024/5 Memecoins craze --- topping signals are already appearing Andrew Tate / Iggy Azalea at NYSE. A Trump Election Win could be the final nail in the coffin whilst ppl celebrate the news and January 2025 Inauguration may seal crypto's fate.
The left translated 4 year cycle is a definite possibility as made popular by #BobLoukas
We know that retail investors are rejecting High valued VC backed projects and rather take high risk gambles on #Memecoins for a chance to be early... this is not bullish behaviour obviously!
As only a tiny percentage of people can win at that game and often it is not YOU!
Once that speculative capital & energy is rinsed many people will be left holding a worthless bag of tokens.
#Leverage trading destroys many people's lives
And a digital store of value whilst has obviously it's merits is unlikely to flip #Gold in marketcap imho
It cannot compete with a 5000 year history of storing wealth for generation to generation.
I can bury Gold coins in my garden and dig them up in 50 years knowing full well that they will have value.
Would you do that with a trezor? Lol.
So what do we do ... try to take advantage of the next 6 months and rotate S coin profits into
#Stablecoins and maybe a small allocation to #PAXG #XAUT (buyer beware on those gold backed #RWA coins obviously)
This should buy you enough time, to let you assess the fallout of any top that may occur this Christmas/new year.
Remember many people and especially the Bitcoin community will be partying and celebrating the 15 year journey of a $100k plus BTC.
You must avoid being sucked into that hype and cash in a good chunk of your crypto portfolio IMO
This is just a scenario I give to you ... and not a prediction ofc.
We are trying to predict the future irrational behaviour of humans, an almost impossible task. But as the wall St cheat sheet demonstrates speculative bubbles, generally do repeat often enough for us to try and capture profits from them.
So we watch and wait, place our bets and see where the chips may fall, one foot in and one foot out is my general kind of viewpoint of how most people should be thinking at this stage of the cycle.

The Altcoins Market Is Ready To Grow —Altcoins Season 2025The Altcoins market is ready to grow and here I have all the proof that you will ever need.
Good afternoon my fellow Cryptocurrency trader, how are you feeling today?
We know that the Cryptocurrency market is one; What one does, the rest follows.
We know that Bitcoin is the king of Crypto and when Bitcoin is bullish, the rest of the market also turns green. But Bitcoin being bullish isn't always all that is needed for marketwide bullish action. Bitcoin needs to be bullish but at a strong price, bullish confirmed. And that's exactly the situation we have today.
Today Bitcoin crossed easily and with a full green candle the $100,000 price barrier. Not only $100,000 but higher, $104,000 after trading as low as $96,800 today. With Bitcoin ultra-bullish, the Altcoins are set to follow and this chart—OTHERS.D—confirms not only the big Altcoins will follow but all Altcoins, the smaller ones as well.
Here is the best piece of news I can give you:
When Bitcoin grows 10%, the smaller Altcoins can grow between 50-100%.
When Bitcoin grows 30%, some of these Altcoins can grow up to 300%. Most of them can grow anywhere between 100 and 200%. This scenario is already present.
From Bitcoin's bottom around $74,500, it is already some odd 30% up. But, the smaller Altcoins do not start growing together with Bitcoin, only when Bitcoin becomes really strong. Bitcoin is really strong now so all the Altcoins grow.
When Bitcoin grows, say 50%, from $100,000 to $150,000, many of the OTHERS Altcoins will be growing between 300 and 500%.
When Bitcoin grows 80-100%, these Altcoins will be growing between 600% and 1,000%. So these pairs can be used to earn as profits in the same range as with a leveraged trade but without the liquidation risk.
So you can earn 5X, 6X or 10X on a small Altcoin, while Bitcoin produces its bullish wave.
Here the OTHERS.D index hit bottom yesterday and today is starting to grow. We have a full green candle and the action moving above support, the 7-April low.
The chart patterns, price dynamics and market conditions are pointing toward this index moving up. This moving up is the proof that the smaller Altcoins are set to grow strong. This means that these will grow faster than Bitcoin, Ethereum, Cardano, Solana, Dogecoin, XRP, BNB, Tron and all those in the TOP10. Don't get me wrong, everything will grow, but it is time for the Altcoins season.
Thanks a lot for your continued support.
Namaste.


The 4 Crypto Dominance charts and 4 x TOTAL charts -ALT ?
There are some charts we should always refer to in times where we feel change may be upon us.
The chart above are
Bitcoin Dominance ( BTC.D ) - Ethereum Dominance ( ETH.D )
Others Dominace ( OTHERS.D) and USDT Dominance ( USDT.D) ( I use USDT as it remains the largest Stablecoin by market cap)
The RED line in these Daily charts is the 50 day SMA
In most of my posts recently, I have been mentioning how Strong BITCOIN is remaining while under a Lot of resistance.
But we really should not forget the rest of the market. THE ALTS
The Fabled ALT Season has been running away from us, making many wonder just what is happening.
To explain, while BTC.D remains high, it shows us that the Money remain invested in Bitcoin.
When this Dominance Drops, in the past, it has signalled the rise of investment into ALTS.
Called ROTATION, the money rotates from one asset to another.
Due to the corporate investment in Bitcoin, this rotation has not happened.
BUT IS IT ABOUT TO ?
Let look at a few things
BTC.D has been rising continuously for Months now, It is way above that 50 day SMA. PA could fall a Long way before the support of that 50 SMA is required and I notice as I type, that is is beginning to drop. It's local support may help
ETH.D has begun to Rise but we need to pay attention to this as it could get rejected once again by the 50 SMA. Ethereum has had a very hard time this cycle and has yet to show any sustained recovery
OTHERS.D - Now OTHERS is the one I watch most. Others is the Top 125 Coins MINUS the Top 10 by market cap. This shows us the Mid to Low cap Alts coins.
This is also rising right now but once again, we need to wait and see if it breaks through the 50 SMA that has rejected it many times.
The USDT.D has been dropping. This shows that USDT has been rotated into other assets. Bullish but I have to say, that as I write this, I have just noticed that this has begun to rise also though only on a 1 hour chart so maybe just Noise but it is worth watching.
So, on these dominance charts, we see a potential start to a rotation but with the likely hood of rejection of the 50 SMA, It could be the First step of a bigger move.....But with potholes in front.
The Next Logical thing to do is to look at the TOTAL market Cap charts, to compare this dominance.
This chart shows us the Daily charts for
TOTAL Crypto market Cap - TOTAL2 ( minus BTC )
TOTAL3 ( Minus BTC & ETH ) - OTHERS ( Top 125 coins Minus top 10 by Dominace )
SMA;s in chart are RED= 50, BLUE = 100, GREEN = 128, YELLOW = 200
The TOTAL is the ONLY one that has PA above all the SMA's, potentially offering Support on many fronts. It has also had the most sustained Rise. Hence the high level of Dominance in the Market.
TOTAL2 is above the 50 SMA that has rejected it previously and is about to hit into the 100. We need to see if this will be rejected or not.
Remember how the ETH.D is also facing rejection off the 50SMA - ETH is under pressure
TOTAL3 is above the 50 and appears to have broken through the 100. This is VERY Bullish for the ALT coins and could show us some potential for a continued rise as sentiment continues to turn positive. But we should watch that 200 as a potential problem
OTHERS has the largest and strongest rise and again, is above the 50 and appears to have broken through the 100. This chart has the largest gap between current PA level and the next SMA that may reject it. This is the same on the Others.D chart
SO, in conclusion, The potential for a Rotation does exist but it is going to be hard fought. There is the possibility of a HIGH volitle state for the next few days, possibly Weeks.
If you are going to rotate out of Bitcoin, Be VERY CAUTIOUS until at least the next SMA have been claimed on both sets of charts.
The nest bets are on the Mid to lower Cap ALT coins.
BUT I will say this. I cannot See BITCOIN Selling off to invest in ALTS. I also see Bitcoin continuing higher against the USD.
IF we get an ALT season now, It will be Quick, Volatile and possibly with Quick Pump and Dumps on most ALTS.
The larger ALTS will survive this better than the Meme, small caps in my opinion
For me, the ROTATION that creates an ALT Season will occur with the rotation of money from ALT to ALT and NOT BTC to ALT
What ever you do, Remain in Peace and Safety

SHITCOIN index to 11X - No crying in the CASINO!I see grown men on my timeline expressing despair, claiming that altcoins are finished!
Come on, get a grip!
Volatility is simply the cost of chasing the highest potential returns in the most speculative market the world has ever seen.
Yet, many are unwilling to wait just one more year.
They’re turning into Bitcoin maximalists, hesitant to promote their favourite coins and reluctant to introduce friends and family to their preferred ecosystems.
This is just ridiculous.
Take a look at that chart.
I mean really study it.
It shows a stunning continuation pattern of an inverse head and shoulder.
Is that bearish or bullish?
You decide.
Embrace the cost of those future returns.
The Others index going to Trillions of dollars.
Means many millionaires will be freshly minted.
From memes to mansions.

Did Small Cap Altcoins Bottomed In?Hello, Skyrexians!
It's not a secret that we are waiting for Bitcoin dominance drop to at least 62% right now, but after that we expect the final shakeout to 67%, but the CRYPTOCAP:OTHERS.D gave us a hint that may be this shakeout will not affect on low cap alts that much like on top-10.
Let's take a look at the 12h time frame to see the waves in details. After a large wave 3 we have seen the triangle correction in wave 4, after that price showed the impulsive structure in wave 5. Subwaves 3 and 5 formed divergence with the Awesome Oscillator. Yesterday's dump looks like the deep wave 2 inside new impulse to the upside. Green dot was formed on the Bullish/Bearish Reversal Bar Indicator which confirms the further growth scenario.
Best regards,
Ivan Skyrexio
___________________________________________________________
Please, boost this article and subscribe our page if you like analysis!

others dominance altcoins Others Dominance #Altcoins 🌊
✅Rally 1
✅Rally 2
⏳ RALLY 3!
ALTS generally started its run with a double bottom before the previous rally phases and is currently confirmed with a double bottom

Altcoins Will Explode In May!Hello, Skyrexians!
We have already made a lot of analytics about the Bitcoin Dominance, today it's time to update CRYPTOCAP:OTHERS.D analysis because it looks like the bottom could be in!
Let's take a look at the daily time frame. We have already pointed out that globally altcoins are about to finish the bear market and the 5 Elliott waves impulse which you can see on the chart is this last wave. Recently we have shown you the bullish divergence with the Awesome Oscillator, today we can see the confirmation of the divergence on the Acceleration/Deceleration indicator, which measures the waves inside wave 5 with no need to go on lower time frame. This divergence in conjunction with the green dot on the Bullish/Bearish Reversal Bar Indicator gives us strong confirmation of the reversal. The minimal target is 10-10.5% then we will see is it going to be true altseason or not.
Best regards,
Skyrexio Team
___________________________________________________________
Please, boost this article and subscribe our page if you like analysis!

The 4 Crypto Market Cap charts and SMA's comparedTop Left TOTAL CRYPTO MARKET CAP
Top Right TOTAL 2 CRYPTO MARKET CAP ( Minus Bitcoin )
Bottom Left TOTAL 3 CRYPTO MARKET CAP ( Minus BTC and ETH )
Bottom Right OTHERS CRYPTO MARKET CAP ( Top 125 coins Minus Top 10 by dominance )
50 SMA RED
100 SMA BLUE
128 SMA GREEN
TOTAL Cap is the ONLY one that has broken above the 2021 ATH and has subsequently dropped back under but is still "touching the line" with a Wick up from the current candle.
It can also be seen how it is only the TOTAL chart that has remained easily above the 50 SMA since late 2023. The toer charts can be seen to have needed to bounce of it in 2024
The TOTAL 2 & 3 charts have very similar Candle moves and 50 SMA use.
To me, this is telling us about the Higher Cap ALT coins.
The fact that both TOTAL 2 ( Minus BTC ) and TOTAL 3 ( Minus BTC and ETH ) are similar shows me the little impact of ETH on price rise. These Charts are held up by the Higher ALT coins like SOL, INJ, SUI, XCN, HBAR to name a few. Most of these are still less than 100% gains over the last 12 months.
But what the slight Difference there is between the two charts does show us that ETH is a burden. It is dragging the TOTAL 2 chart down lwoer than the TOTAL 3 and that difference, though small on a monthly chart, is VERY SIGNIFICANT
OTHERS tells a huge story of how the Mid to Lower Caps are paying the price of Bitcoins adoption by Corporations and the fact that, as a result of these Corporations HOLDING, Bitcoin Dominance remaining High. The money that has once been used to Feed the ALT Market is static.
OTHERS is also the only chart that has fallen below its own 50SMA
That is not Bullish and very clearly shows how the Crypto Market has now matured and the absolute Tidal wave of New, worthless, useless ALT coins are failing.
This does not mean that will continue but I am inclined to believe that while we have such uncertainty in the world, the utter risk of investing in something with no use or history and security does not appeal to many.
To many extents, this could be seen as the beginning of the " Dot Com" Bubble burst for Crypto, where the best Coins / Projects are adopted and the rest, well, fall aside......
We shall see

OTHERS Market Cap Monthly Candle close colours tells a Story
OTHERS - Top 125 coins MINUS top 10 by Market dominance.
OR The MID to LOW caps ALT coins.
The closeness of these Candles close colours tells a Story to me
There are only two months since 2017, where the count is not 6 to 5
Febusary has the biggest difference with a majority GREEN at 8 - 3
But that had little effect this cycle with the last 5 Months ( including this april) being RED
There is only ONE occasion that has happened before, and then went on to be 9 consecutive RED months and that was after the height of the ALT Season in 2017
The only positive I can offer here is that, After the RED March, April was Green on 3 occasions.
What we can take away from this is that the MID to LOW cap ALTS are NOT seasonal, it is a Hit an dMiss chance of taking the right coin at the right time and trading
You will also notice how the Actual Market Cap is currently LOWER than the height of the 2021
Infact, this is true for ALL the Market Caps EXCEPT TOTAL
This Very Clearly shows us all that it is BITCOIN that holds the market up and it is that Dominance that has Hurt ther ALTS so much.
Will this change ?

Growth On Altcoins Is Beginning Right Now!Hello, Skyrexians!
Last week our main purpose was to catch the potential bottom for CRYPTOCAP:OTHERS.D and top for Bitcoin dominance. While the BTC.D has not still flashed the reversal signal, but altcoins did. So, we have a chance that reversal is coming, but don't be so optimistic on that, we need to see some extra confirmations anyway.
Let's take a look at the daily chart. Here we can see the 5 Elliott waves structure. Previous Elliott waves we have already looked in details in our recent analysis, today we need only wave 5. We pointed out 7-7.6% as a final target. The most likely reversal target was 7.4%, but now we are seeing good reaction from the minimal target. Yes, we have green dot signal on the Bullish/Bearish Reversal Bar Indictor . This is very strong, but let's wait at least the momentum change on the Awesome Oscillator and the opposite signal on the Bitcoin dominance.
Best regards,
Skyrexio Team
___________________________________________________________
Please, boost this article and subscribe our page if you like analysis!

FIFA WORLD CUP HISTORIC ROARING 20s QE Restart ScenarioBenjamin Cowen has been truly amazing with his analysis. As per monetary policy it's definitely too early to call the start of QE but we're on the right track.
it almost feels like the true Altseason will start when the FIFA World Cup starts. Every single scenario matches that theory. If you also pay attention to Algorand for instance, it's mimicking the early days of XRP. XRP is also mimicking the early years of Apple.
Can you imagine a scenario where XRP hits 120 dollars and Algorand 1200 dollars? I know I know the market caps etc. But so far it does feel like the markets are brewing for a truly historic roaring 20s scenario that could last for years.
Big question is, who has the first mover's advantage now and needs to catch up in the mean time?
I'm looking at tiny caps like Metastrike, and institutional coins like VeChain. China has already started QE so you may want to play around with VET while the entire market is boring.
JasmyCoin I can't tell yet, it could be but it has that annoying monitoring tag and in my case I've already survived 7 delistings already (dock, ooki, troy, gifto, gemie, kingdomverse, dreamsquest), so not touching it for now.
Looks very promising to be honest. Gotta have a long term vision here.

Altcoins are set to bleedUnless this small support holds it'll be confirmed that price has broken down the triangle. If this is the case expect most #Altcoins to bleed a lot. If this index drops 1% alts should be expected to double that drop. Look at it to identify bottoms. Unfortunately Trump's economy poltics are messing up the market and the economies. However we should still be on track for altseason explosive phase.... FOR NOW!
