XAUUSD H4 Outlook – August 4, 2025Structure is bullish — but supply is layered. Precision now matters more than bias.
—
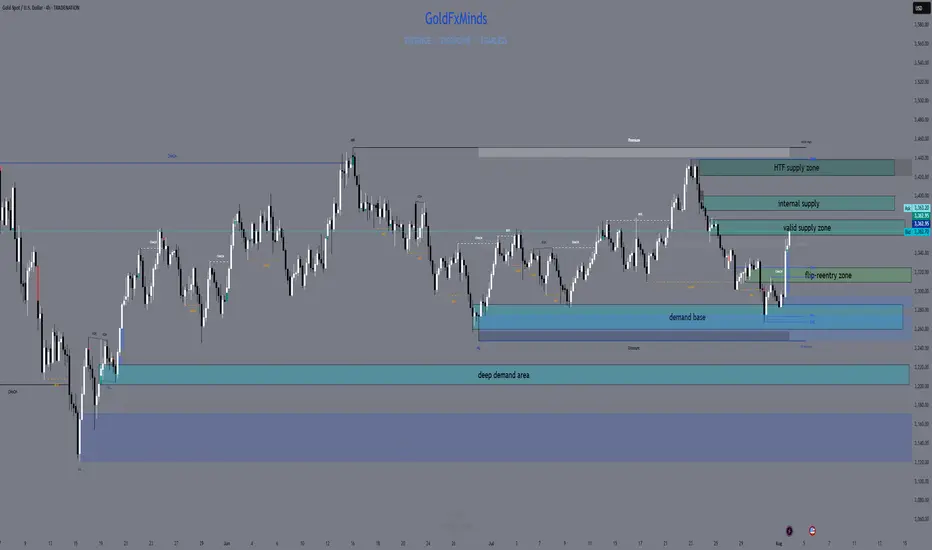
Gold is trading at 3362, sitting right inside the heart of a key structural zone. After a strong breakout from 3285–3260, price reclaimed imbalance, broke internal structure, and powered higher into premium. The trend is bullish — but we’ve just stepped into stacked supply.
Let’s break down every zone that matters now, from top to bottom:
🟥 3360–3375 – Valid H4 Supply Zone
This is the first active supply block — the origin of the last bearish leg. It holds a clean OB + imbalance and is currently being tested for mitigation.
We're inside it right now. This zone is critical:
→ If price breaks and holds above it, continuation is likely
→ If we reject here, it confirms sellers are defending their level
🟥 3385–3398 – Internal Supply Trap
A secondary supply zone built from previous order flow.
If bulls push through 3375 without rejection, this is the next area to watch for weakness.
This zone often creates fake breakouts, especially when momentum slows. RSI is already showing signs of exhaustion approaching this level.
🟥 3420–3440 – HTF Supply Trap
This is the top — the last unmitigated supply on the weekly.
It's not in play yet, but if bulls break above 3398 decisively, this is where the bigger trap could form.
Any long into this zone must be backed by strong structure and continuation candles — otherwise, it’s a liquidation magnet.
🟫 3322–3310 – Flip Reentry Zone
If we reject from current supply, this is the first high-probability reentry for bulls.
It’s where the last CHoCH confirmed, and it aligns with EMA confluence and minor imbalance.
Buy setups from here must be confirmed on M15/M30 — no blind longs.
🟦 3285–3260 – Breaker Demand Base
The true origin of the bullish move.
This zone caused the structural flip — clean OB, FVG stack, and liquidity sweep.
If price returns here, it becomes a must-hold for bullish continuation. One of the best sniper zones for longs.
🟦 3222–3205 – Final Demand Layer
Deep structure zone holding imbalance + previous HL base.
Only comes into play if 3260 fails. A break below this would shift bias to neutral or bearish on H4.
🎯 Bias Summary
✔️ H4 bias = bullish
✔️ Price is inside 3360–3375 supply
✔️ EMA 5/21/50 aligned, but RSI is elevated
⚠️ This is not a breakout — it’s a test zone
🔁 Execution Plan
📍 Rejection from 3360–3375 → sell scalp toward 3322
📍 Clean break of 3375 → watch for next short at 3385–3398
📍 Failure of 3398 → HTF draw toward 3430–3439
📍 Pullback toward 3322–3310 → potential long zone
📍 Clean drop to 3285 → high-RR buy area
📍 Break below 3260 → only valid demand left is 3222
—
This is not the time to chase. It’s the time to stalk.
You’re in premium. Supply is active. Let structure decide — you just execute with clarity.
—
Which zone are you watching for your next move?
Comment your bias below 👇🏼 Smash the ❤️ if this brought clarity, and follow GoldFxMinds to trade with precision every day.
Disclosure: Chart based on Trade Nation feed (TradingView).
Outlook
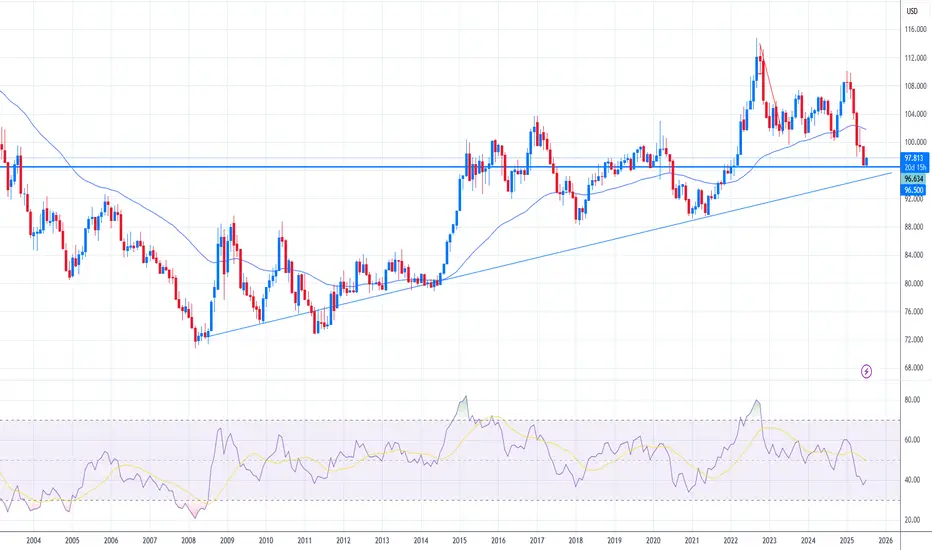
DXY Tests Key Support – What’s Next for the Dollar?
The U.S. Dollar Index (DXY), which tracks the dollar’s performance against a basket of major currencies, recently broke below its 50-month moving average based on the monthly chart —a significant technical signal. After this drop, the index is now bouncing off a key support zone near 96.50.
This area has acted as a pivot point in past cycles, and a sustained bounce could indicate the dollar regaining strength. If risk sentiment fades—due to weaker equity markets, geopolitical tensions, or stronger U.S. data—the dollar might find new momentum.
On the flip side, failure to hold 96.50 could open the door toward the 90.00 zone, a major long-term support level. Such a move would likely reflect expectations of looser U.S. monetary policy or further deterioration in economic confidence.
For now, price action near 96.50 will be decisive. A rebound could shift sentiment back in favor of the dollar, while a deeper decline may trigger broader adjustments in FX markets. Traders should closely monitor upcoming macro data and risk sentiment for cues on the next leg.
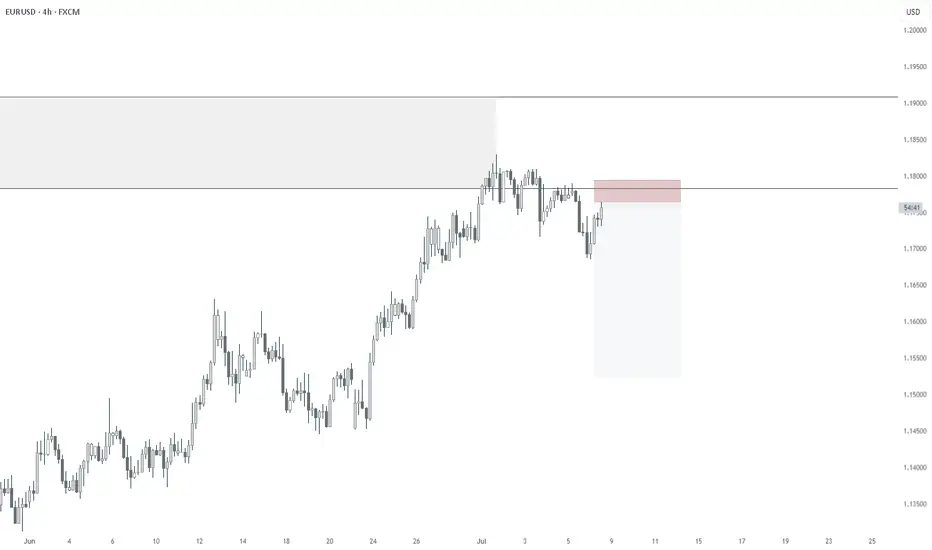
07/08/2025 - EURUSD - HEDGE SHORTHedge Short for FX:GBPUSD
COT Retailer still extended
We are on the higher timeframe weekly zone
Substructure is already confirmed bearish
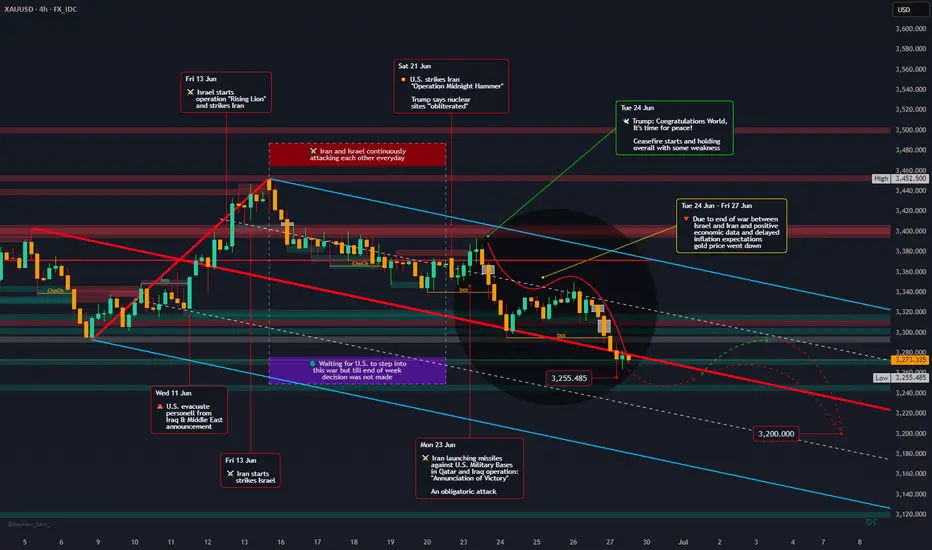
Down the road - Gold Outlook June 30 - July 24, 2025FX_IDC:XAUUSD
📰 The past weeks has been a wild ride for gold prices, caught between the fiery conflict in the Middle East and a deluge of crucial economic data from the U.S. 📈 Adding to this, a detailed technical analysis provides a deeper look into gold's immediate future.
**Geopolitical Drama Unfolds & Peace Prevails!** 🕊️ ceasefire negotiations.
Initially, gold was shrouded in uncertainty 🌫️ due to the Iran-Israel war, with markets bracing for potential U.S. involvement and a full-blown escalation. Daily tit-for-tat attacks between Iran and Israel kept everyone on edge, and the question of U.S. intervention remained a nail-biter 😬, though President Trump did announce a 14-day "timeout".
Then came the dramatic twist on June 21st: "Operation Midnighthammer" saw the U.S. unleash bunker-buster bombs on Iranian uranium enrichment facilities. 💥 Short time later, the U.S. declared mission accomplished, stating their goal of destroying these sites was achieved, and no further attacks would follow.
Iran's response, "Operation Annunciation of Victory," on the following Monday, involved missile strikes on U.S. military bases in Qatar and Iraq. 🚀 Interestingly, these attacks were pre-announced, allowing for safe evacuations and thankfully, no casualties. 🙏
The biggest surprise came from President Trump as he declared, "Congratulations world, it's time for peace!" 🎉 He then brokered a ceasefire between Israel and Iran, which, despite being fragile, largely held, leading to the war's end.🤝 Both nations, as expected, officially claimed victory – a common move to satisfy their citizens. 🏅
Personally, I was genuinely surprised that the U.S.President mediated ceasefire, actually brought the conflict to a close – but it's a welcome outcome! 🙏
**Economic Data & Fed's Steady Hand** 💹🏛️
The cessation of hostilities triggered a steady downward slide in gold prices from June 24th to 27th. ⬇️ This dip initially met some market resistance but it ultimately prevailed, especially with the release of mixed U.S. economic data, which, despite being varied, was generally interpreted positively by the market.
The spotlight also shone on the Federal Reserve, with several representatives speaking and Fed Chair Jerome Powell undergoing a two-day Senate hearing. 🎤👨⚖️ Powell meticulously explained the Fed's rationale for holding interest rates steady, despite market pressures. 🤷 However, recent whispers suggest the Federal Reserve might actually cut rates in September! 😮
## Geopolitical News Landscape 🌍📰
India / Pakistan
Pakistan rejected claims that it supported militant groups active in Indian Kashmir. India issued a formal protest but reported no fresh border clashes during the week.
Outlook 🔮: De-escalation is possible in the short term. However, unresolved disputes over water rights (Indus Treaty) could reignite tensions.
Gaza Conflict
Heavy Israeli airstrikes killed dozens in Gaza, including civilians near aid centers. The UN warned that U.S.-backed aid systems are failing. Humanitarian corridors remain blocked.
Outlook 🔮: Ceasefire talks may resume in July, but success depends on international pressure and safe humanitarian access.
Russia / Ukraine
Russia advanced 36 sq mi in eastern Ukraine, deploying outdated T-62 tanks. Ukraine reinforced defensive lines, aided by Western military packages.
Outlook 🔮: The front remains volatile. Sustained Western support will be key to halting further Russian gains.
U.S. – China Trade War
A breakthrough deal was signed for China to fast-track rare-earth exports to the U.S. Talks on tech transfer and tariffs continue behind closed doors.
Outlook 🔮: A phased de-escalation is possible, but deep trust issues linger, especially over semiconductors and AI.
🌐 Global Trade War
Several countries, including Brazil and Thailand, imposed fresh restrictions on Chinese imports, echoing the U.S. stance. Global supply chains remain fragmented.
Outlook 🔮: Trade blocs like the EU and Mercosur may take on greater importance as countries hedge against rising protectionism.
Trump vs. Powell
Fed Chair Powell resisted political pressure, stating rate cuts are unlikely before September. Trump called him “stubborn” and demanded immediate easing.
Outlook 🔮: The Fed’s independence is under strain. If Trump wins re-election, major policy shifts could follow.
📈 U.S. Inflation
Despite tariffs, core inflation remains elevated. Powell warned of persistent price pressures. Trump insists the Fed should cut rates to boost growth.
Outlook 🔮: A rate cut later in 2025 is possible—if labor market data weakens. Until then, inflation will remain politically explosive.
## Technical View 📐📈
**Current Market Context:** Gold plummeted to $3,273.67 USD/t.oz on June 27, 2025, marking a 1.65% drop from the previous day, which confirms the strong bearish momentum. The price action shows a significant retreat from recent highs around $3,400.
**ICT (Inner Circle Trader) Methodology Analysis:**
* **Market Structure:**
The trend is clearly bearish, with a definitive break of structure (BOS) to the downside.
* **Order Blocks:**
Several bearish order blocks have been identified at prior resistance levels, specifically in the $3,380-$3,400 range.
* **Fair Value Gaps (FVG):**
The aggressive sell-off has created multiple imbalances, particularly in the $3,350-$3,320 range.
* **Liquidity Pools:**
Buy-side liquidity above $3,400 has been swept. Sell-side liquidity is now accumulating below the $3,270 lows, which is the current target zone.
* **Session Analysis:**
The London session showed aggressive selling, followed by a continuation of bearish momentum in the New York session. The Asia session could see consolidation or further declines.
* **Smart Money Concepts:**
Heavy selling pressure suggests "smart money" distribution. There's been strong bearish displacement from $3,380 down to $3,270, indicating the market is currently in a "sell program" phase.
**Gann Analysis:**
* **Gann Angles & Time Cycles:**
The primary 1x1 Gann angle has been broken, pointing to continued weakness. Key price squares indicate resistance at $3,375 (25²) and support at $3,249 (57²). Daily cycles suggest a potential turning point around June 30-July 1, while weekly cycles indicate continued pressure through early July.
* **Gann Levels:**
* Resistance: $3,375, $3,400, $3,481 (59²)
* Support: $3,249, $3,136, $3,025
**Fibonacci Analysis:**
* **Key Retracement Levels (from recent swing high to low):**
* 78.6%: $3,378 (Strong resistance)
* 61.8%: $3,348 (Key resistance zone)
* 50.0%: $3,325 (Psychological level)
* 38.2%: $3,302 (Minor resistance)
* 23.6%: $3,285 (Current area of interest)
* **Fibonacci Extensions (Downside Targets):**
* 127.2%: $3,245
* 161.8%: $3,195
* 261.8%: $3,095
* **Time-Based Fibonacci:**
The next significant time cluster is July 2-3, 2025, with a major cycle completion expected around July 15-17, 2025.
**Institutional Levels & Volume Analysis:**
* **Key Institutional Levels:**
* Major Resistance: $3,400 (psychological + institutional)
* Secondary Resistance: $3,350-$3,375 (order block cluster)
* Primary Support: $3,250-$3,270 (institutional accumulation zone)
* Major Support: $3,200 (monthly pivot area)
* **Volume Profile Analysis:**
* High Volume Node (HVN): $3,320-$3,340 (fair value area)
* Low Volume Node (LVN): $3,280-$3,300 (potential acceleration zone)
* Point of Control (POC): Currently around $3,330
**Central Bank & Hedge Fund Levels:**
Based on recent COT data and institutional positioning, heavy resistance is seen at $3,400-$3,430, where institutions likely distributed. An accumulation zone for "smart money" re-entry is anticipated at $3,200-$3,250.
**Cycle Timing Analysis:**
* **Short-Term Cycles (Intraday):**
Bearish momentum is expected to continue for another 12-18 hours. A daily cycle low is likely between June 29-30, with a potential reversal zone on July 1-2 for the 3-day cycle.
* **Medium-Term Cycles:**
The current weekly cycle is in week 3 of a 4-week decline. The monthly cycle indicates a mid-cycle correction within a larger uptrend. For the quarterly cycle, Q3 2025 could see a major low formation.
* **Seasonal Patterns:**
July-August is typically a weaker period for gold ("Summer Doldrums"). September has historically been strong for precious metals ("September Effect"), setting up for a potential major move higher in Q4 2025 ("Year-End Rally").
**Trading Strategy & Levels:**
* **Bearish Scenario (Primary):**
* Entry: Sell rallies into the $3,320-$3,350 resistance zone.
* Targets: $3,250, $3,200, $3,150.
* Stop Loss: Above $3,380.
* **Bullish Scenario (Secondary):**
* Entry: Buy support at $3,250-$3,270 with confirmation.
* Targets: $3,320, $3,375, $3,400.
* Stop Loss: Below $3,230.
**Key Events to Watch:**
* **US PCE Data:**
Fresh downside risks could emerge ahead of the US Personal Consumption Expenditures (PCE) Price Index data release.
* **Fed Communications:**
Any hawkish rhetoric from the Federal Reserve could further pressure gold.
* **Geopolitical Developments:**
Ongoing global events could trigger safe-haven demand.
**Conclusion:**
The technical picture for gold suggests continued short-term weakness, with the metal testing its 2025 trend line at $3,290 following last week's rejection at the $3,430 resistance. However, the longer-term outlook remains constructive, given gold's robust performance year-to-date. Key support at $3,250-$3,270 will be crucial in determining the next significant price movement.
**Upcoming Week's Economic Calendar (June 29 - July 4, 2025):** 🗓️🌍
🗓️ Get ready for these important economic events (EDT)
* ** Sunday , June 29, 2025**
* 21:30 CNY: Manufacturing PMI (Jun) - Forecast: 49.6, Previous: 49.5
* ** Monday , June 30, 2025**
* 09:45 USD: Chicago PMI (Jun) - Forecast: 42.7, Previous: 40.5
* ** Tuesday , July 1, 2025**
* 05:00 EUR: CPI (YoY) (Jun) - Forecast: 2.0%, Previous: 1.9%
* 09:30 USD: Fed Chair Powell Speaks
* 09:45 USD: S&P Global Manufacturing PMI (Jun) - Forecast: 52.0, Previous: 52.0
* 10:00 USD: ISM Manufacturing PMI (Jun) - Forecast: 48.8, Previous: 48.5
* 10:00 USD: ISM Manufacturing Prices (Jun) - Forecast: 70.2, Previous: 69.4
* 10:00 USD: JOLTS Job Openings (May) - Forecast: 7.450M, Previous: 7.391M
* ** Wednesday , July 2, 2025**
* 08:15 USD: ADP Nonfarm Employment Change (Jun) - Forecast: 80K, Previous: 37K
* 10:30 USD: Crude Oil Inventories - Forecast: -5.836M
* ** Thursday , July 3, 2025**
* Holiday: United States - Independence Day (Early close at 13:00) 🇺🇸⏰
* 08:30 USD: Average Hourly Earnings (MoM) (Jun) - Forecast: 0.3%, Previous: 0.4%
* 08:30 USD: Initial Jobless Claims - Forecast: 239K, Previous: 236K
* 08:30 USD: Nonfarm Payrolls (Jun) - Forecast: 129K, Previous: 139K
* 08:30 USD: Unemployment Rate (Jun) - Forecast: 4.2%, Previous: 4.2%
* 09:45 USD: S&P Global Services PMI (Jun) - Forecast: 53.1, Previous: 53.1
* 10:00 USD: ISM Non-Manufacturing PMI (Jun) - Forecast: 50.3, Previous: 49.9
* 10:00 USD: ISM Non-Manufacturing Prices (Jun) - Forecast: 68.7
* ** Friday , July 4, 2025**
* All Day: Holiday - United States - Independence Day 🎆
**Gold Price Forecast for the Coming Week** 🔮💰
Given last week's market movements, there's a strong likelihood that the downward trend in gold prices will continue.🔽 However, fresh news can always flip the script! 🔄 As of now, I expect gold to dip further to $3255 by mid-next week. Yet, a brief rebound towards $3300 isn't out of the question before a potential drop to $3200 by week's end or early the following week. 🤞
Please take the time to let me know what you think about this. 💬
-------------------------------------------------------------------------
This is just my personal market idea and not financial advice! 📢 Trading gold and other financial instruments carries risks – only invest what you can afford to lose. Always do your own analysis, use solid risk management, and trade responsibly.
Good luck and safe trading! 🚀📊
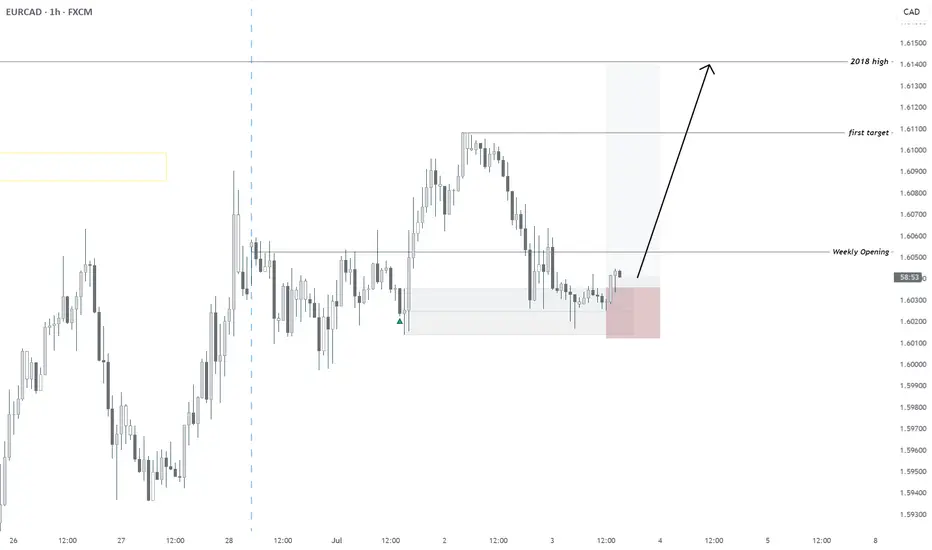
07/02/2025 | EURCAD | BULLISH - REACHING MULTI-YEAR HIGHDaily FX Outlook today:
All timeframes Bullish
Invalidation: 1.60055
First TP: on chart
Second: 2018 High
CADCHF - BEARISH - QUANT-LEVEL FX LISTDaily: Downtrend
H4: Downtrend
H1: Downtrend
m15: Downtrend
Risk of Entering Now: Better Zone a little higher
Target at least previous day low
tg@darksheeptrades

CADCHF - SHORT - Statistically-backed FX shortlistCADCHF - SHORT
Daily Outlook - Statistically-backed FX shortlist
@darksheeptrades

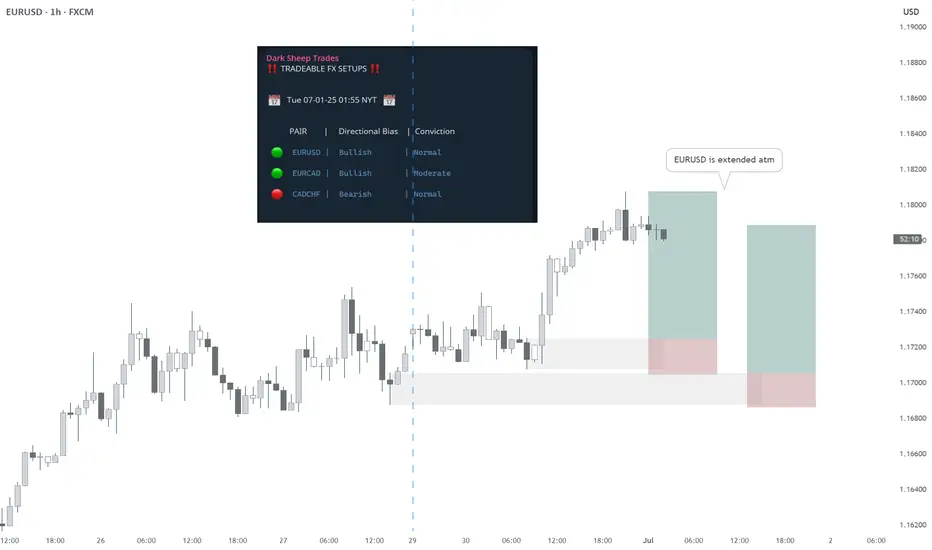
EURUSD BUY - Statistically-backed FX shortlistEURUSD BUY
Daily Outlook: Statistically-backed FX shortlist
@darksheeptrades
Daily Outlook | XAUUSD June 30, 2025Hey traders,
Fresh week, clean structure. Let’s lock in the key levels and let price do the talking.
🌐 Macro Context
It’s a heavy week for USD – all major data drops before Friday:
Tuesday: ISM Manufacturing + Powell speaks
Wednesday: ADP Employment
Thursday: NFP, Unemployment Rate, ISM Services
Friday: US holiday – markets closed
📌 This means liquidity will build into Thursday, then fade. Expect gold to stay range-bound early in the week, unless momentum shifts hard today. Volatility should peak around NFP.
🧭 Daily Structure & Bias
Gold opened weak under 3287, still below 21EMA and 50EMA. The structure shows lower highs, bearish control, and no signs of strength reclaiming ground. RSI is at 42 — momentum down, but not oversold yet. Unless price breaks back above 3340, sellers stay in control.
✅ D1 Bias: Bearish while under 3340
📌 Key D1 Zones to Watch
🔺 D1 Breaker Block – 3340–3355
Former support, now clean resistance. Includes 50EMA and last failed closes. If price rejects again here, bearish continuation likely. A daily close above 3355 flips short bias.
🔺 D1 Supply + FVG – 3385–3405
Unmitigated imbalance from early June. If price pushes through 3355, this is the next upside magnet. Good spot for first reaction.
⚖️ D1 Decision Zone – 3287–3265
Current price zone. Multiple past reactions. A daily close below 3265 confirms breakdown. Holding above = more choppy range.
🟢 D1 Reaction Shelf – 3210–3180
Minor support zone from April candle bodies. Can slow price, but not strong enough for reversal on its own.
🟢 D1 Demand Block – 3155–3120
First major HTF demand. Includes 200EMA, strong structure, and previous breakout base. If price sells into it fast, watch for rejection — but only with confirmation.
🟢 D1 Macro Demand – 3090–3055
Final line of macro defense. Clean imbalance + demand from February. Valid only if sentiment breaks post-NFP.
✅ Final Summary
• Below 3265 = structure breaks → opens 3180
• 3155–3120 = real support zone
• Below 3120 = macro shift risk
• Reclaiming 3340 = short bias invalid
• Break above 3385 = continuation possible
📌 Today is all about the close. No confirmation = no trade. Thursday is the real trigger — be positioned, not exposed.
—
📣 If this gave you clarity and structure, drop a 🔥, share your bias, and follow GoldFxMinds for sniper plans with zero fluff — only clean, confirmed price action.

UJ Sells. FX:USDJPY is overall bearish. Daily double top formed to close out last week. Looking for price to push towards daily support around 146.600 area. I'd wait for price to break below H4 support before entering sells.

2025 Market Outlook - Cautiously Bullish (Important Bar Counts)Hey Everybody,
Thanks for checking out the video. I'm reviewing all major instruments, US and Non US.
US has carried the financial markets since 2020 and 2022 and this year out of the gate we're seeing big runs in "uninvestable" spaces like Europe and China. I say that jokingly because of how bad everything thought non US assets were, but here we are watching DAX, FTSE, and HSI running to double digit gains while the US lags behind.
Will the US catch up and the global economy tide rise to lift all boats or are we truly seeing a catch up trade that will have headwinds uncertainties a plenty? Time will tell.
This week is a holiday shortened trading week, RBA and RBNZ expected to cut rates, Europe and US printing PMI on Friday. BABA and BIDU earnings this week (China related), and NVDA earnings next week (#2 market cap in US).
I discuss the big bar counts that I'm watching closely on SPY, SPX, XSP, RSP, NDX, QQQ, DIA, NVDA, META, NFLX, and others that I believe technically will matter for limited upside momentum without a bigger pause, snapback or correction ahead.
Cautiously optimistic is a perfect play for 2025. I'm off to a good start for the year and intend to keep that way without chasing or doing anything silly.
Thank for watching.

Inflation vs gold correlation 60's to 80's Pattern.Gold seems to like inflation. Or, is inflation food for gold? These are chars that no one is showing you.
According to this chart, Gold has a seven year bull run ahead of it that should top at some point in 2032.
This a chart of the US Inflation rate on the 2 month (Blue line) right from the horses mouth, Bureau of labour statistics. On the top in gold or yellow is the gold chart. As you can clearly see, in the seventies gold was very heavily correlated with inflation. This is not my opinion this is a fact, and it will be again.
THIS IS A 2 FOR ONE GUYS. INFLATION AND GOLD FORCAST ALL IN ONE!!
Let me know what you think down below.
Kind regards,
WeAreSat0shi

XAU/USD: Potential Reaction at Supply Zone*On the 4H timeframe, XAU/USD has shown a clear CHoCH (Change of Character), with the previous Higher Low (HL) being broken, taking out Buy-Side Liquidity near the highs. Price is now trading within a supply zone, aligning with bearish order flow.
On the 30M timeframe (see chart):
• A CHoCH has been identified within the supply area, signaling a potential shift in direction.
• Price looking to clear the inducement (IDM) before tapping into the zone, strengthening the likelihood of a sell-off.
• I’m anticipating a reaction and continuation to the downside, targeting lower liquidity levels around $2,730.500.
Key Points:
• Bearish Bias from the 4H Supply Zone.
• Liquidity grab + CHoCH on the 30M confirms bearish intent.
• Targeting the lows near $2,730.500 for a high-probability trade setup.
Trade Idea:
Wait for confirmation within the 30M supply zone (e.g., a lower timeframe entry such as a CHoCH or breaker structure). Maintain discipline and proper risk management.
What do you think about this setup? Drop your thoughts below!
Bless Trading!

GOLD FLY UPWARD SURE?XAUUSD Intraday Outlook: Bullish momentum persists, driven by strong market sentiment and technical support. A breakout above key resistance could open the path for further gains. Long positions remain favorable, with caution around potential consolidations or retracements."

NASDAQ: Dancing on the Edge of a Techno-Financial TightropeMarket Overview
The NASDAQ-100 (NDX) has recently corrected by approximately 5.5% from its all-time high of 22,133 on December 16, 2024. This comes after a historic rally driven by resilient megacap technology stocks, robust earnings, and the continued dominance of AI-led innovation.
Despite the correction, the index remains up 18% year-to-date, outpacing broader indices like the S&P 500, fueled by optimism around productivity-enhancing technologies. However, macroeconomic and geopolitical headwinds could temper this growth into 2025.
Technical Analysis
Trendlines
Short-Term: The NDX remains in a rising trend channel since March 2023, with the lower boundary around 20,500 acting as critical support. A recent breach of its 21-day moving average suggests growing bearish momentum.
Long-Term: The index's long-term trendline, extending from the pandemic lows in 2020, remains intact, underscoring investor confidence in the broader tech narrative.
Key Levels
Support
Immediate support: 20,790 (50-day moving average).
Strong support: 20,500 (trendline and Fibonacci retracement zone).
Resistance
Near-term resistance: 21,900 (upper boundary of rising wedge).
Critical resistance: 22,133 (all-time high).
Momentum Indicators
RSI: Declining from overbought territory (currently at 64), signaling potential for further downside before resetting to neutral.
MACD: A bearish crossover suggests weakening momentum in the near term.
Macroeconomic Context
Interest Rates
The Federal Reserve has maintained its hawkish stance, with the terminal rate hovering around 5.75%. While inflation has moderated to 2.4%, core inflation remains sticky at 2.8%, keeping rate cuts off the table until mid-2025.
Elevated borrowing costs could weigh on tech valuations, particularly for growth companies reliant on cheap capital.
Economic Growth
U.S. GDP growth is forecasted to decelerate from 2.6% in 2024 to 1.8% in 2025, reflecting weaker consumer spending and tighter financial conditions. This slowdown could dampen earnings growth across the NASDAQ-100 constituents.
Corporate Earnings
Analysts expect NDX earnings growth of 8% in 2025, down from the blistering 14% in 2024, as cost pressures and a plateauing of AI-related tailwinds take hold.
Geopolitical Landscape
China-U.S. Relations
Increasing tensions over Taiwan and heightened scrutiny of U.S. tech exports to China remain a wildcard. Any escalation could disrupt semiconductor supply chains and impact heavyweights like Nvidia and AMD.
Europe
Persistent instability in Eastern Europe and ongoing energy challenges pose risks to multinational tech firms with significant operations or customers in the region.
Middle East
Geopolitical uncertainty stemming from conflicts in the Middle East has kept oil prices elevated (~$95/barrel). Higher energy costs could indirectly affect tech earnings by squeezing consumer and corporate budgets.
2025 Outlook
Base Case
The NASDAQ-100 ends 2025 up 8–12%, driven by resilient demand for cloud computing, generative AI, and green technology innovations. Support from stable core earnings growth and moderating inflation provides a favorable backdrop.
Bear Case
Prolonged high interest rates, coupled with weaker-than-expected global growth, lead to a flat or mildly negative year. Key risks include geopolitical flare-ups, regulatory actions on Big Tech, and waning investor enthusiasm for speculative assets.
Bull Case
A dovish pivot by the Federal Reserve in H2 2025, alongside breakthrough advancements in AI or biotechnology, propels the index to new highs (~24,000).
Conclusion
The NASDAQ-100 is entering 2025 with a cautiously optimistic outlook, balanced between robust technological trends and mounting macro/geopolitical risks. Investors should monitor key support at 20,500 and resistance at 21,900 as barometers of sentiment. While near-term volatility is likely, the index remains a cornerstone for long-term growth portfolios.
For 2025, the focus is on being smart: diligent monitoring, disciplined allocations, and adapting to shifting conditions.
"There are three ways to make a living in this business: be first, be smarter, or cheat." – John Tuld – Margin Call (2011)

Market (Sectors) Performance OutlookSince November 6th, we’ve witnessed a seismic shift in the market landscape, with crypto breaking through and outperforming the broader market. 📈
The sectors leading the charge against the S&P 500 are XLY, XLE, XLF, XLC, and XLK. Notably, the MAG 7 have also been outpacing the market since November 7th. 💪
Smart money seems to be flowing into crypto, contributing to the sell-off in the S&P 500.
From a macroeconomic perspective, XLK and XLC have been market leaders for the past few months. However, it might be time to pivot towards the Energy sector, especially after a stellar earnings season where major E&P companies smashed their earnings estimates. ⚡️
Stay tuned and ready to capitalize on these dynamic market movements! 📊💼

Weekly Forex Outlook Sun.Oct.20.2024 - Fri.Oct.25.2024Like and Comments would be appreciated :D Not Financial Advice, Just my outlook/opinion

GBPUSD Understanding The StructureThe wedge like structure still in play and if price continues to trade within this structure. Then downside is less likely and eventually after a short correction to the downside we may see the Gbp make a sharp comeback against the Usd making it interesting to see a new top form within the structure. Please understand this is not financial advise/trading signal or even a Trade plan, simply speculation based on Trend lines and anticipation price behavior in a what if the structure remains intact scenario. Should the structure break the outlook can change and right now as it stands. I'm on the sidelines watching this pair.

Nifty Short, Medium & Long Term : 09-Sep-24 to 13-Sep-24Nifty Short, Medium & Long Term : 09-Sep-24 to 13-Sep-24
Nifty closed at 24855 ( Last week 25235 ) and touched low & high of 24807-25335 ( all time high)
Market touched new high last week and went down on last fri, Market broke the Ist Support at 25000 and went down last week and currently it is in rangebound.
RSI and stochastics levels moved up last week (52% and 33% respectively). MACD level crossed and went down below signal.
Nifty 24855 Short term (Short term neutral, need to cross key resistance 25545)
Nifty short term resistance 25545 as shown in chart.
Support at 24480 (Fib Support) & 24650 (Trend line support and recent low).
Medium Term 25235, next target is 25800 ( Fib Resistance). if it moves above decisively next target is 26250.
Medium term Support - 24000
Long Term : Nifty have a target of 27000 ( Fibonacci Resistance). If market close above 25540 decisively. Support at 22800
Post Indian Elections, reduction of interest rate by RBI is expected on a staggered manner till it reaches 5% ( in span of 2-3 years ) in line with US fed rate reduction expected in Sep 2024. US President Election scheduled in Nov 24. Until then Market may correct if any global news upto19500 as there is strong multiple fib support in this range.
Caution to be emphasized on Nifty as nifty PE is in high level with high valuation especially in Mid cap & Small Cap.
Those with lesser risk can sell partial portfolio ( 20-30%) stocks which have less valuation and can wait for opportunity to buy when nifty dips upto 22800. This is the best period to start SIP MF when the valuation is high.
Deploy stop loss of upto 7%-8% which is crucial. More Risky players can have stop loss of trend line resistance of 23750 as shown in the chart.
Nifty bank 50582 (Last week 51117) - Index have target of 54000 in medium term and support at 49900
Stock Picking is needed at current scenario in Bank, auto, Pharma stocks.
Newly added stocks to buy are CAMS, UTI AMC & HDFC AMC and removed tanla platform from the list as the profit is stagnated, to await till next quarter ( Q2) Results.
Based on the Q1 results, following stocks can be added to portfolio: ICICI Bank, HDFC Bank, Indian Bank & Punjab National Bank.
Fundamentally good stocks can be added as it posted good results on every dip in finance stocks such as Manappuram Finance, suryoday small fin, Motilal Fin, Chola Finance, Dr Reddys, Natco Pharma, Cipla, JK Cements, Biocon, Persistent Sys, PI Ind, PNC Infra and Ashoka Buildcon. There is a possibility of dip to 21000-22000, hence please buy in parcels and every dip of Index and every dip of individual stocks (2-5% of portfolio on each purchase for long term) The above stocks mentioned are based on analysis of top line & Bottom line performance, hence based on the risk and portfolio mix one can add after analysis.
Nifty IT 42234 (Last week 42760) indices dipped to 37848 in Jun month, bounced back and all time high last week. Recovery of US stock market and awaiting FED rate cute decision pushed the US stocks up and followed by Nifty IT Index.

BTC Dumps to 56K - Extreme Fear in the Market!GM crypto bro's! This morning, BTC has dumped again to 56K. The Fear and Greed Index is in the extreme fear zone at 22, and it looks like the Stochastic RSI won't be leaving the oversold area anytime soon.
That's why I always remind you to stay cautious in this highly volatile crypto market, because anything can happen. Based on the current price action, the probability of dropping below 54K seems low, as mentioned in the market update on 02/09/2024.
But remember, this is just my personal analysis and only a probability. As always, maintain your risk management, and that's all for today's crypto update. This is Akki, signing off with one chart. Have a nice day!

Shot Calling no1I've been away quite some time,. working on strategy and just growing accounts.
This is to serve as a trade record for forex. I also trade futures, but that is too fast for here.
Current Active Trade:
Current setup is I have a short from 1.08023, entered yesterday post NFP. Thinking the extension is a clean breakout from the triangle pattern over the last week to take price long overall, but first we need to retrace.
Target:
1.074 for the short and then head for a long entry (Limit Price Set)
Looking for price to come back and then react long from 1.074 & continue making upwards pushes.
Account size: $1500 (EUR, Reset for the month back to...)
Current Entry Sizes 0.07 Lot
Risk: Rule of thumb 0.01 per $250, Previous balance before reset was 1848.53/250 = 0.07, keeping size currently in play.
Red lines mark sells:
The additional red lines above the entry are for protection. There is no stop loss on any position, ever. These are additional sells at the same size as the original entry.
Should this entry not work, price will either head up and catch the next level up at 1.086 (Trading view moved my lines back after I already set them, not going to fight it not saving 😤 they're close enough) and add short another 0.07, or it will miss the second entry, come back to target & we just have drawdown, boo hoo.
Should it fail completely, the third entry will get taken at 1.0976 for short.
How this is "Protection":
Math, in simple terms. It's a manipulation of breakeven on position. If the second entry gets triggered, the breakeven point is between the two entries. If the third short is also hit, then the breakeven is where the second entry is placed. These are exit points later should things go wrong.
The major breakout and peaks are "insurance" where we will 99% for sure get a reaction to the downside, it's just natural resistance behavior.
Same goes for the next trade, same idea with the blue lines already planned, should this succeed we go to no2, fail we make a different no2 idea.
Trading at or very near to the yellow lines (clear and obvious levels) & using educated guessing for reasoning (technical analysis or just a simple "seen this before" approach) Keeping it really simple.
Method of Madness:
Support: buy
Resistance: sell
Add in if wrong at the next level
Hedge: Not forgotten, but avoid use if at all possible (Trap situation that hurts more than helps)
Only act on levels, near levels, or extreme event points (breakouts/peak points)

USDCHF: Multiple Rejections, Strong Bullish Leg ExpectedPrice has recently rejected support on multiple occasions, and a double bottom pattern appears to be emerging on the daily (D) timeframe. Additionally, multiple rejections on the 4-hour (4H) timeframe further strengthen our bullish bias. I expect the price to continue in a strong upward trajectory.
**Rationale:**
~ Breakout of Descending Channel (D)
~ Retest of Support (D)
~ Break of Uptrend line (D)
~ Double Bottom Pattern (D)
~ Retest of Support (4H)
~ Rejection Candlesticks (4H)
**Disclaimer:**
My trading ideas are market predictions and therefore should be viewed as such. As an intraday trader (scalper), I use my observations to identify potential trade opportunities on the higher time frames. I then aim to pinpoint key entry points on the lower time frames. Entries should always be verified by additional confirmations.
---
#scalping
#intraday
