DAX: Weekly outlook and detailed analysis!#CHANES and ENTRYS.HEy tradomaniacs,
welcome to a little weekly outlook!
Overall we`ve seen a very nice correction back above 11.100 which is a decent retracement after this holy moly huge sell-off we`ve seen after the S/H/S and Diamond-Pattern
got triggered though we have not even finished this superir trend-changing pattern yet.
So what can we expect? There is a lot of fundamental things going on, such as the tradewar, brexit and so on.
How ever, we want to focus on the technicals aspects and talk about important price-levels and possibilities.
Technical Aspects:
-----------------------------------------------------------------------------------------------------------------------------------------
Price-Action:
Since we`ve seen the Breakout of the S/H/S or Diamond-Pattern, Team bear seemed to be unstoppable and sold the diva
down to capitulation to a significant Support-Area between 10.261 and 10.859.
After the violatin of the important Resistance @ 11.000 and 11.100 and the confirmed S&R-Flip, we were not able to do anything and just
consolidated in between the red Resistance-Zone and the current major support.
It looks like the market is waiting for a clear impulse in to a direction, thus the next impulse should be crucial for the next upcoming moves.
Either we continue the downtrend with a lower high by a break through 11.100, indicated by the red diagonal resitance of the shorter timeframe,
or we violate the current resistance and probably retest at least 11.416, which is the next subservient resistance marked up in red.
The last "Endboss" to liquidate the bears of this downtrend would be @ 11.500 - 11.700.
A violation of this resistance could completly destroy dow current downtrend.
RSI:
-----------------------------------------------------------------------------------------------------------------------------------------
The RSI indicated a completly oversold market. This might be one reason for this retracement but also could
be interpreted as "Shit, I will never get the DIVA as cheap as now again." and a new impulse upwards in the longer
time frame.
For now we are back and are knocking at the door of Mr. Overbought to enter "Profit-Safe-Zone".
MAC-D:
-----------------------------------------------------------------------------------------------------------------------------------------
After the divergence the market reacted as expected.
We are above teh triggerline but could create a Sell-Signal very soon, since both MA/s tend to cross again.
This would probably force the Bulls of this impulse to safe their profit.
Moving Average:
-----------------------------------------------------------------------------------------------------------------------------------------
The yellow moving average represents a period of the important 100 days.
As you can see, we are currently close below and could bergin to test it, after we`ve seen a breakout!
The blue moving average represents a period of 50 days,
AS you cann see we already respected that MA as a new support and could bounce of it over and over again.
Fibonacci:
-----------------------------------------------------------------------------------------------------------------------------------------
The yellow Fibo-Bar represents the retracement of the very big timeframe and shows a stop of the sell-off close @the 61,8% retracement.
This is a very good sign and represents a valid UPTREND in the big picture, according to the elliot-wave-theory.
Please check my other charts to see more in the weekly chart!
The green Fib-Bar measures the current retracement of the sell-off. We made it above the 23,6% retracement,
which is exactly between the current Support-Zone @ 11.052.
A further retracement up to 38,2 is very likely if we break through the current "Sell-Pressure-Zone".
The sell-off ended btw. @ the 161% extension of the impulse downwards!
Steepness:
-----------------------------------------------------------------------------------------------------------------------------------------
The steepness is decreasing and represents weakness of the down-trend.
How ever, it looks like we currently stuck in a very tight range and should wait for the next impulse to come!
If we fall, then we`d see a classic trend-continuation.
-----------------------------------------------------------------------------------------------------------------------------------------
Conclusion and nice prices to trade:
Sell below 11.050 or below the 50 MA @ 10.971!
Buy @ 11.289 or above 11.300!
-----------------------------------------------------------------------------------------------------------------------------------------
AND as always: Don`t just randomly trade. Wait for your triggers, confirmations.. and.. yeah I guess you know what I mean.
I wish you a great start into the next trading-week!
-----------------------------------------------------------------------------------------------------------------------------------------
LEAVE A LIKE AND A COMMENT - I appreciate every support! =)
Peace and good trades
Irasor
Wanna see more? Don`t forget to follow me.
Any questions? PM me. :-)
Outlook

NQ - Nasdaq 100 - Supply & Demand Zones/Rising Wedge/FibonacciLooking for some more upside after a short pullback. Then be on the look out for a breach of the rising wedge and a retest on the peak trend line.

EURUSD - Turning points on the Daily Looking at where price is there are a few levels that are jumping out.
The first area is the 1.17400 level, there was a strong move down from this level, looking left however there has been a lot more activity in this area which leads me to believe that although there could be a good opportunity here there is a better and untouched area at 1.19250 area.
If price pushes up toward the 1.9250 area there is a stronger possibility of a drop.

EURUSD - Highest Probability Turning points on the Weekly chart The 1.12000 level has only just been touched and rejected so this could offer another area to get long. However the untouched area that would offer a better low risk chance of a turn would be down at the 1.10200 level.
The highest point offering great shorting opportunities is way up at the 1.22800 area

btc 4hr bearflag breaktarget aligns exactly w/weekly chart 200maInteresting confluence here as I've noticed that the 4hr chart has a bearflag with a long enough pole that the exact drop target would be almost identical to where the weekly charts 200ma is currently residing in the lower 3.2ks. We all know the weekly 200ma provided the ultimate support for out last big bounce around this region...and it also has a high probability of maintaining that support as well as triggering another big bounce and possibly even a double bottom on that 200ma weekly support trendline. The other confluence is how all the multiple time frames (1hr,2hr.3hr, and 4hr) all seem to be on the verge of an impending deathcross and will likely happen one after another like a set of dominoes. The 1 hour chart has already had its deathcross, the 2hr chart deathcross is next then the 3hr then the 4hr and next and so on until we have all the deathcrosses and I anticipate it will be right when the 4hr death cross occurs that we really drop. Of course we have to break down from the bearflag first with confirmation before entering a position in it. . .so until the death crosss occurs this will remain a no trade zone for now. With a big big move to follow soon. One last thing I noticed is that xrpusd appears like they will be having a 4hr deathcross very soon which could spell trouble for xrp in the not so distant future...hopefully xrp can figure out a way to pull off a deathcross fakeout. Anyways good luck out there it was all this confluence that makes me think it will inevitably break down.

SPX500: Years-End-Analysis! RETEST of 2.600 is pretty likely!Hey Tradomaniacs,
welcome to another weekly overview of SPX500!
Let`s take a look at the year and what we see is a huge but delayed Sell-Off compared to the european market!
SPX500 started this year @ 2.666 and was struggeling since then! adter the first sell-off in January 2018
loosing more than 12% we`ve seen the first signs of fear and panic. The uncertainty continued until April before
the market decided to give it anotther try and we`ve "bought" an uptrend to the SPX500 ATH @ 2.940!
What a run - But the double-top-pattern came 8 days later and caused a new massive sell-off!
The breakout and retest of the Trendchannel confirmed the panic and cause more bearish power.
We gave it another attempt.. and bounced off again. The S&R-Flip was cut in stone.
The last attempt was just a desperate act of team Bulls..but they had to surrender.
GG WP?
The next break below this "Tripple-Bot / Tripple-Top ala range was a volatile walk on a knife edge, and the high volume continuation of the
sell-off confirmed that.
We`ve retested two converging trendlines and the Range of Feb. 2017 - June 2017 which is almost at the 1.618 Extension of the first Sell-Off!
A retracement as a retest of the recent support @ 2.600 is pretty likely and should give the bulls another chance to turn this game into their favour.
Technical Aspects:
--------------------------------------------------------------------------------------------------------------
Overall you can see the market is still very freaking volatile and attractive to daytrade.
After the recent massive sell-off below the low of the YEAR at 2.530, team BEARS didn`t stop until we`ve reached the
low of two converging trendlines @ 2.2321. We´ve retraced 38,2% but it should be pretty likely to retest at least the years low or the
61,8% retracement, which is excactly at the previous support (2.600).
The Wave-Count is not complete anymore.. I don`t know why, but it just dissappeare and I`m a lazy person! ;-D
You can see that we are still in a correction.
The question is: Will this still be a correction? Or do we head into a downtrend?
We are currently in WAVE 4 of WAVE (Y) (which is actually WAVE C).. but I think it`s easier to understand that way.
It`s pretty likely to see a retest of 2.600!
--------------------------------------------------------------------------------------------------------------
All fundamentals are pretty bearish! Looking at the FED`s policy and its plans to increase the interest rate
we will ahve to expect way less liquidity, consume and investments in the market.
THIS IS NOT GOOD FOR THE WALLSTREET ;-D
We will see what happens!
I WISH YOU A HAPPY NEW YEARS EVE! Enjoy the time with family and friends! :-)
---------------------------------------------------------------------------------------
LEAVE A LIKE AND A COMMENT - I appreciate every support! =)
Peace and good trades
Irasor
Wanna see more? Don`t forget to follow me.
Any questions? PM me. :-)

EUR/USD: The years-end-analysis - Likely to see PARITY!Hey Tradomaniacs,
welcome to another weekly overview of EUR/USD!
Let`s take a look at the year and what we see is a huge Sell-Off aswell!
EUR/USD started this year @ 1,19873 and found our years high @ 1,25628 in feburary.
After that we`ve just consolidated in a range between the peak and 1,22.
FED`s rate hikes consistently punished the EUR which was affected by many different political circumstances
like Brexit, italy, france and so on.
The European Central Bank decided to quit the QE not as expected - But these might be the first signs of a hawkish policy.
But will we seriously see a rate hike this year? I don`t think so.
What is the consequence of the financial crisis in 2008?
The ECB did nothing else than shifting a problem with financial injections by a ZERO-interest-rate-policy
and the Money-Print-Rage + the QE.
I bet you`ve heared about the quantity equation.
The best way to fight inflation is to increase the interest rate. Since the recession is slowly on its way to destroy
our economy again indicated by a cooling down economy and stockmarket the ECB can not just increase the interest-rate in 2019
as planned and Draghi probably wont even increase them during his term.
Why? Because the only way to suppor the economy is cheap debts/money/credits.
Technical aspects:
--------------------------------------------------------------------------------------------------------------------
After the break through the Neckline we`ve seen a test of the 61,6% retracement and could show us the first impulse
after the breakout of this S/H/S-Pattern. the next move is a retracement back to the trendline, where we bounced off again
and created a doji aboce the candles body.
Is all this a retracement ala kissback before we continue the journey to the south called "parity"?
The FED`s policy is pretty hawkish because Jerome Powel has officially confirmed that the FED-PUT is gone.
He won`t take a look at the Wallstreet anymore and prefers to take the economy and its climate as his indicator for his monetary policy.
The S/H/S-Pattern target would be @ 1,05 which is between the 1.414 and 1.618 Fibonacci-Extension.
The time-Zones are pretty accurate and should be taken seriously.
Conclusion: I`m more bearish but it`s all up to the political situations around us in Europe plus
the ECB`s upcoming desicions.
--------------------------------------------------------------------------------------------------------------------
We will see what happens!
I WISH YOU A HAPPY NEW YEARS EVE! Enjoy the time with family and friends! :-)
---------------------------------------------------------------------------------------
LEAVE A LIKE AND A COMMENT - I appreciate every support! =)
Peace and good trades
Irasor
Wanna see more? Don`t forget to follow me.
Any questions? PM me. :-)

GOLD: Years-End-Outlook! We are at the CRUCIAL ZONE!Hey Tradomaniacs,
welcome to another weekly overview of Gold!
Let`s take a look at the year and what we see is crazy!
Gold started very well with the years-end-rally of 2017 and retestet the High of 2016!
Technical aspects:
--------------------------------------------------------------------------------------------------------------------
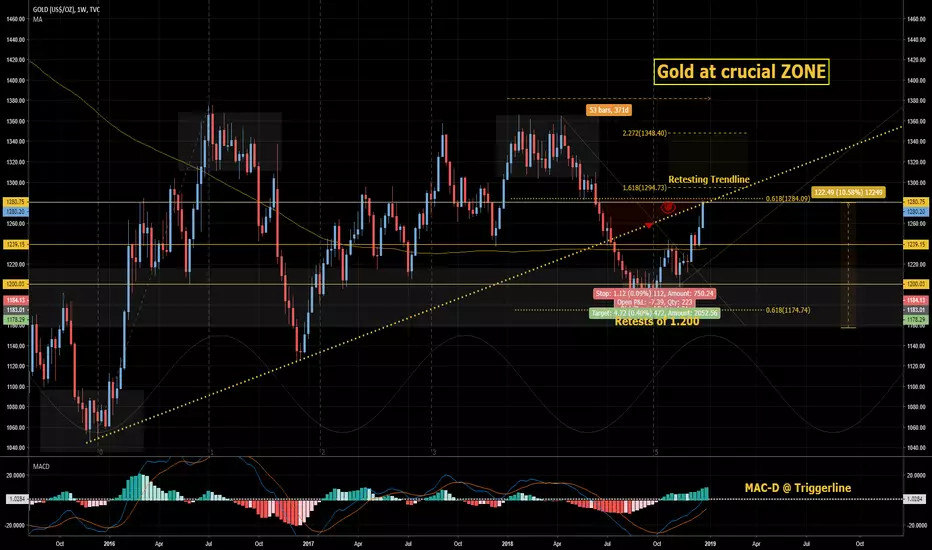
Gold was steady inside a range of 1.303 - 1.365 and broke through the important support of 1.280!
This caused a massive sell-off as every else down to to low of 1.160 which got stronger after
we`ve violated the trendline which started at the low of November 2015.
And as always - the 61,8% retracement was the bulls HEROS which is @ 1.183 and is the current support
after this sell-off. We`ve started to retrace up to the trendline again and are currently at a VERY crucial ZONE.
This ZONE is a very strong resistance and should be decisive for the next move!
We are at the 61,8% retracement of the previous sell-off which is at the trendline
Addotionally we`ve almost reached the 1,61% extension-level of the bulls whose bought this retracement.
Time to take profit or stack up positions?
Is all this a downtrend and we continue after this retracement?
Or will this turn out to be a fakeout and we continue the uptrend above the trendline?
--------------------------------------------------------------------------------------------------------------------
Fundamentally I see a lot of potential in Gold which alwys used to be a safe haven in bloody stock-markets.
The inverted yield-curve used to be a very reliable indicator for a upcoming recession and could change the cashflow
out of stocks into alternatives like gold!
We will see what happens!
I WISH YOU A HAPPY NEW YEARS EVE! Enjoy the time with family and friends! :-)
---------------------------------------------------------------------------------------
LEAVE A LIKE AND A COMMENT - I appreciate every support! =)
Peace and good trades
Irasor
DAX: The years end analysis! *WEEKLY UPDATE*Hey tradomaniacs,
wow what a crazy and sad year for all bulls.
I hope you all had some short-certs and made a lot of money.
But yes, it is as we all had to expect! The financial crisis of 2008 got shifted by financial injections
of the FED, ECB and other central banks.
The low interest-rate and QE made it worse and worse and might be time to pop the bubble.
-----------------------------------------------------------------------------------------------------------
Technical aspects:
The year started 12.889 and the DIVA found its peek @ 13.600!
(Thank you Trump for your Tax-promises which made that possible! ;-D)
Since then the DAX has created the first double-top and turned out to be a S/H/S or Diamond-Pattern which is the first evidence of a trendchange.
It`s crazy, but after the Break through the NEckline we`ve seen another attempt called the retest or Kissback to get above 11.800 again.
That bounce and S&R-Flip was the confirmation for the market to sell-off the Diva and went down to the years-low of 10.284.
HA but look - we could fight our way back to the 61,8% retracement-level which is obviously a very common level for the bulls.
It`s been a long time since the market has been oversold like these days. When is the time for a correction?
Well - My opinion - I think it`s time to see the DIVA trying to get above 10.829 - 11.100 is possible!
The last weekly candle is a huge Doji, which indicates a lot of Buy-Pressure caused by the U.S. Market.
Overall the chart looks pretty bearish, but the price is very low and I think there might be some bulls in the tank trying to buy this one.
We will see!
I WISH YOU GUYS A HAPPY NEW YEARS EVE! Enjoy the time with friends and family!
-----------------------------------------------------------------------------------------------------------
LEAVE A LIKE AND A COMMENT - I appreciate every support! =)
Peace and good trades
Irasor
Wanna see more? Don`t forget to follow me.
Any questions? PM me. :-)

Weekly Outlook 31st Dec - 4th Jan - AUD/CADPrice has been ranging sideways between 0.9600 and 0.95700 this shows me that there is potentially a chance price may break lower.
There is a fresh Zone at the 0.9300 level which has had one tiny test and bounced from this level. If price shows signs of rejection at this level it could be a good place to get long to the 0.96900 level.
If price were to break to the upside first I would be watching the 0.9600 level to short.

Weekly Outlook 31st Dec - 4th Jan - EUR/USDIm currently in a short sell from the current zone at the 1.14500 level entry was at 1.14600 my Target is 1.13800
The reason Is this has the highest probability of being hit.
After this area we have got a demand zone which has been used twice already, potentially this could now fail and see prices push to the lower zone on the daily at the 1.12100 level.
I will watch and see how price moved at the 1.13500 level as we could see price try one last move up before a further drop

Outlook - EUR/USD 21st - 28th December Price found the 1.14500 level this week as a hard area to push past, overtime price got to the level it found strong selling pressure.
For the most part price has been ranging between 1.1§300 and 1.14500
Two areas that I have got my eye on are firstly the lower Demand zone at 1.12200 when price found this area last, there was strong buying pressure and shows this would offer the best low risk area to go long.
The higher zone that saw a stronger drop was the 1.17500 area.
This offers a very large 500 pip price range, will see which area price favours hover it may be a slow week due to christmas

Outlook for GBP/USD 24th - 28th December Having a look at where price is currently.
Price has been finding selling pressure at the zone in the middle at the 1.2700 level. The first 2 touches of this price has shown that there are a lot more selling, further to this on the 3rd attempt at this zone, price found pressure a few pips lower.
Between 1.2700 and 1.2600 price has started o move sideways with no real push, this could be due to the Christmas period and the markets slowing down in general.
Having a look at the Fresh Zones where we would see the best risk / reward there are 2.
The lowest zone hasn't seen price since April 2017, if price pushes through the lower timeframe structures this would offer the best area to buy from imo.
If price were to find this level at 1.24300's then on the higher levels we have a larger range of around 500 pips.

USDJPY- GREAT LONG TERM BUY IN THE MAKING
USDJPY is getting close to the zone where we're expected to look for a buy setup. Personally wouldn't be looking to enter any short positions unless we get a nice sell setup. We still have the possibility of getting a more complex correction for this B wave.
Will keep you updated.

SPX: Weekly outlook! Best price to buy?Hey tradomaniacs,
welcome to another outlook of the S&P500!
Tuff times and volatile markets are giving Swingtraders hard times to trade the market.
On the other hand, we`ve seen much volatility and perfect preconditions for daytrading! :-)
The S&P500 as the "world index" should be on your watchlist to observe the market carefully!
Will we crash? Or can we stay above the panic-zone?
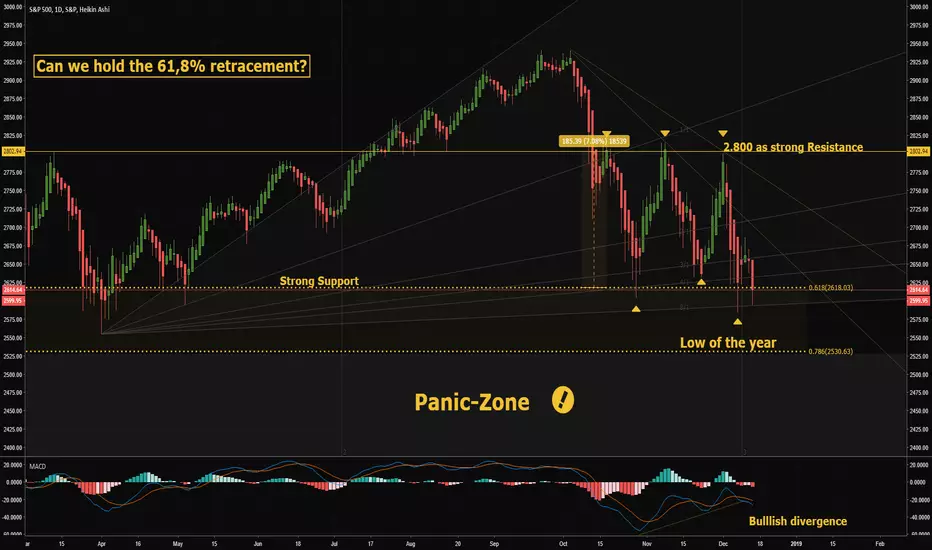
SPX500 is currently dancing between 2.600 and 2.800 since 03. October!
With two rallys after the the Sell-Off the market was trying to get above the 2.800 but coouldn`t make it.
Every rally has got totally invalidated by the market due to uncertainity driven by news over news.
The MAC-D is showing us a "Bullish divergence", creating higher lows, while SPX lows are going sideways!
Overall we have seen more bearish commitment, it seems the market wants to safe profits as fast as possible.
The political situation is cooling down and relationship between China and teh USA seems to be headed in the right direction.
If cruide oil climbs, we could see more optimism and at least another try to break through 2.800!
Cann we holf 61,8% retracement and 2.600? We will see! :-)
I wish you a great start into the new week!
LEAVE A LIKE AND A COMMENT - I appreciate every support! =)
-----------------------------------------------------------------------------------------------
Peace and good trades
Irasor
Wanna see more? Don`t forget to follow me.
Any questions? PM me. :-)
USDCAD - Outlook 17 - 21 December Price has rejected the Weekly zone and then we have also see a test of the Daily zone with another rejection, this gives some indication that this level has more sellers that buyers.
Based on this price could fall and test the 4hr zone

EURAUD - Outlook 17 - 21 december Price is currently in the middle of 2 weekly zones which have both been tested at least 3 times.
The upper zone is a zone from Nov 2009 and has had some big drops in the past, because of this we may not see strength at this level.
We are seeing price respect a daily level, due to the zone below having been test 3 times, we could see price make a break lower to the fresh zone below which would give a better low risk long position.
Will want and see which way price moves

GBPAUD - Outlook 17 - 21 DecemberPrice is currently in-between 2 Zones currently, price has touched and rejected the Weekly area 3 times but hasn't moved away with any real force.
Price could re test then move to the lower level, as it stands I will wait and see which way price decides to move before looking for any entries

EURUSD -Outlook 17 - 21 December Price has now touch and rejected the current weekly zone 3 times, if we see a further test of this area then we could see prices break lower to the fresh zone below, similar to the DXY breaking higher to the higher zone.
If price does respect this level there is a 4 hr zone to be aware of

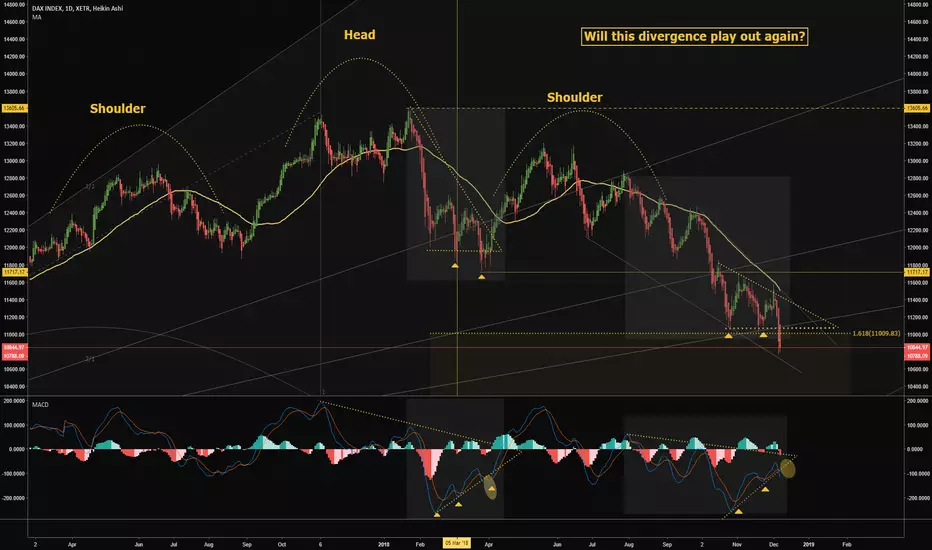
DAX: WEEKLY OVERVIEW! Look at his divergence!#Buychance?Hey tradomaniacs,
quick a weekly overview of the DAX.
It all plays out as the S/H/S-Pattern pre-determined.
Technically we`ve seen a decent correction and sell-off below the 10.000, which has not been touched for more than 8 years.
The sell-pressure is more than obvious and clear. But can we recover?
Is that a trigger for panic? Or rather a chance to buy as cheap as never before?
NOONE KNOWS!
My first target is the 10.583 and should be the next decent support-level!
But what about the US-Markets, whose seems to be upbeat not willing to violate the previous lows of the year?
If we don`t head downwards the DAX could possibly get "support" by the Wallstreet.
During the last week we`ve seen alot of important news that could support the wallstreet this month!
1. OPEC finally agreed to reduce the discharge of oil by 1,4 mio barrel a day.
2. NFP-Data way worse than expected. A weak economy means no the FED could possibly abstain from its policy and decrease the amount of rate hikes, which would weaken the US-DOLLAR and push the economy (still liquidity) and
oil!
But there are still important things like the brexit, tradewar, italy and so on!
What will happen? Noone knows!
For now, I`m still bearish but I see the potential auf a change before we crash next year! :-)
-----------------------------------------------------------------------------------------------------------------
Leave a like and a comment - I appreciate every support! =)
Peace and good trades
Irasor
Wanna see more? Don`t forget to follow me.
Any questions? PM me. :-)
BITCOIN UPDATE: A possible path of Bitcoin to the bottom to 3k?Hey tradomaniacs,
Keep bleeding, keep, keep bleeding love..
- Where will go we go?
- Where is the end?
- When is the price low enough for the big banks to seize?
We don`t know but ther is ONE fact and ONE advice for everyone!
Don`t try to catch the bottom - or rather.. don`t try to catch a knife! :-)
Be patient.. as soon as the see a trendchange we might get a chance to stack up our positions! :-)
But for now, we`ve gotta wait and see how much BTC can bleed without getting knocked-out!
We will survive my friends!
----------------------------------
Leave a like and a comment - I appreciate every support! =)
Peace and good trades
Irasor
Wanna see more? Don`t forget to follow me!
Any questions? PM me. :-)

SPY is now a buySPY is now a buy for the technical reasons given on the chart. It's been a rough earnings season but I expect outlook to brighten once again coming off this low. This is a little derivative of my GOOGL idea but I wanted to reiterate my buy rating on SPY now that we have seen the last leg down.
What do you guys think?
-Kristian

Possible AUD/CHF Short position!!SELF DEVELOPMENT/METHODOLOGY/PSYCHOLOGY
Chart time frame - H4
Timeframe - 1 Day
Actions on -
A – Activating Event
Currency Pair creating a Triple Top .
B – Beliefs
Market will be rejected at @0.723 level and move towards the first Target 1 level @ 0.72 level.
FX:AUDCHF
Trade Management
Entered @ Still waiting for confirmation.
Stop Loss @ Still waiting for confirmation.
Target 1 @0.72
Risk/Reward @ 1.5:1
Happy trading. Will let you know closer to the time if or when executed:)
Follow your Trading plan, remain disciplined and keep learning !!
Please Follow, Like,Comment & Follow
Thank you for your support :)
This information is not a recommendation to buy or sell. It is to be used for educational purposes only!
