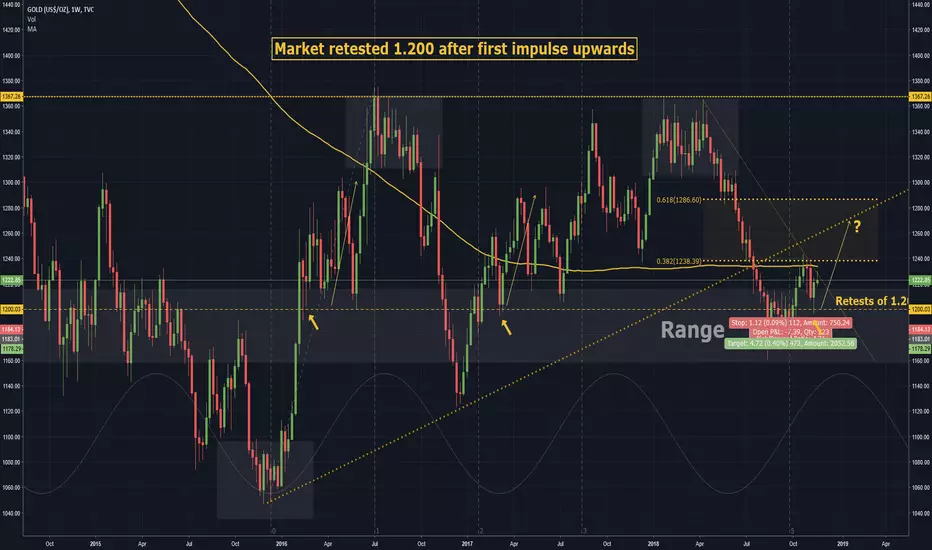
GOLD: Weekly overview! Chance to see 1.268 soon is likely!Hey tradomaniacs,
WELCOME to the overview of Gold.
Within the last week, we`ve created a "DOJI-Candle" which indicates a sideways trend.
The market almost closed at the same price it openend.
We`ve seen no volatility and no real direction.
Important resistance:
Within the last 5 weeks we were not able to move above the 38,2% retracement which is at 1.238 - 1.243.
The respected 200 weekly M/A is right at the resistance and seems to support it.
How ever, according to the dow-theory we still see higher Lows indicating an uptrend, thus it`s more
likely to see GOLD rising up to 1.268!
A breakout through the mentioned resistance could be a very nice and volatile trigger for the market to buy.
A break through 1.184 could cause a sell-off down to 1.122!
The primary trend shows an ascending triangle which is also a positive sign for gold!
We will see! :-)
Have a nice start into the week!
Peace and good trades
Irasor
Wanna see more? Don`t forgetto follow me.
Any questions? PM me. :-)
Outlook
DAX: Weekly Overview! Chance to get back to 12k!Years-End-Rally?Hey tradomaniacs,
we had a very rough time and there are still a lot of political concerning circumstances against my assumption.
It looks like the market trys to grab every chance it can get to buy DAX for such a low price.
The german market was able to prove its sentiment within the last week since the US-market was in "Holiday" and
gave us no impulses to follow during the Wallstreet-Session. The market was just uncertain and didn`t move at all.
What does that mean?
It seems like the german / european market has no own opinion about the current situation.
Are we waiting for actions of Trump and the white house?
Are we waiting for sales numbers after the black friday?
Are we waiting for the Brexit?
There are 5 important upcomig events next week:
1. Trump-Xi Meeting
2. Brexit Developments
3. FED: Powell Speaks
4. U.S. 3Q GDP - Second Estimate5
5. Euro Zone Flash Inflation
Technical situation:
As you can see, we are currently in a situation which looks like a decent correction after the impuls-phase
that started in Feb.2016 and ended in the beginning of this year.
Since we were violating 12.000, the market is still very bearish and could continue the joruney.
Technically it`s pretty likely to see a retracement in order to create the WAVE B of wave (Y)
to retest the golden and psychologically very important mark of 12.000.
The market could prove it`s creed and should give us a clear direction forcing more market-players to react.
We still see a double-bottom @ 11.000 with a neckline @ 11.687! If we trigger that pattern we could
head to the big battlefield at 12.000 and find the path the DAX really wants to go.
Remember: The seasonality is great! The years-end-rally could give us nice chances to buy the market.
And as often, the END-BOSS will activate the "Rage-mode" before he capitulates! ;-D
But yeah, everything CAN HAPPEN.
Have a nice start into the new week!
Peace and good trades
Irasor
Wanna see more? Don`t forgetto follow me.
Any questions? PM me. :-)

BITCOIN: weekly OVERVIEW - Next station at 4.663? *19.11.18*Hey tradomaniacs,
welcome to a weekly overview of Bit-Coin!
I know, everyone is nervous but also scared to miss the chance before we go up to the moon.
But it seems like we could still see some bullish momentums down to 4.663 - 4.000 before
we might continue the primary uptrend in Januar 2019!
Why do I think so?
Because big financial institutions won`t stack big positions at this price.
As always, the market will dump the retail-cryptoheads and cause panic sell-offs before they buy-in
in order to get a BTC as cheap as possible.
If you think BTC could be aa very nice alternative for the falling stock-market, you should
rather wait since the signs for a years-end-rally at the Wallstreet are positiv.
However, we will see what is going to happen.
The market is currently still bearish! Don`t buy just because you "guess" and FOMO.
Chill and wait for clear signals upwards. :-)
Peace and good trades
Irasor
Wanna see more? Don`t forget to follow me!
Any questions? PM me. :-)

EUR USD outlook for next week.After the non-stop fall of EurUsd and how it finished up today. I see we could still land further down, however, I will be waiting to see how the markets open Sunday night and give further detail about what I will be doing with this pair.
Feel free to like and comment with your personal ideas on this pair.

EURUSD Aggressive Short1. EURUSD broke the bottom of the range again.
2. Looking to short at 1.1535. With good RR
*When price reaches that level, look for a good entry signal.
3. Just nice 0.618 fibs retracement level is there as well.

MONTHLY ANALYSIS ON DXY(US DOLLAR INDEX)I believe that the Dollar Index is still bullish on the monthly perspective at the present moment @15/09/2018(UK DATE) but it is losing steam and will look to reverse around the 98 -100 region. This will give traders an opportunity to go long for the time being i'm expecting in the upcoming months. As we reach the levels of resistance i will expect a reversal and price should look to fill more of the market inefficiency to the downside( along the way turning support into resistance).
I will be updating it as price goes along in the upcoming months...

MU Micron Bullish OutlookMicron looks bullish but becareful, if it breaks below the trendline it will become bearish very fast. This stock is very volatile.

August outlook. GBPUSD has been falling for a long time and is close to strong support levels. Possible correction in the near future. The chart shows that volumes are falling along with low volatility. A strong divergence was formed. Therefore, in the near future it is necessary to monitor the levels and it is likely that the pair will bounce up with a correction to the levels 1.35 and 1.38. Follow the news. By the way, the DXY index is also trading at historical highs, a downward correction is possible. This will give an incentive to buy the GBPUSD pair.
Good day everyone!)
Remember - the most profitable deal is ahead of you!)

August outlook.The EURUSD pair is trading near strong mirror support levels, from which the pair has repeatedly fought both down and up. There may be fluctuations around these levels with subsequent correction to levels 1.1850, 1.1940 and 1.2070. However, it is necessary to follow the news. If you pay attention to the index DXY, its value is at historical highs, and it is possible to roll back from these levels down. This can serve as a good signal to buy EURUSD pair.
Good day everyone!)
Remember - the most profitable deal is ahead of you!)

EUR/USD. Longterm. Short.Hello,
This is the idea for EURUSD instrument, for a couple of mounths.
Good luck)

FVX 5 Year Treasury Yield: Longer Term Outlook for RatesFVX Longer Term Outlook for Rates
Since Yellen retired in February FVX has risen to test the the junction of the upper parallel at the same point in time as it hit the fixed resistance line at 29.83. Since then it's been consolidating inside a slowly forming pennant formation with a spike down to the 25.46 line almost exactly before it pushed higher again.
Though it's likely to spend some more time messing inside the pennant, eventually the upper parallel is going to give way leading a spurt higher to 37.22 and then after consolidating some more should beat 37.22 and push higher to 52.39.
That's the most likely stopping point for interest rates from that point - until wage inflation pops even higher, forcing the Fed to follow long again on rates, whether the President approves or not.

Intraday outlook. Long.Hello,
My vision of today for EURUSD.
The comments will be later.
Good luck to everyone.

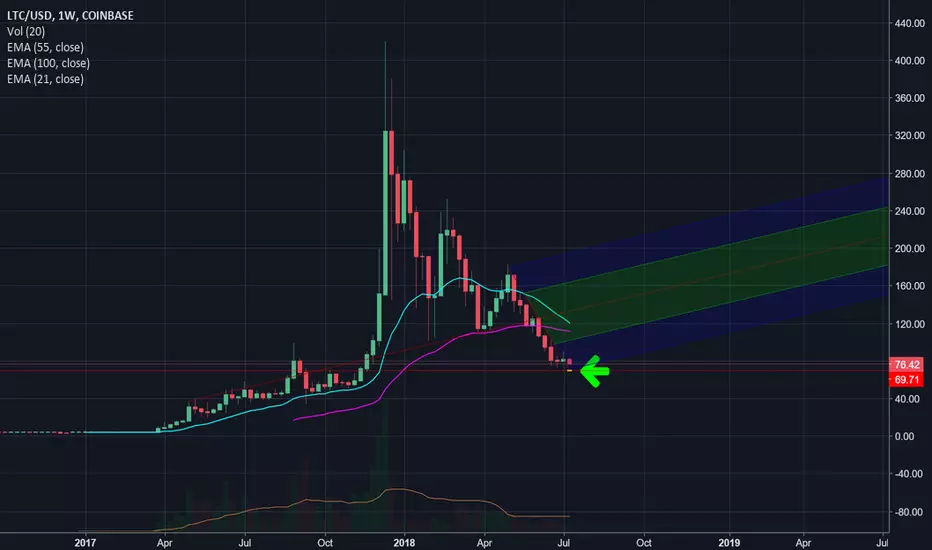
A modest outlook on the future of LitecoinKnowing that what goes down can come up in the world of charts, here is the outlook we all want to see. I see this as a good entry point for the long term hodlers. BUT if we leave this channel and continue to dip then be ready to buy cheaper. Cash is king! Be ready!
ETHUSD Ethereum Long and Short Term Outlook from HereETHUSD Long Term/Short Term Price Forecast
Per Adua ad Astra
Long Term
That low at 360 was as big and meaningful as Bitcoin's at
6000. Perfect Gann numbers too. Like, reeaally PERFECT.
Those lows are equivalent of the lows reached in the first
internet cycle when Nasdaq Composite fell from 5136 to 1118,
a decline of 78% in magnitude, playing out in 4 large waves
over 31 months.
For ETH the fall was from 1417 to 360, a decline of 74% - in 3
large waves over less than 3 months, so 10 times the speed of
the Nasdaq/Internet generation1 exactly.
Look what happened to Nasdaq Composite since: now at 7209
- up nearly 7 times over 16 years.
No real reason to figure that the Alt markets will perform any
differently in the longer term. Just 10 times quicker maybe!
And if that's the case it's effectively a buy dips market for the
next 1.6 years or 18 months or so - during which time ETH can
reach 360 x 7 = 2520. Stay long and keep tracking it as it rises.
Time will tell, as always.
Shorter Term
On and on towards the stars - a little local difficulty at 820 in
very near term but it should push higher with Bitcoin still
driving both Northwards but ETH still outperforming
beautifully.
This has already become the key larger market player in the
resurrection we see across the market in general. Could be
Google back in the day...
It should push on to 869 and 896 (900) and later to 978 where
it should spend time consolidating before breaking higher stiill
(add at this point) to 1400 and yes, one day to 2520 too.
Time will tell...never fails.
Here's to ETH. Let's hope it doesn't either.

ICEUS JULY COFFEE : THE MARKET IS PREPARING FOR A MAJOR RALLYBullish diagonal triangle formation + P/O divergence
Be prepared for a significant rally.
Clear close above the upper bound
will confirm it.

Recognizing High Probability in SQRecognizing high probability in HQ. Until we lose this $45 level, the higher probability is still to go long. Hope this video helps show you how to zoom out. When in doubt, zoom out. There's always a trade somewhere that's against the primary trend. This does not mean you should be taking it. Know the difference between patience and aggressiveness. Waiting for a high probability pullback at the right long term areas is patience, shorting the 60 minute because buyers are selling at profit levels is aggressive.
Both can work, both can fail. Hopefully, now you can see a little clearer reason why one can work better than the other over a 3 month period.
Learn more by joining the CTP Group here.
mailchi.mp
Remember. It's your money, it needs to be your plan. Only trade what you've tested and proven out, your account will thank you.

CTSH Bearish Outlook for Approx 50%I found CTSH to have an incline wedge pattern. Significant of a bearish pattern and correlated with the DJI+SPX+NASDAQ. Incline wedge have had good indicators of a large bearish move. Wait for stock to break out of wedge + break support.

EUR/JPY Longer Term Outlook..Respected trend-lines guiding E/J's path into an Elliot Triangle Wave, which would complete its last move. At the very least, a retest of the daily 200 MA and the 38.2 zones marked on the chart.

AUDJPY LONG opportunity ( NOT READY JUST YET)
looking for AUDJPY to pull back to 80.00 - 80.50 these are the areas where we should see the bulls come back in !
TP1 based off my weekly chart at 90.300 was where price got rejected, we have seen price fall for the pas few weeks after hitting tp 1, TL and triple topped that was formed.
will not enter trade until all other indicators lign up

BTC, Time for another yearly correction?Looking at BTC on the weekly timeframe it's starting to look like we're going to make the next yearly correction!
Time will tell!
Thanks for looking!


A deeper look at the EURUSD.
Even though the us dollar is experiencing weakness, There is resistance to be found and pivot points still to be driven to the ground.
The horizontal lines display continuation and reversal points pertaining to Fibonacci re-trace-mint on prior overall greater trends.
There are 3 scenarios.
-Consolidation around these pivot points, Breaking and returning until a direction is decided.
-A bounce off then and continuation into down trend.At which point we could reapply the Fibonacci for the according downward trend, To identify continuation extents.
-The final scenario, is the pivot points are broken at which point we would apply the correct Fibonacci re-trace-mint, to see possible location of it reversal extent.

EURUSD Outlook, With a weak dollar what is to come.The blue line describes a prior median in the trading price, The current trend is showing a consolidation pattern. Once the patter is complete the blue trend line could act as a pivot or support.
