GBPJPY Bullish Possibility GBPJPY bearish movement seems unable to penetrate the strong support. GBPJPY made a base around strong support which indicates the price had big chance turning into a bullish move. A bullish negative divergence is also seen on the Stochastic Indicator. I predict the price will reach the area of 151,570 - 152,217. Because there is a small resistance and the golden ratio of the Fibonacci clusters gathered together in the area of the price range.
Outlook

CADJPY Bullish MovementI predict CADJPY will make another major bullish move, after the price reaches the golden ratio Fibonacci area. You can also see the Bullish Hidden Divergence seen on the stochastic indicator. I predict the price will reach a strong resistance at 91.310

WEEKLY OUTLOOK: 12-6-12-10 EU, AU, &NUI was supposed to drop this yesterday night but I got sleepy I guess. Bearish market ahead. Review of PA over the past few weeks with an update of where the markets are going. Do you agree?

BTCTF: D
BTC is at a crucial level at the this current area. If the current trendlines do not hold some deeper downside will occur. First downside area would be $40k to fill the candle wick from 12/03 & 12/04, if that doesn't hold then price may see $30k again. If price holds above, I think upside movement will occur to around $80k with resistance at $68k.
See my BTC long-term outlook here below.

I the bottom in for BTC USD?Looking at the macro fibonacci level, we still have one level that I think BTC might visit if we see another dump in the price!!!
The last support price that I am looking at is $51900 ish... with +- 2%.
But looking at BTC price has broke the purple downtrend line..
Even though it may not mean that BTC will just pump from here out, if BTC can hold the purple trendline as support and goes above the orange line it currently testing, it would be really2 good for BTC and might indicate that bottom was in!!!
As always, Not financial advice
#NFA
#DYOR

BTCUSD - mid term outlookHello all,
Recently BTCUSD has set a new ATH and now it is trading in a correction.
It has already broken out of the rising wedge like pattern and the short term
structural support. If we take a look at the previous structural ATH (Apr 2021)
then we could forecast the possible endpoint of the correction.
Anyways there are 2 possible scenarios which are illustrated on the graph.
Disclaimer: Any risk related to trading this cryptocurrency is solely on you. Please, think thoroughly before making any trading decision.

EURUSD - long term overviewHello all,
For the past 5 months this major has been falling in a falling wedge pattern.
Now the price is fluctuating at the structural support zone. One can say that
this is obvious bullish reversal, however if we look at the 1D time frame then
the double top pattern is quite clear and the price has already fallen below
the neckline. Thus there are high chances for a bearish continuation.
We need to look at how price will react to the 1.15318-1.15710 structural
support zone. Both possible scenarios are illustrated.
Disclaimer: Any risk related to trading this pair is solely on you. Please, think thoroughly before making a trading decision. Cheers!

Weekly Outlook on EU GU AU Hello there
Weekly outlook on major pairs EU AU and GU
Please press the Like button and comment below.

S&P 500 Outlook by EOY FY21' $SPX - S&P 500 Outlook by EOY 21'
52 Wk Range - $3,233.94 (Low) vs. $4,551.44 (High)
After 7th straight day of gains - due to better than-expected earnings announcements & a new ATH of $4,551.44 on 10/21/21 - I believe the S&P 500 has the potential to reach $5,000 or higher by Jan FY22'

EURUSD 4hJust a snapshot of my HTF markup to follow on from my morning outlook posted earlier, i mainly keep my focus on 15m during session but always aware of the bigger picture.

Bitcoin The Current 4-year Cycle OutlookHere Yearly 4x60 Day step + about 120 Consolidation.
What are market cycles?
A market cycle refers to a pattern or repeating trend that happens within a financial market. A bull market followed by a bear market is an example of a market cycle because it's a pattern that has happened many times in the financial markets. There are many different types of market cycles but bull and bear markets are the most common. The length of market cycles will differ and won't necessarily be the same every time. For example, if there is a bull market that lasts 6 months, the next bull market may only last 4.
What are the stages of a market cycle?
Typically, a market cycle will go through four different stages in order; accumulation, uptrend, distribution, downtrend.
1. Accumulation: The accumulation stage happens after prices have hit a bottom. During this, the price has become more stable and investors begin to buy again - they “accumulate”.
2. Uptrend: Then the markup stage happens, where all the buying during the accumulation stage has started to cause the price to increase. This stage usually indicates the start of a bull market.
3. Distribution: Then the distribution stage happens where the price begins to reach its peak, where people start selling.
4. Downtrend: Finally, the downtrend stage happens, where the price has hit its peak and now starts to fall. This is the start of a bear market.
What is the Bitcoin 4 year cycle?
The Bitcoin 4 year cycle is very similar to the 4 stages of a market cycle, explained above. The four stages of the Bitcoin 4 year cycle are; exponential highs, correction, accumulation, and continuation. Although the Bitcoin cycle starts in a different stage, it still happens in the same order as the stages of a market cycle.

Tesla broke resistance and printing Sign of StrengthConfirming my long position here and waiting for a backup before I add more to my Tesla positions.
As expected price broke out of the resistance channel defined by the AR and the HH points printing SOS and LPS /BU in Phase D before the final markup in Phase E. Low volume and climbing price show that the institutions have taken hold of the price and are not selling until a much bigger markup. Good times ahead of Tesla stocks.
No financial advice, just my reading on the chart through the Wyckoff (re-)accumulation lens.

BBKP After BBKP Breakout from double bottom patern, BBKP do a retest to neckline or Fibonacci retracement 61,8.
i assume that, BBKP can going up again to minimal 660 which is resistance
also macd indicator have a potential to golden cross and going up

EUR/USD is not out of the woods yet Hello everyone, as we all know the market action discounts everything :)
_________________________________Make sure to Like and Follow if you like the idea_________________________________
The EUR/USD pair ended up closing the day in the negative territory Despite the good trading action on Monday and seems to have gone into a consolidation phase around mid-1.1500s on Tuesday.
It looks like the pair is trending in a Falling wedge pattern in a downtrend which usually indicates a reversal into a Bullish state soon but we have 0 confirmation so far. Breaking the pattern will give us the confirmation we need for a reversal.
Possible Scenarios for the market :
Scenario 1 :
The market is trading at 1.15605 at the time of this post, we are expecting a Bearish day today which will probably lead the market to the first support like located at 1.1536 where we will see a small battle between the Bulls and Bears over control which will determine the market movement for the next few days.
Scenario 2 :
The Bears seems to be in total control over the market and with a strong push we might see the pair reach the support located at 1.1496 by the end of the day. The Bulls will have a chance at that level to gain control back and push the market in hope of a breakout. The first target will be the resistance level at 1.1575 and from there they will be headed to the 1.1692 level.
Technical indicators show :
1) The market is below the 10 20 50 100 and 200 MA and EMA (Strong Bearish Signs)
2) The RSI is at 32.82 showing weakness in the market and giving a Sell signal.
3) The MACD is below the 0 line indicating that the market is in a Bearish state, With a negative crossover between the MACD line and the Signal line.
Support & Resistance points :
support Resistance
1) 1.1536 1) 1.1575
2) 1.1523 2) 1.1601
3) 1.1496 3) 1.1615
Fundamental point of view :
The common currency stays on the back foot in the first half of the week as investors can't find a reason to anticipate a reversal of direction.
Commenting on the inflation outlook on Monday, European Central Bank (ECB) chief economist Philip Lane said that they need to be "less trigger happy" and wait for data. "The medium-term inflation dynamic is too slow, not too fast," Lane added and noted that the trigger for monetary policy action is not there.
On Tuesday, October ZEW Survey - Economic Sentiment data for Germany and the eurozone will be featured in the European economic docket.
Even if these surveys point to a modest improvement in economic sentiment, the shared currency could have a tough time attracting investors, who are likely to put more weight on the policy divergence between the ECB and the Fed. Later in the day, the NFIB Business Optimism Index and JOLTS Job Openings data from the US will be looked upon for fresh impetus. However, it wouldn't be surprising to see a muted market reaction ahead of Wednesday's US inflation report and FOMC Minutes. According to FXsteet
This is my personal opinion done with technical analysis of the market price and research online from Fundamental Analysts and News for The Fundamental point of view, not financial advice.
If you have any questions please ask and have a great day !!
Thank you for reading.

How about this prediction for WISH up til mid January 2022?Hope cannot be achieved without imagination! Hoping to get close to the money before my expiree date on 01/21/22. I'd be lying if I didn't say that this would be a nice wish of mine I'm looking forward to, lmfao!

EURUSD outlook for this morningEU was a bit crazy yesterday with reacting off of random levels. We could now start to see it range until NFP. Don’t force anything just let the market show its hand and react.

BTC - Pump and Dump or Pump and Continuation? - Oct 1 2021Last 2 Days BTC has been on a Tear!
After holding the 40 to 41 level (and the long stops) we pumped out dramatically on the 30th.
What appeared to be a potentially bearish enclosing monthly candle ended on September 30th
pumping hard causing general market indecision in what was already an overly bearish month.
This bullish close actually pumped above the summer highs (June and July)
Leading us into nice consolidation above the Weekly Open and an October opening that has been extremely bullish.
Previous Daily Support levels that we gained and retested on the way up were previously lost
and in 24 hours we regained both these levels - 44.4 and 46.8
General Thoughts:
Simply put we need a daily close at this level but preferably higher.
Realistically we have not gained the September 18th high which means we are still set at a perfect
level to swing fail here and turn back down.
However, we also never backtested the high around 52 when we went off that cliff.
This leaves a juicy down wick around 51 that would be a beautiful level to poke at and fail.
Worrying Factors:
The overall volume around this move was quite low yes the leg-up today was more so than expected but overall it was not as high
as would be expected.
Another issue is the DXY which has been absolutely sending right now. This is inversely and albeit loosely
correlated to the general market movement.
Where we are going:
We either swing fail right here and go back down
If 48.8 gets taken out then all those stops are gone and we should go further up to test the high.
And even potentially swing fail that level.
52.8 will be extremely well defended by bears because after that there is literally nothing until 57 to 58
So let us get some high time frame closes here and then gradual and BACKTESTED gains because low volume pumps/dumps,
are not good for a healthy market. I'm still overall very skeptical and more bearish than not
as the Dollar Currency Index (DXY) has been excessively bullish
Personally, I'm not long... yet...

Weekly Watchlist: GBP/JPY - 27/09/2021GBP/JPY currently consolidating at the moment, price creating lower lows and lower highs suggesting we are bearish overall. I have a few ideas on how price may develop as the week goes on:
1) We could see a break and retest below 151.082 suggesting bearish pressure. If this does happen I will only be looking for sells.
2) We could see price come back to retest 151.811 meaning that 151.082 would become a higher low. Whether this level is key or interim depend on if price breaks above 151.811. From there we could see price start to break above setting a bullish directional bias for the market meaning we would only be looking for buys or we could double top and break 151.082 to confirm before selling off.

Weekly Watchlist: GBP/USD - 27/09/2021We did start to see some bullish structure form for GBP/USD however this may just be a deeper pullback from that major sell off. I can see price failed to hold the retest level of 1.36851 and now we are trading below. We have retested this level with a wick rejection and now the last candle of the week closed bearish engulfing the previous candle body. I personally believe we could see this continued sell off down to 1.36097

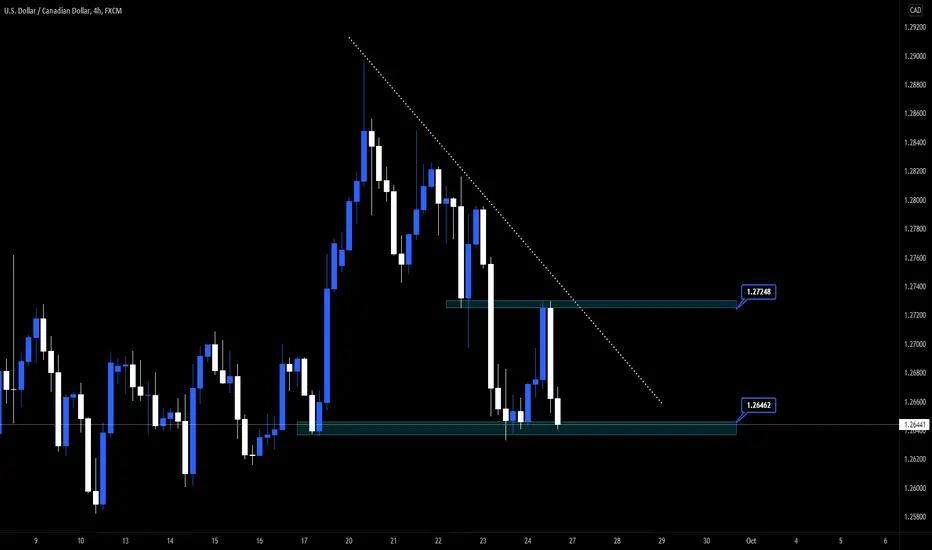
Weekly Watchlist: USD/CAD - 27/09/2021USD/CAD looking overall bearish to me price creating lower lows and lower highs. We have just come into a major level of support around 1.26462 which could cause price to bounce back up to 1.27248 but we will just have to see how the next few hours go from market open. Sells below 1.26462 and buys if support holds.

GU Outlook Outlook on GBPUSD for the upcoming trading week, will build position according to how price action unfolds

BTC Long-termTF: W
I think BTC price action could play out in a few different scenarios over the longer timeframe (1-2 years) outlook.
Scenario 1: BTC is currently approaching a broken level of support around $44,500, this also aligns with the 1.382 extension from the move from $~20k to~$3.1k correction. If this rejection occurs and acts like a ceiling and holds below these current levels, then I think price could visit the ~$17k to ~$21k before pushing it up to 2.0 extension. If price breaks out at that level, then I think price could move to the 2.382 or higher to test the trend line.
Scenario 2: BTC breaks out and breaks through the ATH and holds above (dashed line). I think price could move to the 2.382 extension levels.
