Weekly Market recap 7Elections week rollercoaster
After the last week's wild price action related to the US Elections, DXY erased my expectations about any sort of USD recovery. DXY went from the top of the 3-months range to the bottom (currently testing the grey area). The last line of defence before the downtrend in USD resumes is around 91.75 low (Black horizontal line at the bottom of the range). I will be aggressively bearish on USD when that low is broken down.
Two scenarios
1)Risk assets (see NZDUSD and S&P500) are currently testing or slightly pierced their resistances. So we need a decisive impulse in either direction to have a clearer perspective on the sentiment this week. My bias is on the DXY breakdown and the start of risk-seeking sentiment.
2)If risk sentiment begins, NZDUSD seems to have relative strength, so I'd be considering buying it over other risk currencies. On the other hand, looking at the USDJPY, we can see a long-term descending triangle that had just broken down on November 5. I expect USD to be relatively weak currency among safe-havens. Shorting USD looks like a good idea to me.
Outlook

BTC around the election days (short)short: I expect 3 steps down. Around 13K...12K...11K.
next buy: around 11K with target 16K
ps: no advice...only my opinion.
pps: my bet...trump(f) wins ;-)
Greetz, Nose

GBPJPY HTF OUTLOOK. NOVLooking ahead at this point Nov 1st 2020. General outlook not signals or a trade taken trade. Awaiting confirmations and further daily / 4 Hr structure to form.

Weekly Market recap 6: volatility may take off very soonI believe the first breakout impulse of a new trend in the major assets can start during the next week.
DXY broke out the long-term trendline and held above, closing at the border of the current sideways channel at 94.00 (even a little above it). If on Monday DXY closes confidently above 94.00, I'll be surely bullish on USD and JPY as that may signal the beginning of the new wave of risk aversion sentiment. If instead DXY forms a rejection candle signal, the reversal back into the range is likely.
The major asset classes came to significant price levels
1)Brent broke the important support at 39.00, confirming the short-term uptrend (started at the end of April) reversal according to the trend structure.
2)Although S&P500 hasn't broken September low yet, it's consolidating under MA(100), that adds to my bearish bias on stocks.
3)Gold is also testing its major support level.
Possible scenarios
Whatever asset you look at, the full-body candle in either direction will tell us a lot at this point. We either enter into a volatile trending market (in case of DXY being above 94.00) or a possible short-term trend of medium volatility in the opposite direction.
The market may be pricing in the upcoming United States Presidential election on November 3. The election result can be a catalyst for a new trend across the board.

GOLD: Bears Will Push LowerGOLD reached a strong supply zone.
Based on our outlook the price will drop.
Like, comment and subscribe to our TradingView Page.

AUDUSD Wick rejections could be a sign for a buy?Can price finally find support around 0.7160? Though this pair is in a global uptrend, it is important to note that its current behavior and direction has been to the downside since the start of this trading week as is evident in the making of lower highs and lower lows. Needless to say, traders with a bullish bias has been waiting for price to find support at various areas along this week's downtrend path to get in on a buy but clearly, sellers are not done flexing their muscles yet as they have managed to push price lower and lower. Multiple wick rejections around the 0.7160 area could signify that much needed support for buyers to take control of the direction of this pair and bring back a continuation to the up side. Considering that price has respected key area between 0.7207 and 0.7193 as resistance several times in recent history, a global trend reversal could be cooking but this is not an exact confirmation yet.

EURUSD H2 #OUTLOOk For 21 To 25 SeptemberDear Traders Today We Have an Analysis Of EURUSD H2. This Analysis Based On Price Action Theory.
According to The Analysis, We Can See That Market On Down Trend which we can see with the help of Trendline there are so many rejections happen & market keep moving to downwards. As well as we have an extremely good support level @1.17556
There is 3 resistance level 1st is
@1.18633, 2nd is @1.19007 & 3rd is @1.19463.
On the 1st Resistance prices already refuted on the last Friday.
I Request to All Before The Trade You Also Match You're Analysis With As If You're Set up Match Then You Can Trade.
Thanks
Regard
Enclavefx technical group

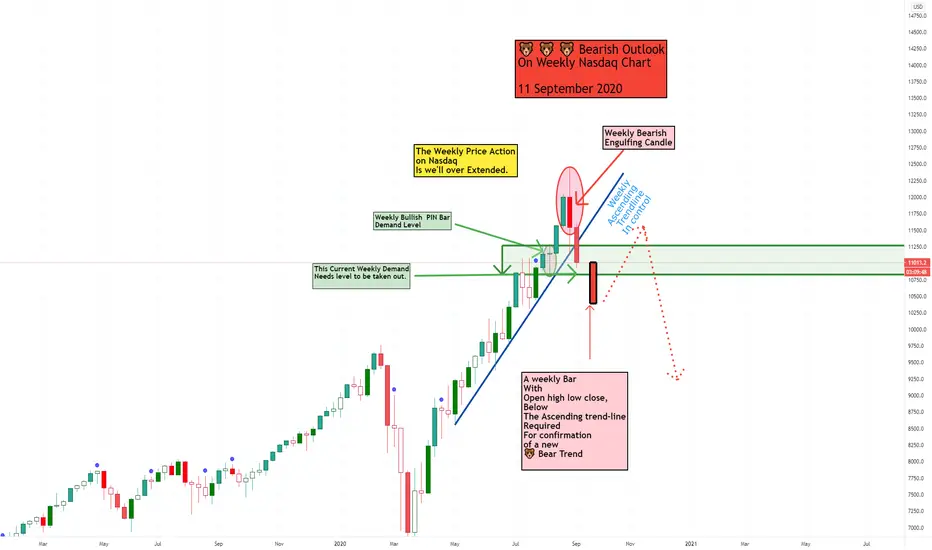
🐻 🐻 🐻 Bearish Outlook On Weekly Nasdaq Chart 11 September 20🐻 🐻 🐻 Bearish Outlook
On Weekly Nasdaq Chart
11 September 2020
GBPJPY OUTLOOKGBPJPY OUTLOOK: Price has struggled in the past week to move much higher. Previous highs have been broken however consolidation has taken place after bad news for the GBP and JPY. The end of the week saw price fall back down to the strong uptrend line and we will soon see whether price breaks below the line and reverses or once again bounces and moves higher towards the long term downtrend price arond 142.00

EURUSD OUTLOOKEURUSD OUTLOOK: Price is in a longer term uptrend, a smaller flag pattern has formed which price has attempted and failed to break out of. A clear confirmation of a solid breakout will tell which way price will continue from here. USD has been very weak and if we see its strength return then we can see the EURUSD move much further to the downside.

CHFJPY Short from Institutional SupplyHi traders,
I am currently short CHFJPY after the rejection on the 4-hour timeframe from the supply zone.
Best,
Don Deesker

bitcoin ready to push up from 11750 I am expecting a buy from this region to the the other end of the rising channel.
Goodluck

Weekly Market recap 1Ok, boring first, as I suspected it would be quite a calm week for USD as it ought to digest its previous downtrend move. The USD has been staying in the range without any hints of what direction the breakout would occur in. So let's wait and see what happens the upcoming week. If there are some decisive moves towards the range boundaries, we can devise a plan accordingly. I would be more prone to consider shorting USD in general, towards the previous trend.
Gold has finally made a decent correction after the surge to the new all-time highs. Notice, that the level 1900, which is the high of September 2011, now became the mirror support. That's a good sign of the healthy bullish trend. This week it'd be nice to look for some bullish reversal setups based on the rebound from 1900 level and trend continuation setups afterwards. I'm not much into fundamentals, although I find a solid reason to stay long on Gold in the mid-long term as the interest rates will most likely remain very low for a while, and printing money continues in the US and Europe.
Now, let's look at something more dynamic. My main focus in the upcoming week would be on the strength of the European currencies (EUR, CHF and GBP). Their indexes are all in a strong uptrend with some minor divergencies. The kicker here is to timely decipher which currency of the three has the most obvious relative strength. First of all, I chose not to display GBPCHF, as to me that's a symmetrical triangle formed in a multi-year range, - fairly neutral condition to have a bias in any direction.
EURCHF has drawn my attention since the middle of May 2020, as it started to show aggressive signs of the long-term downtrend reversal. Although the pair seems to tighten to 1.0740, gradually, I see this pair going up in the mid-term . Therefore I'm long EUR here overall.
EURGBP is consolidating near the upper band of the local range around 0.9050. That recent price action tells me EUR might be stronger at least in the short-term .
And here is the highlight - AUDNZD . The pair has broken the long-term trendline started in October 2017, and confidently advances further. Australia, as the second Gold producing country in the world, should correlate with the price of Gold somehow. We can see a positive correlation of the AUDNZD with Gold since the middle of July. Last week Gold has corrected the strong upside move, but AUDNZD remained strong. That tells about the relative strength of AUD . I'll be looking for the trend continuations setups in AUDNZD in particular as NZD seems weak against European currencies too.
That's it for now. I'd be curious to know your opinions about other fundamentals that drive the discussed currencies:)

GBPJPY GBPJPY OUTLOOK. Price has broken out of the bullish channel and retested twice however it is struggling to break away due to a big area of resistance. If price bounces off the second retest and breaks resistance we can see price continuing up to the long term downtrend and 200ma at 142.


EURUSD Possible Inverted Cup and HandleA very likely scenario if we take into consideration that price broke the parallel channel to the downside for the second time now, but this time the probability of the downtrend continuing is very likely.

USDJPY outlookUSDJPY seems to be consolidating, with bigger retracements. Will continue to monitor PA to confirm reversal.

My Setups for Week of 7/26DXY is still falling like it can't get back up so I am still short on USDXXX pairs and long on XXXUSD. I would like to see pull backs on the 4H but it is looking like 1H pullbacks are all we are getting this week if the DXY continues it's momentum. First week of FTMO challenge. Wish me luck!

EUR/JPY WEEKLY OUTLOOK.At this moment in time, I am looking for sells simply because the setups look kinda thicc.
However, I will not be surprised if price moves higher to conform to monthly resistance.

US500. Long-term outlook. Bullish.There is a strong level at 3200 which was a resistance level in the past, and now it's a support level. At this point, the economy of the US looks much better then any other coountry in a world. That's the reason that makes S&P index looking bullish in a longterm. Therefore, it's a good level to open long positions with take at around 3330. Of cource, the the ascent will not be easy, but we'll see it in anyway!)
Good Luck!
Do not forget about Stop Losses!!!

GOLD ON 1HR the bulls are still holding the highest momentum on Gold, but I am expecting a little retracement before the resumption of the bulls.
Trade carefully.
Goodluck

GBPUSD OutlookThe beginning of July hasn't been a good one for the dollar as Covid-19 cases spiked around the US causing the dollar to weaken. Approaching 1.26600 prices has met resistance and has been stuck in a range for about a week. We see price making lower highs and lower lows and as Covid-19 fears begin to wane and the DXY showing bullish potential, I am looking for this pair to breakout and drop to 1.22650 Support zone.

AlphaOverBeta Market OutlookMarket Outlook 22.06.2020
The S&P 500 moved up 1.9% this week, recovering some losses from the last week. The Nasdaq Composite moved higher with a 3.7% gain.
Eight of the 11 S&P 500 sectors finished the week in positive territory.
Health care +3.1%
Information technology +2.8%
Consumer staples +2.4%,
Consumer discretionary +2.3%
On the downside
Utilities -2.4%
Energy -1.0%
Real estate -0.8%
Investors are still in the "Buy the dip" mentality after the major recovery from the bottom mad in March this year, and confirmations made by the Fed announcing on Monday that it will start buying individual corporate bonds through its Secondary Market Corporate Credit Facility.
AlphOverBeta Next Week Forecast
We predict the market is going to continue to be high volatility range trading in the coming days and weeks, the economy is not going well enough to sustain a major rally, BUT the fed and government is going to continue to pump liquidity into the markets and that alone that should support the current price levels. The market traders are not clear on the next market move as they were in previous weeks and this creates elevated levels of volatility.
We see the next key level as 3000, and then 2800.
Trade Smartly,
Alon, AlphaOverBeta
