Sell Signal On Bitcoin Yes, But Short? No Way.#Bitcoin order flow has produced a bearish outside bar within the low 9K region which is a minor resistance area. This can be interpreted as a sell signal, especially if followed by an inside bar over the next day or two. In this analysis, I am going to cover HOW we interpret this kind of price action relative to our LONG only swing trade strategy. My objective is to help the community better understand how order flow works and recognize potential opportunities that are regularly overlooked by the herd.
1. The low 9K area is a minor resistance relative to the bearish price structure established by the 10,300 high to 6550 low. It is within reason to expect some selling pressure to unfold and is precisely why we placed our third target at 9250 (which we missed by 50 pts).
2. Relative to OUR strategy, the current bearish outside bar is a sell signal which for us is a prompt to lock in profits, NOT to go SHORT. Since we are a strong hand, and have reduced our original position by 2/3's up to this point, we will opt to stay in our swing trade long and ride out the noise. Sell signals carry much less weight on the time frame that we follow in a BULLISH momentum environment. Momentum and trend are two SEPARATE and distinct variables.
3. IF the 8500 support area is compromised, 8130 is the next support where we will anticipate a bullish reversal pattern. IF 8K is decisively taken out, then the 7200 area is the next respective level to watch for reversals. Even though recent momentum has been bullish, that does NOT mean we are in a strong trend on THIS time frame. That is why we continue to operate within the limited expectations of a RANGE BOUND market (which means we expect lots of fake outs, limited movements and set more conservative targets).
It can be argued that the 9200 area is another "lower high" which will attract lots of small time frame bears who do not know how to weight the recent order flow developments. More bears are good because in order to make a market, someone has to be willing to take the other side of the trade. These are the participants who will help price squeeze into the high 9Ks when they are forced to cover. IF price takes out 10,300 then a strong argument can be made for the broader Wave 3 being in play (which can lead price to 14K and higher over the coming months).
Outsidebar

A New Pitchfork - Buy Zone @ $175I'm dollar cost average accumulating this but also looking to get heavier on it at the expected halfback of the outside bar on the edge of the pitchfork, around $175.
Eth is good for intraday trading but my main focus on it now is to get a good size of my portfolio loaded up at a good average and hold for the next bull cycle. I think the old high at $1400 is probably attainable and $1000 is very realistic.

Outside Bar Reversal At Pitchfork EdgeI'm very bullish on bnb, have been accumulating it long and trading long intraday.
It recently made an outside bar reversal pattern near a pitchfork edge which is becoming one of my main go-to setups for defining intraday bias.
BNB is the kind of thing that will be useful to traders even if the market is going down because it provides a discount on trading fees.
So I like it for the same reason as eth, in that eth is useful even when the crypto market is going down since many USD-based stable coins are built on eth. When people bail out of cryptos into stable coins they generate demand for eth.
I'm dollar cost averaging this and will probably end up with a position mainly in eth with another position about half that size in bnb. Intend to scale out near the major pitchfork median line.

A Tale Of Two Rejection AreasBTC formed a bullish rejection pattern across 4 day candles, shown by the green box. If you imagine a single candle starting at the start of the green box, then it would have a very long tail rejecting the downside test.
It then formed a bearish rejection pattern shown by the red box.
It's now consolidating and I'm expecting it to form a bullish pennant shape with support around the 8800 region philakone had mentioned a while back.
I think the rejection of the bearish thrust is much stronger than the more recent rejection of the bullish thrust.
I definitely have a bullish bias intraday on cryptos and also am accumulating them for the longer term.
These large outside candle patterns have been one of the most consistent market turning points for me when identifying when to start scaling into longer term positions.

Bullish 2 Day Outside Bar PatternThese large range 2 and 3 day reversals are always good to consider. The bears may have gotten over extended here and it could reverse back up into the prior range over the next few days.
I am currently long LTC and planning on selling most or all at the end of the day but this could be something that runs an additional day or two while the bears cover their shorts.
This is near the edge of pitchfork so I am not looking for any major bullish swing or long term position. It's more of a technical bounce than a structural support level that can be used for building a large position.

1st Outside Green Trend Bar In Over 3 MonthsToday was the 1st outside engulfing green trend day bar since June 10.
There have been outside green engulfing candles since then but they have all been very wicky, this was the first very full bodied trend bar.
Last time it happened it made a nonstop run to a somewhat major high from about 8k to 14k within about two weeks.
So I am seriously considering swing trading bullishly against the overall down trend with a target at Philakone's 8800 level.
Today I daytraded long and kept half my position open for an overnight mini swing. I am considering adding to that position at least until it gets to the other side of the pitchfork.
I am not so bullish that I think it will shoot straight to 20k from here. I especially will become very bearish if it gets into the 9300 region where it is likely to stall out and reverse.

Buy GBP/USD double bottom till 1.2700When we see a orange outside bar, we will make definetly make a higher bar for next month.
There is a rejection at 1.2700, after this there will make a lower bar.
Buy till 1.2700 first and after in the long term it can go to around 1.3000.
Have a nice trading mont.
Greetings
Hola

Buy setup emergingWe got a few confluencing factors coming into play on this pair that looks to be setting the auzzie up to gain some ground against the dollar.
Check out the double bottom play on H4 that can be used as an entry IF the move plays out. The outside bar that is busy forming is reinforcing the bulls presence...
Don't invest what you can't afford to lose. This is not investment advice. Subjective view/report of a financial product only.
You can learn price action trading at no cost. Join my mailing list to receive more information zc.vg
Join me in Forex Bootcamp for live updates using the link below.
DISCLAIMER
All information published within this website is purely for educational purposes and offers no guarantees. Profit Fx, Forex Bootcamp and any of its associates cannot be held responsible for any trades that you have executed in any way whatsoever. Please familiarize yourself with the relevant risks involved when trading forex, CFD’s and other products. Any trading is done solely at your own risk. Profit Fx, Forex Bootcamp and any of its associates are in no way employed by any broker or any other legal entity. All information published within this website does not constitute advice, but rather objective information about a financial product and analysis or report of a financial product.

A Bullish Outside Bar Pattern Likely Change the Long Term MomentA Confluence of Bullish Outside Bar Candlestick Pattern and a Significant Support Zone
GBP/USD has formed a bullish outside bar candlestick pattern in the H4 time frame.
We can see in the H4 chart how the last big green candle in the picture attached engulfed the previous four candles and closed at the highest.
If we look at the high time frames charts (W1 or D1), we can see that the price is bearish in the last one and a half years, since April 2018.
At the moment, the price just arrived into the support zone which originally was a demand that formed in April 2017.
The confluence of the bullish outside bar candlestick pattern and the significant support is a very powerful one.
It creates a great opportunity for buy position.
Below, there is a fresh demand created earlier today.
If the price retraces this demand, it will be the right time to open a buy position for GBP/USD.
The resistance above will be the first target for this position.
The source of this resistance is a supply level which formed on 04/07/2019.
After the price tested this supply three times it became a resistance zone.
The final target for this trade will be the fresh supply at the top.
The supply at the top is a very significant one, if the price will break this supply it means that the long term momentum has changed from bearish to bullish.

USD/CHF Controlled by Sellers and Below Annual OpenA confluence of Fresh Supply and Fibonacci 61.8% in USD/CHF.
Two weeks ago, seen in the W1 chart, the USD/CHF weekly candle had ended as a bearish engulfing pattern. The big red candlestick shows this bearish engulfment.
This pattern was a continuation outside bar candlestick pattern. It shows how the big red candle engulfed the one before and it also shows how significant the strength and determination of the bears were with the USD/CHF price.
Referring to the 1W or 1M charts, technically, the USD/CHF is bearish. and if we would like to sit with the dominant side, then we should look for a sell position.
In the 4H chart, we can see a very reliable setup for a sell position. A confluence of fresh supply and Fibonacci 61.8% of the recent downtrend.
In addition, on the 1W chart, we have a bearish outside bar pattern, that pattern with the confluence of fresh supply and Fibonacci 61.8% gives us enough signals to look for a sell position.

Three Reasons to Believe GBP/USD Remains BearishGBP/USD Price is Established Below The Annual Open Price
A few weeks ago, the GBP/USD price fell below the annual opening price, which became a significant resistance zone.
Since the after three unsuccessful attempts to breakout this resistance. The price reattempted to break the resistance against two days ago (25th June 2019). This time the daily candle ended as a bearish outside bar candlestick pattern, by engulfing the candle of the day before. This candlestick pattern is the first signal to look for a sell position.
In the 1H chart, there are two more signals to look for a sell position on GBP/USD.
The substantial divergence between the price and the MACD indicator – while the price creates higher highs on its way to reaching the resistance, the MACD creates lower highs.
When the price hit the resistance, then dropped down and created the outside bar pattern, it also creates a fresh supply, which is the right level to open a sell position if the price retraces there.
The three reasons that we think the GBP/USD remains bearish is because of the confluence of – bearish outside bar pattern, fresh supply, and the MACD divergence which create a reliable and strong setup for the sell position.
In the 1W and 1D charts, it seems that the price will remain bearish until it reaches the 1.2150 zone, which is a support zone.
Therefore, this support zone will be the target of this sell position.
This analysis is relevant for swing forex traders.

A Bearish Outside Bar Candlestick In 1D Chart On EURUSDOn the 1D chart, the previous day’s candle has ended as an outside bar candlestick pattern, which is a reversal pattern.
We can see how this candle was engulfed the day before. The height of the outside bar was higher than the height of the previous day. and the low of the outside
Bar was lower than the previous day’s low. Since it’s a bearish outside bar, we should look for a sell position.
In the 15M chart, there is a great supply above which is also the top of the outside bar candlestick. If the price retraces toward the supply – it will be a great opportunity for sell position.
The first target for this position will be the support below at 1.1130 zones, and the final target will be at 1.0750 zones.

SP500 is going LOWER!Sp500 dropped significantly last in the last 4 weeks losing almost 10% from the historical high.
It is pretty interesting to see what is gonna happen in next few weeks. The index has taken out the master TL + we are 1000pips below 200 EMA + we have got possible HUGE monthly OB with beautiful bearish div that is HUGE signal for a possible bearish market to begin.
TA is showing us back to Master TL and retest so we expect market to drop lower.
If FED invisible hand does not react quickly market will finally correct to its fair value.

Short TradeUpon false breakout (Hikkake) signal in 1h chart (not shown), I have loaded up my short position. Bullish momentum is still here, a bit risky. Outside Bar two candles ago (see red labeldown, ongoing upward trend and falling down out of the price channel make me confident that it will play out well.
Stop Loss and target gain are shown (Reward/Risk ratio =1.1).

Nasdaq chart ahead of FOMC Bearish signs for the Nasdaq but the price is still above support.
FOMC is next

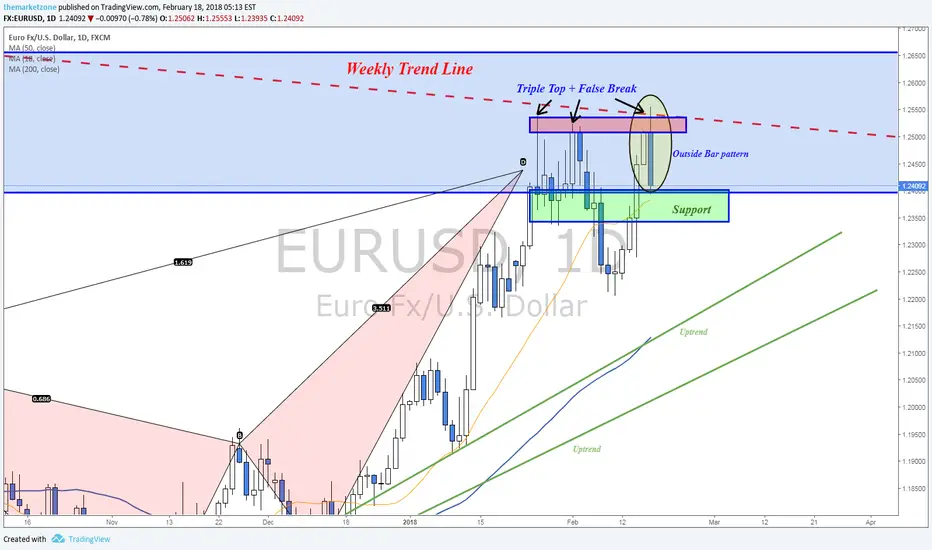
Outside Bar pattern EURUSD was rejected by a weekly resistance zone last week (structure, trend line, harmonic pattern)
The resistance zone and the triple top pattern sent EURUSD down - Forming Outside Bar pattern that will be in focus this week.
EURUSD will have to break the support zone to continue lower
BTCUSD: Outside Bar Offers Hint Of Bullish Reversal To 15K?BTCUSD update: Outside bar like candle forms within the 10988 to 8656 support zone, and more specifically bounces off the 9683 lower boundary of the reversal zone. Just like in the other markets, this is a place to be looking for longs for swing and position trades.
Funny how people criticize and ridicule TA, meanwhile levels that I have projected weeks ago are providing very reliable reference points. The 10988 to 8656 support zone is the .618 area relevant to the recent bullish structure. It is a high probability area for bullish reversals and now that price has retested it, the herd is reacting as anticipated (what happened to 30K?). The outside bar that is in place at the moment is a good start. It means that there is some evidence of buyers in this area.
The other notable level is the 9683 boundary of the reversal zone measured from the 10700 previous low. This zone between 10700 and 9683 presents and area where IF a bullish reversal is going to happen, this would be the area with the most probability. This zone is one that I like to refer to as the "fake out" zone and works the same way at peaks. It is based on the same concept as the false break out. The majority of participants get out or get short and there is no one left to keep the momentum going. There is no guarantee that price will reverse back up dramatically from here, but it is an area to evaluate risk from and consider longs for both swing and position trades.
A swing trade time horizon can be from days to weeks while a position trade can be from weeks to months. The particular level is attractive for both because of the larger magnitude of the correction which translates into a broader move higher ones price can prove stability.
I will be looking for stability in the form of chart formations that will take some time to unfold. The bullish outside bar is only a preliminary sign and price can still retest the 9683 low or slightly lower before reversing. Any failed low or smaller magnitude higher low would be a good sign for longs within this area. The first resistance break to also watch for is the old support/new resistance now at the 11700 level which price is clearly reacting to at the moment. A break back above would signal bullish momentum is back.
As far as my trades, I have a position trade long from 13150 that I entered weeks ago and have no intention of selling. I am also looking to add more to that position around these levels and to add a swing trade as well when a clear structure unfolds that I can measure risk from. In terms of reasonable targets, the 14211 to 15252 resistance zone is the reference point that I am using at the moment.
In summary, for now BTC is still the main currency in this space and until it no longer has merit, buying supports in the midst of broader corrections is still a good idea in my opinion. Also as much as people keep hyping or dramatizing lower prices, this market is not in a broader bearish trend. We are just within a normal correction of a larger magnitude which shakes out the less experienced because they are too focused on the noise, hype and drama. This is nothing unusual and is necessary for a healthy market to continue. Any retest of lower prices, and I will be looking to add to longs. Also it doesn't hurt to start small positions in an area like this as well without the use of margin. In these markets, anything can happen, no matter what a chart looks like, but most of the time general probabilities of levels and price structure offer adequate guidelines for managing risk and taking positions more in line with market intentions and this is one of the reasons why TA is so valuable.
Questions ans comments welcome.

BTCUSD Perspecitve And Levels: The Outside Bar Bearish Reversal.BTCUSD Update: Higher low established at the 6900 area followed by a new upswing that has just spiked to 7900 and formed an outside bar. This is the Wave 5 of 5 that I have been writing about that may have exhausted its potential going into the fork over the next 8 days. Once the incentive is over, the environment will be setup for the beginning of a much larger correction. Especially now that an outside bar is present.
I like to describe Elliott Wave as a "road map" that gives us an idea of where we are within a trend. This information helps us to form realistic expectations about what is possible in the near future. (This is why I never paint rockets). Once I can confirm a count of 5 waves within Wave 5, I know that the next wave is most likely going to be a more serious correction because often the market goes into Wave A (the first leg of a corrective series).
That is the more straight forward part of using Elliott Wave, but it becomes more challenging when you are trying to figure out how deep the correction can go. That is called the magnitude of the wave. The reason why I am saying that once this 5 of 5 completes, this market is in position for a deep correction is because if you look at this market on a weekly chart, you will see that this entire rally coming from 150 per coin, will be completing 5 large degree waves. The chances of a large magnitude Wave A (aka deep correction) are very likely in this section of the "road map". You can think of this entire structure as a giant Wave 1, and we are about to go into a giant Wave 2 which THEORETICALLY can retest levels below 1k (this can take weeks or months).
Now that 7900 has been touched and the market immediately sold back to 6977 within hours is a very bearish sign. Outside bars are considered reversal patterns and for this one to appear at these levels within a Wave 5 of 5 adds to the argument significantly and can begin selling off even before the actual Segwit2X (Buy rumor, sell news). Not only is this price action showing an outside bar, but on larger time frames it appears as a pin bar. A break below today's low and we are in for selling of a larger magnitude.
Isn't 7900 is a new high? It is only 300 points higher than the previous high of 7600 which relative to this market is not that much higher. This can be interpreted as a failed high or double top variation and again another reason not only to avoid longs on the swing trade time frame, but also to expect a deeper correction soon. If price breaks below the outside bar, I will NOT be looking for any buying opportunities at the upcoming supports because I expect them to break. A decline to 6750 area will further confirm the initial leg of an A Wave which can be followed be a B Wave (bullish swing, lower high) going into the fork. After that, if this market has not broken higher (beyond 8k), and these current highs are still intact,it will be reasonable to expect a retest of the 6k level or lower in the following weeks.
In summary this market is now in position to sell off on a much larger degree. Being in a Wave 5 of 5 along with a blow off top (outside bar) and volume spike, (40k coins vs 10k average) in 4 hours are all bearish reversal signs. There will be plenty of smaller time frame retraces worth 100+ points which again is a day traders market. As far as swing trades go, I am now avoiding all together. Along with this bearish spike, the alts got a bullish spike which may also translate into a bullish reversal that may continue as BTC money stampedes for the exits. If YOU short these markets, now is the time to look for opportunities since structure is now in place. I will not be too surprised if the market begins to sell sooner than the fork, with a lower high forming into the fork day and then failing. Remember I am just estimating based on price structure, as long as price keeps generating bearish signals, I will be staying away from this market.
Comments and questions welcome.

GOLD with potential shorts? Under important resistance zoneWhen looking at the XAU/USD (GOLD) daily chart we can see that, price stopped below February’s highs near 1263.50USD per ounce. The resistance zone is strengthen by the 61,8% Fibo retracement (November-December 2016 depreciation after the US presidential elections). Last time 1263.50 pushed the price more than 60USD lower. We should wait for Price Action signal (currently market is drawing outside bar formation) and then open a short position targeting lows from this month and then the March dips.

Coffee Triple BottomTriple bottom forming on 61.8% retracement which is a good support area.
Expecting price to break out of the triangle and target the 165 area.

GBPCHF SellFX:GBPCHF in bearish trend.
D1
-Correction to the round level(1.25000)
-Outside-Bar
-Rejection area around 50 and 61,8% Fibo
H4
-Breakout of the triangle pattern

EURAUD SellFX:EURAUD in bearish trend
W1
Triangle pattern
D1
Correction to the round level(1.45000), which is matches to the 38.2% Fibo
Outside Bar
H4
PinBar
P.S. Sorry for my bad English :)

GBPCAD Price action short signalThe pair is currently in a consolidation box just below pivot point and exactly at 50% of the box. We got strong longer term down trend, double high and nice outside bar.
I entered the short on outside bar low break and set initial SL just above outside bar high. If you've seen my older trades you will know, that my SLs are dynamic and I adjust them every day - trying to set break even as soon as the price establishes strong position under important levels.
As you can see, outside bar closed just below previous support level and at monthly pivot point. I'll use this points for my future SLs.
First target is obvious bottom of the box.
