Shark Completed On Daily TF NZDJPY - Shark completed on a previous daily OB, this is a strong reversal zone. Price is also breaking structure on the LTF and theres a lot of imbalance to fill below! Plus the JXY is dropping.
I will wait for more LTF confirmation to enter this trade though!
Whats your thoughts?
Overbought

Daily Shark Complete & Liquidity Wiped out!GBPYJPY - Daily Shark Completed, looking for a pullback now, price has broken the daily supply zone and just cleaned out a strong OB from February clearing out all liquidity from then until now, I'm waiting for signs of reversal, JPY is also sitting on strong weekly support so I'm expecting JPY currency index to rise.
Whats your thoughts?

Ascending Triangle Forming- BullishBig Ascending triangle forming on MSFT here- EMA's are starting to curl upwards as well as buyers have maintained control for quite a while now. RSI is nearing the overbought level, just something to be aware of and keep an eye on, however, will be watching this one closely especially with earnings coming up on 10/27' - Just some support and resistance levels and some RSI-based supply and demand zones to keep an eye on- Bullish

My Plan for SHIBThis double top reversal pattern and breakout of support may could lead SHIB to a dump
And Jack Dorsey keeping people up SHIB shorting (He doesn't like SHIB)
Be careful
Not a financial advise , just my idea .

RTY Going OverboughtOversold > Overbought > ?Oversold again?! Probly will hit the R line at 2270 Friday IMO. Buying panic. V-shape, who knew?!
No position yet, lost enough second-guessing this move already. Sheesh!

ES at 0.62 Fibo: Lower Soon?!Note the consolidation zones along the S/R line reaching back coincide with the Fibo retracement 0.618 level; bull/bear battle zones, likely rejection zone. Overbought condition, indicators pegged, but can always squeak higher ofc.
A move lower is likely imminent, Whether it proves to be a higher low and price returns to lofty valuation, or a real correction, TBD.
Thursday's nutty wild bull price action feels like a blowoff top, confirm it Friday IMO.
Fade the Gap didn't play on 9/23, perhaps it will 9/24? Looks like a Pumpndump forming atm.
Watch for short covering in Power Hour Friday!
Trade with caution! GLTA!

GBP-JPY Resistance Reached! Sell!
Hello,Traders!
GBP-JPY has finally reached a falling resistance
Just as I predicted before in my previous analysis
And I think that there is a good chance
To see at least a local pullback from the level
As the pair has been going up for quite some time now
And it clearly looks locally overbought to me
Sell!
Like, comment and subscribe to boost your trading!
See other ideas below too!

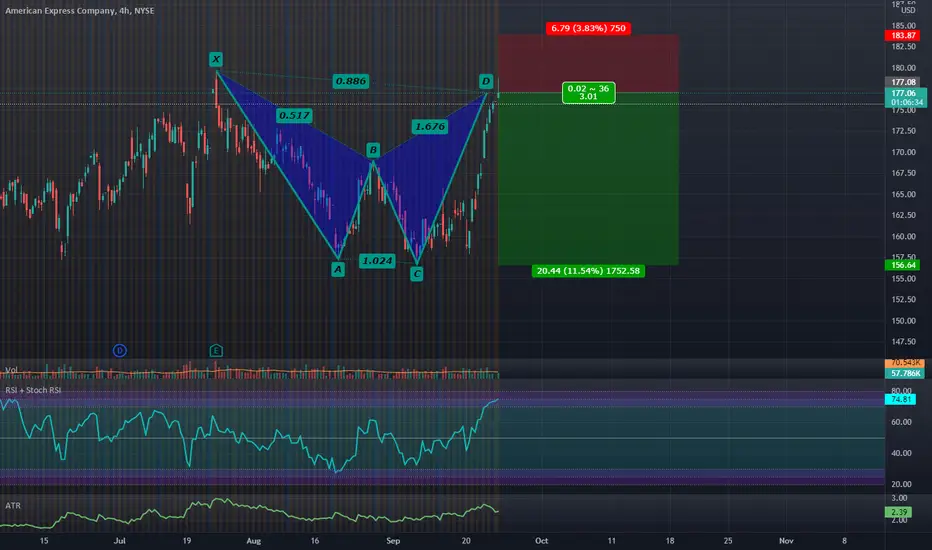
4 Hour RSI Overbought at PCZ Of Bearish SharkI have my stop above the 1.13 fib extension and will be looking to buy reasonably striked puts expiring around November and December
HLI to take a breather?Based on historical movement, the peak could occur anywhere in the larger red box. The final targets are in the green boxes. The pending bottom should occur within the larger green box as has been the historical case. Half of all movement has ended in the smaller green box. In this instance, the signal indicated SELL on September 24, 2021 with a closing price of 95.39.
If this instance is successful, that means the stock should decline to at least 94.85 which is the top of the larger green box. Three-quarters of all successful signals have the stock decline 2.084% from the signal closing price. This percentage is the top of the smaller green box. Half of all successful signals have the stock decline 3.597% which is the end point of the black dotted arrow. One-quarter of all successful signals have the stock decline 6.123% from the signal closing price which is the bottom of the smaller green box. The maximum decline on record would see a move to the bottom of the larger green box. These are the same concepts for the levels in the red boxes as well.
The ends/vertical sides of the boxes are determined in a similar fashion. The trough of the decline can occur as soon as the next trading bar after signal close, while the max decline occurs within the limit of study at 40 trading bars after the signal. A 0.5% decline must occur over the next 40 trading bars in order to be considered a success. Three-quarters of successful movement occur after at least 12 trading bars; half occur within 31 trading bars, and one-quarter require at least 38 trading bars.
The black dotted arrow represents median historical movement. Medians are a good metric, but they are just one of many I use when forecasting future movement.
As always, the stock could decline the very next bar after the signal without looking back (therefore the red boxes would not come into play) or the stock may never decline (and the green boxes may never come into play).

H1-H4 USD/JPY SHORT USD/JPY have a strong upward move. Now it is reaching a resistance. Looking for a correction to 110.30 price range by Monday-Tuesday.
Not a trading advice.
Trade wisely.

RTY in (v) of (III), in sell zoneChart says all. Sell in the band between S/R. not advice, just an idea; GLTA!

SPY- Potential reversal & key levels to watchThe SPY closed on Friday finally breaking below the channel that it's been holding for quite some time now, and closed sitting on the 50-day SMA. Every time we've previously touched the top channel line, the SPY has fallen to the bottom channel line and bounced right off (see charts below). However, there is a very clear shift in seller volume starting to outweigh buyers, and RSI taking a steep drop EOD on Friday after hovering in overbought territory for quite some time as well. Just some FIB levels and RSI-based supply and demand zones to keep an eye on- personally bearish here as the markets have been way overextended for a long time now in my opinion. Trade safe, and look for potential long-term entries on fundamentally sound stocks.

Solana Attempting To Breakdown Through A Point Of ContentionThe zone i have highlighted on the chat is the range between the top and bottom of a high volume daily doji and we're overbought on the weekly showing bearish divergence on the RSI while on the daily RSI we are breaking down after being overbought; If we break below the zone i have highlighted then i expect to see a huge move down to the moving averages.

$SPY ~ Why A Crash Won't Surprise MeFirstly: This is not a prediction.
I just say what I see. And what I see is, a tentative market top that looks different than all the previous "tops" this year, including the 2020 crash.
I will put "top" in quotes because of course, I cannot be sure that is indeed a top until after the fact; obviously.
What's different about this "top"? My labelled chart tells all, but in summary:
There are very few or very small gaps. A clear gap almost always represents a "shock" in the system. A fall with virtually no gaps, in my view, means a structured, calm, almost rational fall.
There is a cluster of red candles meaning this indeed "methodical" selling, also relating to the fact that there are no big gaps
Take a look at the 2020 crash, and all mini tops this year (2021). You'll see nothing but choppiness and gaps. Panicking, in other words.
Take a look at the 2008 crash:
As you can see, virtually no gaps near the top. A structured, "rational" fall, later ending up in a recession.
I'm not saying a crash will happen, obviously. But I would not be surprised, and I just say what I see.
And what I see is, a "top" that looks different from everything recently before it.
Side Note:
It also looks the "Smart Money Index" has been on a consistent downtrend since 2018.
I don't think this is my strongest point, so I left as a mere side note. Make of it what you will.

Over Extended Dark Cloud CoverI will be looking for an annihilation of the bullish trend from here as this looks like a buying climax to me.

JNJ: BUY THE DIPJNJ: an amazing long opportunity
~Every time JNJ has gone overbought on the RSI like it is right now, it has gone up very strongly
~JNJ is trading in a parallel uptrend for the most part since October 2020 (white area) with a few minor outlying price action movements.
^^ Price is touching the long term support line. Confirming the RSI foreshadowing.
~I expect resistance at 171, 174-176, 180.
^^Breaking 180 will let it soar to 185-187 (the top of the parallel uptrend)

2% Seems To Be The Precursor... $SPY🕵🏾♂️Since May 2021... the $SPY has had 5 (five) 2% dips that have corrected. During the last run up prior to this 18mo push, the $SPY dipped 3 times before taking the big dip. Granted the last move was a shorter time period, so I would think that the fact that it has more dips can be seen in correlation to its length. Prepare for a correction soon. In my head I'm thinking we can see a 5%-12% dip in the coming weeks... if not days... unless Uncle Sam continues to play this printing game things could get ugly for a lot of portfolios....


SPX Ending 3W Brief Correction to Blow-off ATHRSI not mad overbought yet, IMO gonna see it get stupid like Feb 2020. After that, then the big break.
5-10% correction incoming, likely a zigzag, all the previous were zigzag corrections. Tis the season!

1.618 PCZ of Bearish Butterfly Reached at OverboughtI expect that we will soon see the MACD cross bearishly where we will then begin a major reversal.

Do not buy FTT token now!We know FTT is a wonderful token, many proofs and a lot of funds are behind it, BUT;
.
It is in overextended area and Due to FTT historical movements(as you see in the previous one) we had an extreme 60%ish correction from May 12th till June 26th!
.
So, I do not expect such an aggressive correction, however, my best entry point is around 50 and 60% of fib retracement!
.
Let's see

Bearish Crab PCZ reached There's really not much to point out here. This is purely based off the crab pattern no divergence or anything special except that it's overbought.

GBPUSD - Price entered Overbought Zone (RSI) - near Resistance Hi Traders!
The market is in a shortterm Uptrend.
As you can see on the left hand side, there is a descending Trendline.
After the market made a Low (reference green arrow) it went up and broke the Trendline.
This Uptrend has continued even more, until the RSi indicated, that the market is overbought.
After the first RSI signal, the market moved up higher for 60 pips.
Then it turned back.
The Downtrend continued, until the market reached the last Low again.
From there, it started raising.
Additionally, it broke the Trendline.
Since there, it is moving up.
And just shortly before, the market gives the overbought signal.
Now the only thing to find out is how long it'll take to turn back.
As the last Low was a lower Low, we believe that this time, the price will make another lower Low.
That's because the weekly chart also indicates some kind of Trend Change (to a Downtrend).
The beginning of the down-movement could be identified by components like the structure, the volume or any patterns.
Thanks and successful Trading :-)!
