✅AUD_JPY EPICALLY OVERBOUGHT|SHORT🔥
✅AUD_JPY is epically overbought
As follows from the title because
The pair has been growing
Without pullbacks for 12 days
And has gained more than 8%
Which a TITANIC move for a
Forex pair thus, after the retest
Of the strong structure level
Of 98.500 I tink we will see
A bearish correction
SHORT🔥
✅Like and subscribe to never miss a new idea!✅
Overbought

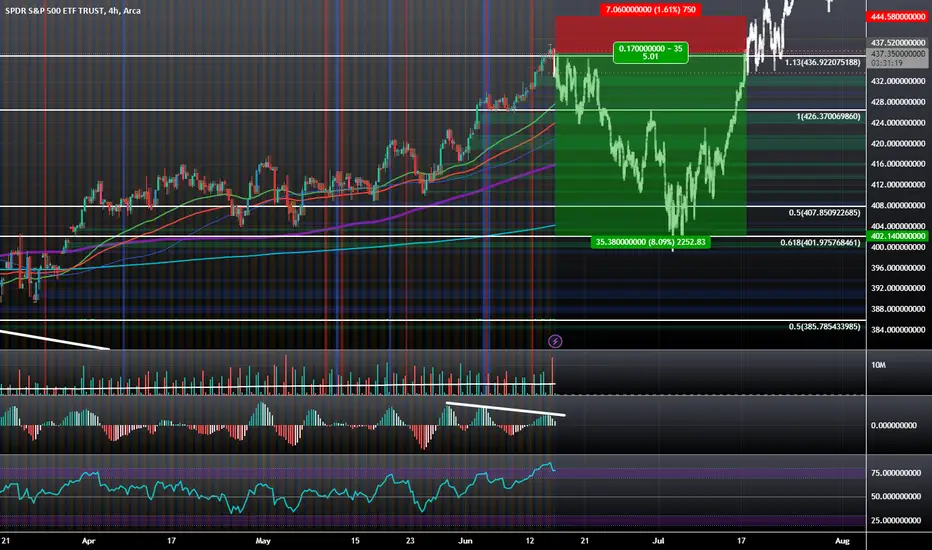
$SPY: 50%-61.8% Retrace Seems Likely Before Continuation HigherThe SPY seems likely to pull back to the levels of $420 to $400 before it can later decide whether it wants to continue the overall Bullish Trend to all-time highs. In the meantime, we are dealing with Double Bearish Divergence on the MACD, Overbought Conditions on the RSI, and a Bearish Engulfing Candle on the 4 Hour all while trading at the 1.13 Retrace of the local range it just broke out of.
Silver backing offTraders who think silver will retreat a bit from recent overbought levels could short the July contract here.

Dow bull not yet ragingSomebody whispered "new bull market!" into our ear overnight. Bull or no, we think DJIA futures have a bit further to pull back from recent overbought levels before the stampede begins in earnest.
Traders who agree can either short the September Dow futures, as here, or pick up some AMEX:DOG or $SDOW.

GBPJPY - OverBought Zone ↘️Hello TradingView Family / Fellow Traders. This is Richard, also known as theSignalyst.
GBPJPY has been overall bullish trading inside the red rising channel, however it is currently approaching the upper red trendline.
Moreover, the green zone is a strong resistance.
🏹 So the highlighted purple circle is a strong area to look for sell setups as it is the intersection of the green resistance and upper red trendline. (acting as non-horizontal resistance)
As per my trading style:
As GBPJPY approaches the upper purple circle zone, I will be looking for bearish reversal setups (like a double top pattern, trendline break , and so on...)
📚 Always follow your trading plan regarding entry, risk management, and trade management.
Good luck!
All Strategies Are Good; If Managed Properly!
~Rich

Does SPY want a correction? Maybe not but it will get one.SPY has had a good run this spring. However, things are changing. Just this week, the debt \
ceiling got raised. The fed will be auctioning large amounts of treasuries to pay bills. This is
money that will not go into the equities markets. Buying volume on a dollar basis will likely go
down as a consequence.
On the daily chart with a double Bollinger Band setup, SPY is more overbought than ever.
The part of the body of the last candle of this past week went outside of both the inner and
outer bands. Looking back this has not occurred in well over a year. Candle wicks did go
outside the bands in late October 22 and mid-December 22. On lower time-frames SPY
has already pulled back into the Bollinger Bands and begun a reversal. I believe that
many traders will take their profits off the table and take another look at bonds and treasuries.
ETFs like TLT and TMF may see significant inflows no matter for stocks in general may not.
I see this as a SPY pullback or correction upcoming for which to take a short trade.
I will look at SPY and QQQ put options with very short DTEs as well as call options on SQQQ.
For stock purchases, I might go with the ETFs SPXS and SPXU. The simple and basic analysis is
their chart shows price candles partially below the lower Bollinger Bands, the inverse of
the SPY. They are oversold and accordingly available for purchase at a discount.


Pepe looking over extended get ready for a pull back Anyone who took my divergence trade got paid, hopefully you took profits, expecting a pull back to the bottom of the zone 0.000001475, short'em if you got them, happy trading folks have a blessed weekend

☆ The Relative Strenght Index (RSI) # on4 ! ☆The Relative Strength Index (RSI)
-
is a popular technical indicator used by traders to identify overbought and oversold conditions in the market. The RSI with a period of 4 is a shorter-term version that can provide more frequent signals.
I use RSI 4 effectively following these steps:
Understanding RSI Basics:
The RSI measures the strength and speed of price movements.
It oscillates between 0 and 100, with values above 89 indicating overbought conditions and values below 11 indicating oversold conditions.
Identifying Overbought and Oversold Conditions:
When the RSI 4 rises above 89, it suggests that the market may be overbought, indicating a potential reversal or a corrective pullback.
When the RSI 4 falls below 11, it suggests that the market may be oversold, indicating a potential buying opportunity.
Confirming Signals with Price Action:
While RSI 4 can provide valuable insights, it is important to confirm its signals with other technical indicators or price action.
Look for additional confirmation such as trendlines, support/resistance levels, or candlestick patterns to strengthen the validity of the RSI signals.
Divergence Analysis:
RSI 4 can also be used to identify bullish or bearish divergences.
Bullish divergence occurs when price makes a lower low while RSI 4 makes a higher low, indicating potential upward momentum.
Bearish divergence occurs when price makes a higher high while RSI 4 makes a lower high, suggesting potential downward pressure.
Setting Stop Loss and Take Profit Levels:
Determine appropriate stop-loss levels to protect your trades in case the market moves against you.
Set take-profit levels based on your risk-reward ratio and the potential of the trade.
Remember, RSI 4 is just one tool in your trading arsenal. It is essential to combine it with other technical indicators, chart patterns, and fundamental analysis for a comprehensive trading strategy. Regularly monitor the performance of RSI 4 in different market conditions and adjust your trading approach accordingly.
Note:
The use of any technical indicator, including RSI 4, does not guarantee successful trades. It is important to practice risk management, conduct thorough analysis, and make informed trading decisions based on a holistic view of the market.
Always remember that no single indicator or strategy can predict market movements with 100% accuracy. Utilize RSI 4 as part of a well-rounded trading methodology, and continually refine your skills and knowledge through experience and ongoing education.
HappyForexTrading ☆ J

USD-CHF Strong Resistance Ahead! Sell!
Hello,Traders!
USD-CHF will soon hit
A strong key level of 0.911
From where I think the pair
Will make a local bearish correction
Sell!
Like, comment and subscribe to help us grow!
Check out other forecasts below too!

Short-Term Technical Analysis:(GOOGL) for the Next Few Weeks!In this trading idea, we delve into the current state of Google (GOOGL) and explore the indications of an overbought condition. With a careful examination of technical indicators, it becomes apparent that a sell-off may be imminent in the near term. The analysis suggests the possibility of Google entering a range-bound phase or even experiencing a continued downward trend. Traders and investors should pay close attention to key support levels as the stock navigates through the next zone, as they may provide valuable insights for potential entry or exit points

$QQQ — 9 Weeks since 21-EMA Tap!It has been 9 weeks since QQQ tapped the 21-ema on the weekly chart. The last time that happened? December 2021. Tech is mega-stretched to the upside, and mean-reversion is on the menu.
$330 puts expiring in two weeks
$310/$290 put debit spread expiring in September.
$345 stop loss. Hedge with short-term calls as needed.

✅USD_CHF BEARISH SETUP|SHORT🔥
✅USD_CHF has been growing recently
And the pair seems locally overbought
So as the pair is approaching a horizontal resistance of 0.91
Price decline is to be expected
SHORT🔥
✅Like and subscribe to never miss a new idea!✅

✅USD_JPY SWING SHORT🔥
✅USD_JPY will soon retest a key resistance level of 138.00
So I think that the pair will make a pullback
And go down to retest the demand level below at 137.00
SHORT🔥
✅Like and subscribe to never miss a new idea!✅

Introducing the Dynamic Fusion OscillatorHello, it's Stock Justice here! In our latest video, we delve into the world of the Dynamic Fusion Oscillator (DFO) - a tool that blends the power of the Relative Strength Index and the Stochastic Oscillator. I walk you through how it works, from understanding these two base components to how we fuse them to create a balanced and sensitive tool for identifying market trends and reversals.
We dive deep into how the DFO uses moving averages to signal potential bullish or bearish trends, and how divergence within the DFO can indicate trend reversals or continuations. I also touch on the DFO's capacity for multi-timeframe analysis, giving you the bigger picture of market trends.
Wrapping up, I remind you of the DFO's value as a versatile trading tool, but also emphasize the importance of using it alongside proper risk management and other technical analysis components. All in all, this video is a must-watch for traders aiming to enrich their toolkit and navigate the market more effectively!

EUR-NZD Is Overbought Now! Sell!
Hello,Traders!
EUR-NZD went up sharply
And the pair is locally
Overbought so as it is
Now retesting a strong
Horizontal resistance of 1.753
I think that we will see
A local bearish correction
Sell!
Like, comment and subscribe to help us grow!
Check out other forecasts below too!

Apple Inc.'s Stock Breakout and Future PossibilitiesApple Inc. (AAPL) has been a major player in the technology industry for decades. With its innovative products and constant growth, it has consistently attracted investors looking to gain from its success. In this update, I'll dive into the recent breakout of Apple's stock from its previous channel, the potential for further growth, and the need for caution in the face of overbought indicators.
The Inverted Head and Shoulders Breakout
In a previous update, I discussed the possibility of Apple's stock breaking out of the channel it had been trapped in for over a year. The inverted head and shoulders pattern that emerged broke out at $156, initially targeting $168 with a stretch target of $172 to $179. Against many expectations, AAPL has continued its upward trajectory, reaching a high of $174, marking a considerable increase from its bottom of $124 in June of the previous year.
Wave Structure and Potential Targets
From a wave structure perspective, it appears that we are currently witnessing the completion of a larger corrective move. However, identifying a clear 5-wave impulse from the lows proves challenging due to the corrective chop that occurred right in the middle of the inverted head and shoulders pattern. A possible target, based on this analysis, is $177, which is already within close range.
Caution Advised in the Face of Overbought Indicators
While the recent performance of AAPL has been nothing short of impressive, it is essential to exercise caution as numerous indicators on higher timeframes are pointing towards overbought conditions. Apple's stock has skyrocketed since hitting its bottom last June, which could be a cause for concern.
As we move into the next week, it is advisable to remain cautious, as there is a possibility of a more significant pullback in equities in the coming weeks. Investors should closely monitor market conditions, technical indicators, and any new developments that may affect Apple's stock performance.

Tips to Help Demystify the RSIPrimary Chart: Tips to Help Demystify the RSI
Introduction to Momentum Indicators
Many indicators exist for technical analysis. And a number of them focus on momentum, which is distinguishable from other core technical concepts such as trend, support and resistance, volatility, and standard deviation. Momentum tools measure the velocity of a directional price move. Using a train as an analogy, momentum considers the speed, velocity and magnitude of the train's movement in a given direction, e.g., north or south. In a sense, it helps determine the strength and speed of the directional travel of the train.
By contrast, trend analysis considers whether a price move is consistently heading in a given direction. A trend can be valid despite corrective retracements, where price retraces a portion of the prior move, consolidates a portion of the prior move, and then resumes movement in the trend's direction. Using the same train analogy, trend analysis considers how effectively and persistently the train is moving in a given direction, such as north or south. Momentum, though, considers the train's speed and velocity in whatever direction the train is moving.
Many momentum indicators also are not limited to analyzing momentum and may have utility as a trend gauge as well. For example, Stochastics, MACD and RSI all have the additional capacity to help analyze trends.
Basic Concepts and Calculation of RSI
Created by J. Welles Wilder, the RSI is one of the most widely used and well-known momentum indicators. The acronym "RSI" means relative strength index. RSI should not be confused with the concept of relative strength, which compares one instrument or security against another to determine its outperformance or underperformance. Some other common momentum indicators that have been in use for many years include the Rate-of Change, Chande Momentum Oscillator, Stochastics, MACD, and CCI. Most momentum indicators, including RSI, share some conceptual aspects, such as overbought and oversold conditions and divergences, even though they may vary in the way they are calculated and interpreted.
Reviewing the way an indicator is calculated can sometimes help to sharpen one's understanding of it and interpret it more effectively. RSI's calculation is not as complex as some indicators. So reviewing its calculation remains an accessible exercise, but this is not essential to mastering the indicator. TradingView's RSI description contains a useful summary of how the indicator is calculated. See the Calculation section of the RSI description at this link: www.tradingview.com(close%2C%2014).
Another excellent description of how RSI is calculated may be found on this reputable technical-analysis website: school.stockcharts.com
To summarize, RSI's basic formula is as follows: RSI = 100 – (100 / 1 + RS), where RS = average gain / average loss.
Using the default lookback period of 14 (note that any lookback period can be selected), the calculation then proceeds to include 14 periods of data in the RS portion of the calculation (average gain / average loss). So the average gain over the past 14 periods is divided by the average loss over the past 14 periods to derive "RS," and then this RS value is plugged into the formula at the start of this paragraph. The subsequent calculations also have a lookback of 14 periods (using the default settings) but smooth the results.
Smoothing of these values then occurs by (1) multiplying the previous average gain by 13 and adding the current period's gain, if any, and dividing that sum by 14, and (2) multiplying the previous average loss by 13 and adding the current period's loss, if any, and dividing that sum by 14. If the lookback period is adjusted from the default of 14, then the formula and smoothing techniques will have to adjust for that different period.
In short, the calculation reveals that RSI's core function is to compare the size of recent gains against the size of recent losses and then normalize that result so the indicator's values may fluctuate between 0 to 100. Note that if a daily period is used, for example, the average day's gain is compared against the average day's loss over the lookback period selected. Similarly, if hours are used, the average hour's gain is compared against the average hour's loss over the relevant lookback period.
RSI can be used on any timeframe, including a 1-minute or 5-minute chart, and simply calculates its values based on the period to which the indicator is applied, based on a default using closing prices for the period specified. With TradingView's RSI indicator, traders have a great deal of flexibility in adjusting such defaults to some other preferred value, so the closing price need not be used—the default can be changed to the open, the high, the low, high+low/2, high+low+close/3, or several other options.
Interpreting RSI's Overbought and Oversold Signals
With some exceptions, the higher-probability RSI overbought (OB) and oversold (OS) signals align with the direction of the trend. The old trading adage remains valid for RSI as with other forms of technical analysis: the trend is your friend. In the chart below, consider the yellow circles flagging OS signals that could have been effective in the Nasdaq 100's uptrend in 2021.
Supplementary Chart A: Example of RSI OS Conditions That Align with an Uptrend and Key Support
As with other technical trade signals, countertrend setups should be avoided in the absence of overwhelming confirmation from other technical evidence. If a countertrend setup is traded, use extra caution and smaller position size. In this context, trading RSI signals against the trend means selling or entering a short or bearish position in an uptrend when an OB signal appears, or it means buying or entering bullish positions in a downtrend when an OS signal appears. It may also mean trading counter-trend positions as soon as RSI begins exiting an OB or OS zone.
Stated differently, trading overbought and oversold signals against the trend will likely result in mounting losses. Countertrend trades require much technical experience and significant trading expertise—and even the most experienced trading veterans and technical experts say that the counter-trend trades tend to be low probability setups. In short, never trade the RSI's OB and OS signals mechanically without considering any other technical evidence.
Supplementary Chart B: NDX OB Condition in an Uptrend
In the chart above, note how the Nasdaq 100 (NDX) reached a fairly high daily RSI reading of 77.17 on July 7, 2021. This chart shows an example of how even very high OB conditions can persist much longer than expected. RSI remained above 70 for over a trading week. And the ensuing pullback was not that significant, and it didn't reverse the uptrend at all. The risk-reward for mechanically trading this setup would have been poor, and stops would probably have been ignored at some point in the days following the signal. For an experienced trader with small position size, perhaps the second RSI peak immediately following the July 7, 2021 peak would have worked for a short-term trade given that a divergence arose (higher price high coinciding with a lower RSI high). But it would still have been a difficult trade requiring excellent timing and precision.
In summary, OB / OS signals should not be interpreted and traded mechanically. The trend and other technical evidence should always be considered. OB / OS signals work best when aligned with the direction of the trend on the relevant time frame. They also work best when taken at crucial support or resistance.
Consider several other tips and tricks when interpreting OB / OS signals on RSI.
1. The importance of an OB / OS signal depends not only on the context of the trend in which it arises but also on the time frame on which it appears and the lookback period used in its calculation. This is intuitive, but it helps to keep this in mind. For example, an OB / OS reading has a greater effect on the weekly or monthly chart than on the daily, and an OB / OS reading has a greater effect on daily chart than on the hourly or other intraday chart. Furthermore, if the RSI lookback period is set to 5 periods on a given time frame, the effect of an OB / OS reading will less significant than if the RSI lookback period is set to 14 (the default setting).
2. Consider past OB / OS readings for the same security or index being considered (using the same time frame for past and current OB / OS readings). Each security or index may have OB / OS levels that differ somewhat from other securities or indices. In addition, the OB / OS readings that are typical for a given a security, index or instrument may vary over time in different market environments. It may help to draw support or resistance lines on the RSI indicator within the same market environment and trend to determine what RSI OB / OS levels are typical. RSI support or resistance levels in an uptrend should not drawn to be applied and used in a downtrend for the same index or security.
Supplementary Chart C.1: RSI Support and Resistance Levels for NDX in 2021 on Daily Chart
Supplementary Chart C.2: Two RSI Downward Trendlines Drawn on BTC's Weekly Chart to Help Identify Resistance
3. Divergences can strengthen the effect of an OB / OS signal. Stated simply, a divergence occurs when the RSI and price are in conflict. For example, consider two or three subsequent higher highs in price that occur (this can happen in an uptrend or a bear rally or in a trading range). When price makes the second or third high, a divergence arises if RSI makes a lower high. Or consider two or three subsequent lower lows in price. When price makes the second or third lower low, a divergence arises if the RSI makes a higher low. A greater number of divergences presents a stronger signal than a lower number of divergences. And having divergences on multiple time frames can also be helpful. Finally, a divergence should not be traded until confirmation comes from price itself, i.e., a trendline or other support / resistance violation.
Supplementary Chart D: Example of RSI Bearish or Negative Divergence at NDX's All-Time High in November 2021
4. OB / OS signals also can be helpful in chop when they arise at the upper boundary of a well-defined trading range. In choppy trading ranges, one has a better trading edge at the edge. OB / OS signals that arise at the edge (at critical support / resistance) are the most useful. But depending on the trading strategy, setups in choppy trading ranges can be more difficult and lower probability than setups in strong trends.
Using RSI as a Trend-Analysis Tool
While primarily a momentum tool, the RSI has trend-analysis aspects. Because the RSI will likely remain in overbought (OB) or oversold (OS) for extended periods, it helps evaluate the strength and duration of price trends.
In an uptrend or bull market, the RSI (daily) tends to remain in the 40 to 90 range with the 35-50 zone acting as support. In a downtrend or bear market the RSI (daily) tends to stay between the 10 to 60 range with the 50-65 zone acting as resistance. These ranges will vary depending on the RSI settings, time frame, and the strength of the security or market’s underlying trend. As mentioned above, RSI readings will also vary from one security or index to another. They also vary in different market environments, e.g., a strong uptrend vs. a weak uptrend will have different OB / OS readings.
So the RSI can help confirm the trend when it moves within the RSI range that is typical of that security or index when trending. As a hypothetical example example, if a major index appears to be making higher highs and lower highs, respecting trendline and other key supports, and showing technical evidence of an uptrend, then RSI can help confirm this trend analysis by marking OS lows within the 35-50 range (perhaps 30 on a volatile pullback). RSI can also help time entries and exits when reaching the area that has been where RSI has found support in its current market environment.
The following points summarize how RSI tends to operate during trending price action:
During an uptrend, RSI will trend within the upper half of the range (roughly), moving into OB territory frequently (and at times persisting in the OB zone) and finding support around 35-50. When RSI finds support around 35-50, this may represent tradeable a price pullback—a retracement of the recent trend’s price move—that may work as a bullish entry if other technical evidence confirms.
During a downtrend, RSI will trend within the lower half of the range (roughly), moving into OS territory frequently (and at times persisting in the OS zone) and finding resistance around 50-65. When RSI finds resistance around 50-65 (sometimes higher given the violent nature of short-squeeze induced bear rallies), this may represent tradeable a price bounce—a retracement of the recent trend’s price move —that may work as a bearish entry if other technical evidence confirms.
RSI, like other indicators, cannot produce perfectly reliable and consistently accurate signals. Like other indicators, it can help identify higher probability trade setups when used correctly and when confirmed with other technical evidence. When considering trade setups in terms of probabilities rather than certainties, traders will find position sizing and risk management to be a vital part of any strategy that relies in part on the RSI.

BTCUSD Ready to exit this big diamondBTCUSD reached further the supply area in overbought condition. A potential decrease of 7% can occur if the price action interact with the anchored VWAP from ATH. This potential movement can ignite an impulsive 5-wave bearish exiting of this big diamond pattern, which is likely complete.
Fisher Transform suggests the direction of the price action in 2H and 1D timeframes. Overbought condition on macro scenario, in which the price seems to be form a top, ready to a swing downward to complete a 5th wave of a expanded ending diagonal, likely to finish the actual bearmarket.

EURUSD : Support & Resistance Trading strategyOANDA:EURUSD
Eurusd , Is trading in channel up , After immense bearish downtrend last week market recover 100% , As market is overbought now
Possible market after hitting resistance at 1.0777 will retrace to lower trendline for more bullish momentum
Our target from 1.0777 will be 1.0709 area
if price break down lower trendline than fair chances that we may see 1.0657 mark
❤️ Please, support my work with follow ,share and like, thank you! ❤️

INJSDT: Facing Resistance, Overbought, Retracement PotentialInjective Protocol (INJSDT) has recently experienced an impressive rally that saw the price surge from a significant support level around $2.50 to a crucial resistance level at $4.65. As the market now seems to be in a range, various indicators are signaling overbought conditions, raising questions about the next possible move for INJSDT.
Current Market Situation
At the time of writing, INJSDT's price has stalled around the $4.65 resistance level. This level has proven to be a barrier for the asset in previous instances, making it an essential price point to watch. The support level at $2.50 played a significant role in the recent bounce, and this level is worth noting as a potential target in case of a retracement.
Overbought Indicators
One of the critical factors in the current market situation is the overbought condition of various technical indicators. These overbought indicators suggest that the market might be due for a correction in the short term. In such a scenario, the price may either consolidate at the current level, allowing indicators to reset, or it could undergo a retracement to lower support levels.
Wave Master Indicator on the 4h Timeframe
The Wave Master Indicator on the 4-hour timeframe has been a reliable tool for gauging price trends and identifying potential market reversals. As of now, the indicator is beginning to curl down after the recent thrust upwards, indicating that the bullish momentum may be losing steam.
Potential Scenarios
Consolidation: If INJSDT's price consolidates around the current level for a few days, it could allow the overbought indicators to reset, paving the way for a renewed push towards higher resistance levels. In this scenario, the price could potentially reach the $5.35 to $7.50 range.
Retracement: Should the market fail to consolidate and the overbought conditions persist, INJSDT might experience a retracement back to lower support levels. The price could drop to around $3.00 before resuming its upward trajectory. This would still set the stage for a possible move to the higher resistance levels between $5.35 and $7.50.
The consolidation or retracement scenarios will depend on whether the market can stabilize and reset the overbought conditions or whether a deeper correction is necessary. As always, exercise caution and utilize proper risk management techniques in your decision-making process.

NVDA- Overbought & Over-ExtendedBeen eyeing NVDA for quite some time now after playing the breakout from the inverse head and shoulder's it had been holding. However, with broader market conditions being what and where they are, looking for a bit of a retrace here on NVDA prior to its earnings. Overbought on almost every timeframe, MACD Death Cross, bearish divergence on the RSI, as well as a bearish ABCD Elliot wave on the daily timeframe and a massive bearish harmonic pattern on the weekly timeframe along with a double top on the 4-hour timeframe (See Attached Charts Below). NVDA is simultaneously rejecting a major RSI-based demand level, which is exactly where the .78 FIB level lies. Watching closely here- some FIB levels and RSI-Based supply and demand zones to keep an eye on in the meantime- Bearish short-term, Bullish long
--Weekly Timeframe--
--4-Hour Timeframe--

✅BITCOIN CORRECTION AHEAD|SHORT🔥
✅BITCOIN went up so sharply
That took many of us by
Surprise indeed, however
Trees don't grow to the sky
So as the strong resistance
Level is ahead I think that
We are likely to see some
Bearish correction
SHORT🔥
✅Like and subscribe to never miss a new idea!✅
