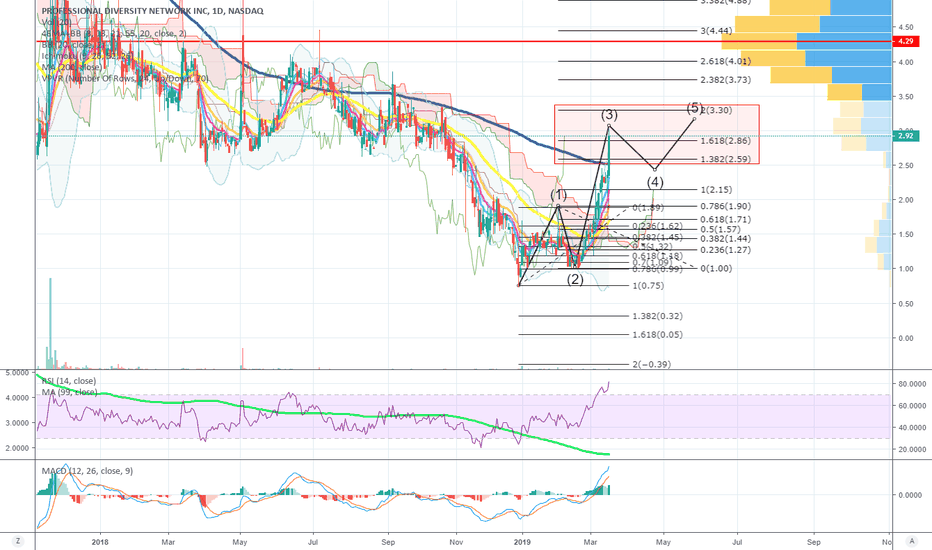
Overextended
Looking for a short This stock gain 13.33% yesterday and now i think its a bit over extended at this point, looking for a short between the range of $4.83 and $4.64.
Looking for a short GMA is overextended from yesterday, got rejected at $4.09 and close ten cents below. I have gather data for the past 249 days and the mean of this stock -0.23% with a median of -0.38% stating there is more negative days then positive. Also with Kurtosis its 9 and the skew 0.02 as well, this data just gives me more information about my short basis. Looking to short between $4.03 and $3.87 and 1 standard deviation is 77%.
Looking for a shortWSP had a massive run up yesterday, gaining over 10%. I love seeing when a stock is overextended it just gives me more reason to short it, the mean of WSP is -0.19% so there more negative days than positive. Based on the data its a normal standard deviation of 68%, therefore im looking to trade between $2.19 and $1.78, lets see how it reacts between $2.060 and $1.92.
looking for a short FNP looks way overextended on daily, it gain just over 10% yesterday without any news. Look for a potential short, my trading range will be between $5.96 and $5.65.
Happy Trading
Short Z1P Did well with my short play on Z1P, gap up nicely then fail to pass $5.37. Got in at $5.34 with a stop at $5.39 with 1,500 shares. Reduce my position at 1 R by 30% then got out the rest at $5.26, quick scalp play to the downside.
I like to calculate the stocks Standard Deviation of 1 year data, hence why $5.37 is a key level.
AUDJPY Short Term Bearish Analysis AussieJPY had a straight Bullish run for several days now, and on the daily it is now at past support that can become future resistance. if you take a look here at www.mataf.net and you pull up the Aussie Daily chart and you pull up the JPY Daily chart you will see that the Aussie is hitting a past support that can become future resistance and the the JPY is hitting a past resistance that can become future support so now when combined as the AUDJPY it becomes very strong that it has a good chance going down short term.
Now in order to confirm the move to put some more odds in m favor I'm waiting for the hourly chart to break down from its most recent support level that it has formed then I will look to enter going for about 60 pips or so till the next level of resistance that can become future support...
I hope this makes sense to you if yes let me know, and even if not tell me why you think differently tell me what you see that iam missing.
Thank You!
BTC Dominance Rising Wedge Theory
Each trendline has three points of contact and are logarithmically getting closer together: rising wedge pattern.
BTC Dominance beginning to look overextended (TD) and overbought (RSI) while testing resistance between 72-74%.
This is far from a perfect rising wedge as it excludes the September 2018 head fake, but a theory worth considering.
BTC.D closed above it's 200 Week MA (70.5%) for the first time ever last month. A close below could be fatal.
Currently expecting a January 2020 "mini altseason" with full-blown altseason in Winter 2021.
URGENT:Past pick $HYRE forming #DoubleTop w/ #BearishDivergence!URGENT: Past pick $HYRE forming #DoubleTop w/ #BearishDivergence! Starting to look like a GOOD PLACE to SHORT, however be sure to #LADDER in those orders at RESISTANCES!
Bearish Black Swan In EURAUD.The price is overextended in the oscillators. Price is also reaching into the upper Bollinger bands (not shown on this chart). The bearish black swan is icing on the cake. Wait for day pullback and go short if it looks like there is momentum. Follow the 45 degree trend line to profits and adjust stops as necessary just above the 45 degree trend line.


