PRSO | The Perfect Bullish Setup | LONGPeraso Inc. operates as a fabless semiconductor company, develops, markets, and sells semiconductor devices and modules. It focuses on development of millimeter wavelength (mmWave) for the 60 gigahertz, spectrum, and for 5G cellular networks. The company's products include mmWave ICs, including baseband IC, various mmWave radio frequency, integrated circuits, as well as associated antenna technology; and mmWave modules. It also provides accelerator engine products, comprising bandwidth engine for high-performance applications where throughput is critical; and programmable hyperspeed engine to allow user-defined functions or algorithms. In addition, the company offers quad partition rate which allows for parallel accesses to multiple partitions of the memory simultaneously. Its mmWave products enable various applications, such as 5G with low latency and high reliability, multi-gigabit, mmWave links over 25 kilometers, as well as consumer applications, such as wireless video streaming, and untethered augmented reality and virtual reality. The company also licenses intellectual property, as well as offers non-recurring engineering services. It markets its products through direct sales personnel, as well as sells representatives and distributors. The company was formerly knowns as MoSys, Inc. and changed its name to Peraso Inc. in December 2021. Peraso Inc. was incorporated in 1991 and is based in San Jose, California.
Oversold

DERM | Good Entry Point | OversoldJourney Medical Corporation focuses on the development and commercialization of pharmaceutical products for the treatment of dermatological conditions in the United States. The company's marketed products include Qbrexza, a medicated cloth towelette for the treatment of primary axillary hyperhidrosis; Accutane, an oral isotretinoin drug to treat severe recalcitrant acne; Targadox, an oral doxycycline drug for adjunctive therapy for severe acne; Ximino, an oral minocycline drug for the treatment of moderate to severe acne; and Exelderm cream and solution for topical use. It also sells doxycycline hyclate tablets, minocycline hydrocholoride capsules, and sulconazole nitrate cream and solution. The company was formerly known as Coronado Dermatology, Inc. and changed its name to Journey Medical Corporation. Journey Medical Corporation was incorporated in 2014 and is headquartered in Scottsdale, Arizona.

INM | This is a Runner | LONGInMed Pharmaceuticals Inc., a clinical stage pharmaceutical company, develops a pipeline of prescription-based products. The company operates through two segments, the InMed and the BayMedica. The InMed segment researches and develops cannabinoid-based pharmaceuticals products. The BayMedica segment develops proprietary manufacturing technologies to produce and sell rare cannabinoids for the health and wellness industry. The company's prescription-based products include rare cannabinoids and novel cannabinoid analogs for the treatment of diseases with high unmet medical needs. Its lead product is INM-755, a cannabinol topical skin cream, which is in Phase 2 clinical trial for the treatment of epidermolysis bullosa. The company is also developing INM-088, which is in preclinical studies for the treatment of glaucoma; INM-405 for the treatment of pain; and cannabinoid-based treatments for various diseases, including dermatology and ocular diseases. In addition, it offers IntegraSyn, an integrated biosynthesis-based manufacturing approach, for pharmaceutical-grade cannabinoids; and cannabichromene, cannabicitran, cannabidivarin, and tetrahydrocannabivarin. The company was formerly known as Cannabis Technologies Inc. and changed its name to InMed Pharmaceuticals Inc. in October 2014. InMed Pharmaceuticals Inc. was incorporated in 1981 and is headquartered in Vancouver, Canada.

VIRX | I Like These Setups | OversoldViracta Therapeutics, Inc., a precision oncology company, engages in developing drugs for the treatment of virus-associated malignancies. Its lead product candidature includes Nana-val, in combination with nanatinostat and valganciclovir that is in Phase II clinical trial for Epstein-Barr virus-positive lymphoma; and open-label Phase 2 basket trial for the treatment of various relapsed/refractory Epstein-Barr virus-positive (EBV+) lymphoma, as well as an open-label Phase 1b/2 trial for the treatment of EBV+ recurrent or metastatic nasopharyngeal carcinoma and other EBV+ solid tumors. The company's development pipeline includes vecabrutinib, a clinical-stage non-covalent ITK/BTK inhibitor and VRx-510 (formerly SNS-510), a preclinical-stage PDK-1 inhibitor. It is evaluating development and collaboration opportunities for vecabrutinib in combination with chimeric antigen receptor T-cell therapies and VRx-510 in various oncology indications. The company was formerly known as Sunesis Pharmaceuticals, Inc. to Viracta Therapeutics, Inc. in February 25, 2021. Viracta Therapeutics, Inc. was incorporated in 1998 and is headquartered in Cardiff-by-the-Sea, California.

BKYI | Nice Oversold Condition | LONGBIO-key International, Inc. develops and markets fingerprint identification biometric technology and software solutions, and enterprise-ready identity access management solutions for commercial, government, and education customers in the United States and internationally. The company offers BIO-key PortalGuard and PortalGuard IDaaS solutions, a customer-controlled and neutral-by-design cloud-based identity platform that allows customers to integrate with any cloud or on-premises SaaS application, as well as windows device authentication through IAM platform. Its solutions enable its customers to secure their workforces and student populations; and make their partner networks more collaborative. In addition, it provides BIO-key VST and WEB-key products; and Civil and Large-Scale ID Infrastructure solutions that develops finger-based biometric technology. Further, it offers finger scanners for enterprise and consumer markets under SideSwipe, EcoID, and SidePass brand names. The company was formerly known as SAC Technologies and changed its name to BIO-key International, Inc. in 2002. BIO-key International, Inc. was founded in 1993 and is headquartered in Wall, New Jersey.

CPNG | Oversold eCommerce Play | BounceCoupang, Inc. owns and operates in e-commerce business through its mobile applications and Internet websites primarily in South Korea. It operates through two segments, Product Commerce and Growth Initiatives. The company sells various products and services in the categories of home goods and decor products, apparel, beauty products, fresh food and groceries, sporting goods, electronics, and everyday consumables, as well as travel, and restaurant order and delivery services. It also performs operations and support services in China, Singapore, Japan, Taiwan, and the United States. Coupang, Inc. was incorporated in 2010 and is headquartered in Seoul, South Korea.

CF | Good Entry Point | LONGCF Industries Holdings, Inc. manufactures and sells hydrogen and nitrogen products for energy, fertilizer, emissions abatement, and other industrial activities worldwide. Its principal products include anhydrous ammonia, granular urea, urea ammonium nitrate, and ammonium nitrate products. The company also offers diesel exhaust fluid, urea liquor, nitric acid, and aqua ammonia products; and compound fertilizer products with nitrogen, phosphorus, and potassium. It primarily serves cooperatives, independent fertilizer distributors, traders, wholesalers, and industrial users. The company was founded in 1946 and is headquartered in Deerfield, Illinois.

PEV | Good Entry Point | BouncePhoenix Motor Inc. designs, assembles, and integrates electric drive systems and light and medium duty electric vehicles. The company offers buses and trucks. It focuses on developing light and medium duty commercial electric vehicles for various service and government fleet markets, including city fleets, campuses, municipalities, and transit agencies; and serves a spectrum of commercial fleet customers, such as airport shuttle operators, hotel chains, transit fleet operators, seaports, last-mile delivery fleets, and large corporations. The company also markets and sells electric vehicle chargers for the commercial and residential markets; and operates a sales and leasing dealership in the United States. In addition, it sells various L2 and DC fast-charging solutions to its fleet customers at the point of sale for fleet vehicles. The company was founded in 2003 and is headquartered in Anaheim, California. Phoenix Motor Inc. operates as a subsidiary of Edisonfuture Inc.

BHAT | Oversold Gaming Play | BounceFujian Blue Hat Interactive Entertainment Technology Ltd. engages in the designing, producing, promoting, and selling animated toys with mobile games features, intellectual property, and peripheral derivatives features worldwide. It offers AR Racer, a car-racing mobile game; AR Crazy Bug, a combat game played using a ladybug-shaped electronic toy; AR 3D Magic Box, which uses AR recognition technology to allow children to draw shapes or objects onto a physical card while the mobile game captures the drawings and animates them onto a set background; AR Dinosaur, an educational toy; 'Talking Tom and Friends' Bouncing Bubble, which enables children to bounce and play with bubbles; and AR Shake Bouncing Bubble, which helps children to improve concentration and reaction. The company also holds license to sell products with WUHUANGWANSHUI brand images. Its distribution channels include domestic distributors, e-commerce platforms, supermarkets, and export distributors. Fujian Blue Hat Interactive Entertainment Technology Ltd. was incorporated in 2010 and is based in Xiamen, China.

SLDP | Powering to Move Up | LONGSolid Power, Inc. focuses on the development and commercialization of all-solid-state battery cells and solid electrolyte materials for the battery-powered electric vehicle market in the United States. The company was founded in 2011 and is headquartered in Louisville, Colorado.

RIDE | Incoming Bounce | OVERSOLDLordstown Motors Corp. develops, manufactures, and sells Endurance, an electric full-size pickup truck for fleet customers. The company was founded in 2019 and is based in Lordstown, Ohio.

ATNF | Is My Math Off? | LONG1180 Life Sciences Corp., a clinical-stage biotechnology company, develops therapeutics for unmet medical needs in chronic pain, inflammation, fibrosis, and other inflammatory diseases. Its product development platforms include fibrosis and anti-tumor necrosis factor (anti-TNF) platform, which is under Phase IIb clinical trials that focuses on fibrosis and Anti-TNF; Synthetic Cannabidiol (CBD) Analogs platform, which is under preclinical trials that are man-made derivatives of CBD; and a7nAChR platform, an immune suppressive, which is under preclinical trails that focuses on alpha 7 nicotinic acetylcholine receptor. The company was incorporated in 2016 and is headquartered in Palo Alto, California.

LTHM | Oversold EV Battery Play | LONGLivent Corporation manufactures and sells performance lithium compounds primarily used in lithium-based batteries, specialty polymers, and chemical synthesis applications in North America, Latin America, Europe, the Middle East, Africa, and the Asia Pacific. The company offers lithium compounds for use in applications that have specific performance requirements, including battery-grade lithium hydroxide for use in high performance lithium-ion batteries; and butyllithium, which is used in the production of polymers and pharmaceutical products, as well as a range of specialty lithium compounds, including high purity lithium metal, which is used in non-rechargeable batteries and the production of lightweight materials for aerospace applications. It also provides lithium phosphate, pharmaceutical-grade lithium carbonate, high purity lithium chloride, and specialty organics; and lithium carbonate and lithium chloride for use as feedstock in the process of producing performance lithium compounds. The company was incorporated in 2018 and is headquartered in Philadelphia, Pennsylvania.

HA | About to Take Flight | LONGHawaiian Holdings, Inc., through its subsidiary, Hawaiian Airlines, Inc., engages in the scheduled air transportation of passengers and cargo. The company provides daily services on North America routes between the State of Hawai'i and Long Beach, Los Angeles, Oakland, Sacramento, San Diego, San Francisco, and San Jose, California; Las Vegas, Nevada; Seattle, Washington; Portland, Oregon; Phoenix, Arizona; and New York City, New York. It also offers scheduled service between the State of Hawai'i and Austin, Texas; Boston, Massachusetts; Orlando, Florida; and Pago Pago, American Samoa. In addition, the company provides daily service on its Neighbor Island routes among the four major islands of the State of Hawai'i. Further, it offers scheduled service on its international routes between the State of Hawai'i and Tokyo (Narita), Japan, Osaka, Japan; Sydney, Australia; Papeete, Tahiti; and Seoul, South Korea, as well as operates various ad hoc charters. Hawaiian Holdings, Inc. distributes its tickets through various distribution channels, including its website hawaiianairlines.com primarily for North America and Neighbor Island routes, as well as through travel agencies and wholesale distributors for its international routes. As of December 31, 2021, the company's fleet consisted of 19 Boeing 717-200 aircraft for the Neighbor Island routes; 24 Airbus A330-200 aircraft; and 18 Airbus A321neo for the North America and international routes. Hawaiian Holdings, Inc. was incorporated in 1929 and is headquartered in Honolulu, Hawaii.

Wave exhaustionThe main purpose of analyzing waves is to understand when the current wave is exhausted aka overextended aka overbought aka oversold.
What is every1 seem to miss is that exhaustion is not based exclusively on "price gone too far", but also on "too much time passed" and "not much volume was traded" as well. That's one of the main reasons why your comparative analysis, divergences on so called "indicators" do not work properly. It simply can't. These methods do not gain time & volume information from the data.
When you analyze order flow on any resolution, be it 1 minute, 5 years or tick chart, you're interested in 2 waves: current wave and *the very last (previous) wave in the same direction .
* including the imaginary waves
Don't forget to turn in log scale when it's needed!
You compare these 2 as the current wave develops and keep updating the answer to the binary question, "which of these two waves is weaker". Strength of a wave = it's ability to continue. Every wave starts strong and goes weaker and weaker, the factors are:
1) Time. Horizontal size of a wave (in bars), more time (more bars) - weaker ;
2) Range. Vertical size of a wave, higher range - weake r;
3) Volume, or inferred volume. You sum up all the volume within a wave, or sum up all the bar sizes within a wave. Less volume - weaker .*
* in order not to sum up anything within a wave yourself, here you can turn in volume/range bars and simply count em.
And from that moment it's like "Best of 3" comparison.
1) Time. Wave A 10 bars, wave B 5 bars. Wave B is stronger;
2) Range. Wave A 546 points, wave B 890 points. Wave A is stronger;
3) Volume. Wave A 10k, wave wave B 8k. Wave A is stronger;
So at that point, wave A was stronger = wave B was weaker.
This will be giving you a binary answer which wave is weaker. When the current wave becomes weaker than the last wave in the same direction, current wave is considered exhausted.
P.S.: wave start in time (first bar of the wave) is the level origin itself or the first bar that touched a level if we talked about a new wave starting from an already positioned level, or about a wave started after clearing a positioned level.
The more you'll think about the more it'll make sense. An example. Remember seeing fast price jumps? After some, the price reverses very fast and goes back, after others prices continues in the direction of the jump. In most of the cases the current wave (the jump) gets exhausted in terms of price, but not exhausted in terms of time (the jump was very fast). So in terrms of time and price both waves are 50/50. What is different is volume. If the current wave (the jump) had a huge volume, overall it's still not exhausted, hence it continues. Sounds familiar? Sounds logical?
Just the last simple and obvious thing, in most cases you won't need to calculate sum volumes/ranges, usually at the moment of analysis the current wave is already longer and higher than the previous one in the same direction, hence the current wave is already exhausted.
Yessir

HYRE | Another Bounce is Coming | LONGHyreCar Inc. operates a car-sharing marketplace in the United States. Its marketplace allows car owners to rent their idle cars to ride-sharing service drivers. The company sourcing vehicles from individual owners, as well as commercial owners of vehicles including car dealerships and fleet owners. HyreCar Inc. was incorporated in 2014 and is headquartered in Los Angeles, California.

PHILIPS - Oversold - LongpositionOn the Philips chart (PHIA - 4h timeframe), We can see the price is currently oversold. The price is approaching a support area and is probably going to bounce off. Enter and leave the trade at the level defined on the chart.
The three indicators used are Bollinger Bands, RSI, and Stochastics. All these three indicators are confirming the oversold condition.
See all further details on the chart.
Good luck!

LGMK | Ready for Lift Off | LONGLogicMark, Inc. offers personal emergency response systems (PERS), health communications devices, and Internet of Things (IoT) technology that creates a connected care platform in the United States. The company, through its subsidiary, LogicMark LLC, manufactures and distributes non-monitored and monitored personal emergency response systems sold through healthcare durable medical equipment and monitored security dealers/distributors, and the United States Department of Veterans Affairs. The company was formerly known as Nxt-ID, Inc. and changed its name to LogicMark, Inc. in March 2022. LogicMark, Inc. was founded in 2006 and is based in Louisville, Kentucky.

EVGO | Time to Charge Up | LONGEVgo, Inc. owns and operates a direct current fast charging network in the United States. The company offers electricity directly to drivers, who access its publicly available networked chargers; original equipment manufacturer charging and related services; fleet and rideshare public charging services; and charging as a service and fleet dedicated charging services. It also provides ancillary services, such as customization of digital applications, charging data integration, loyalty programs, access to chargers behind parking lot, or garage, pay gates and pilots microtargeted advertising, and charging reservations; and maintenance and development and project management services through eXtendTM, including electric vehicle supply equipment installation, networking, and operations. The company was incorporated in 2010 and is based in Los Angeles, California.

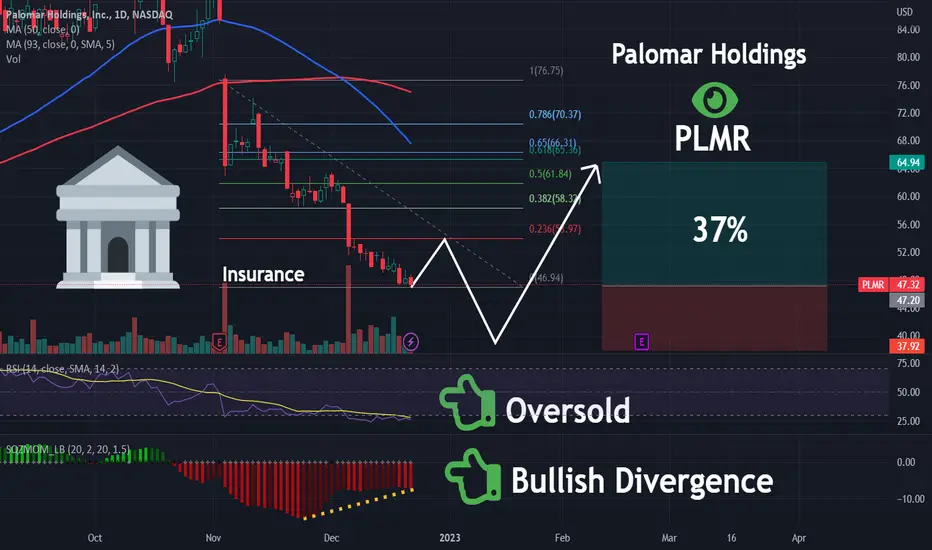
PLMR | I Like This Entry | LONGPalomar Holdings, Inc., an insurance holding company, provides specialty property insurance to residential and commercial customers. The company offers personal and commercial specialty property insurance products, including residential and commercial earthquake, commercial all risk, specialty homeowners, inland marine, Hawaii hurricane, and residential flood, as well as other products, such as assumed reinsurance, commercial flood, real estate error and omission, and real estate investor products. It markets and distributes its products through retail agents, wholesale brokers, program administrators, and carrier partnerships. The company was formerly known as GC Palomar Holdings. Palomar Holdings, Inc. was incorporated in 2013 and is headquartered in La Jolla, California.
MSOS | Time to Get High | OversoldThe fund is an actively managed ETF that seeks to achieve its investment objective by investing, under normal circumstances, at least 80% of its net assets (plus any borrowings for investment purposes) in securities of companies that derive at least 50% of their net revenue from the marijuana and hemp business in the United States and in derivatives that have economic characteristics similar to such securities. It will concentrate at least 25% of its investments in the pharmaceuticals, biotechnology & life sciences industry group within the health care sector. The fund is non-diversified.

WANT | Consumer Discretionary | BullishThe Advisor employs a replication strategy. The fund generally invests substantially all, but at least 95%, of its total assets in the securities comprising the index. The index includes securities of companies from the following industries: retail; hotels, restaurants and leisure; textiles, apparel and luxury goods; household durables; automobiles; auto components; distributors; leisure products; and diversified consumer services. It is non-diversified.

HTZ | Start the Engines | BounceHertz Global Holdings, Inc. operates as a vehicle rental company. It operates through two segments, Americas Rental Car and International Rental Car. The company provides vehicle rental services under the Hertz, Dollar, and Thrifty brands from company-owned, licensee, and franchisee locations in the United States, Africa, Asia, Australia, Canada, the Caribbean, Europe, Latin America, the Middle East, and New Zealand. It also sells vehicles; and operates the Firefly vehicle rental brand and Hertz 24/7 car sharing business in international markets. Hertz Global Holdings, Inc. was founded in 1918 and is headquartered in Estero, Florida.
