BITCOIN Bull SeasonThe RSI just hit oversold on Bitcoin, meaning a bull season will about to start for the cryptocurrencies. It is very probable that the tendency will revert. LET'S GO PUMP MAY
BITSTAMP:BTCUSD
Oversold

So You Also Trade USDTRY? Buy Now!Not a lot of people trade USDTRY. If you are one of them, maybe you want to consider long positions. I am long on this pair.
Price failed to break below major support and my fav indicator, stochastic is turning bullish
Long positions at market this morning
Stop: 14.5414

Netflix Analysts forget microeconomics principles... Hysteria??Netflix Q2 2022 Earnings Report: ir.netflix.net
Key Takeaways of Netflix Earning Report
> Lowest P/E ration in 10 years of operating.
> Revenue is UP 2.06% from last quarter.
> Revenue is UP 9.8% from Q2 of 2021
> Operating Margin of 25.1% is UP 19.1% from the last 4 Quarter average.
> Diluted EPS of $3.53 is UP 25.6% from the last 4 Quarter average.
> Global subscriptions is 6.7% UP from Q1 2021
> Cash Flow is strong.
> Netflix Content is still Great. Streaming market share for total US TV time has risen 0.4% in a 10 month period. That is factoring all the new cheaper competitors entering the Market.
> Net Margin has Been growing at a constant and rapid pace.
With the Financials briefly covered above, here are some of the key thoughts to keep in mind.
Why are financial "Analysts/reporters" trumpeting on about the around 2 million lost subscribers?
The answer is that they have not read the Financials. Their understanding of the streaming market is limited to subscriber count as the sole Variable to take into account. This is the unfortunate result of an incentive, to hold one reason or aspect as the sole driver of the streaming business.
>> The microeconomic 101 principle should have made it clear that as Netflix prices are raised there will be less demand.
>> What is more important is that the FINANCIAL inflows, more than make up for the lost 2 million subscribers.
The demand is Inelastic and therefore the price rise, was the right decision from a shareholder & business perspective.
>>> I will be DCA into this oversold discount, increasing my Netflix position in my portfolio. With the long term in mind, that Netflix is a main pillar in the continuously growing streaming sector<<<
Not financial advice, just an investor/trader's opinion. Who is looking for the best reward to risk In this turbulent market.
Check out my AMD analysis if you liked this Idea:

$HUT - 2 Chances HUT broke down from the inverse head and shoulders. It even has candle confirmation - spinning doji followed by bearish engulfing. It is fair to say that the IHS is NEGATED.
I see 2 bullish scenarios here on $HUT . In this order:
1. Bullish divergence on $HUT. It can bounce righy here on the 4.50 support and see much higher levels: 4.8, 5, 5.5 and even higher levels.
2. $HUT loses the bearish divergence and goes for oversold zone (below 30 RSI and under). It can try to bounce here.
Thanks for reading. What do you think?
This is not financial advice. This is solely for entertainment purposes. Do not take anything from this idea as advice in any way, shape, or form.

Now its Easter Inflation Rally ModeINTERMEDIATE WAVE 1
It is likely we have ended this wave although technically the index could still go lower for one more day. This analysis is based on the assumption we have ended wave 1 on April 11 as originally forecasted.
INTERMEDIATE WAVE 2
With wave 1 lasting only 9 days, I am expecting wave 2 to last 3-4. Most of the models agree at 4 days. Day 4 would be the Monday after Easter. My gut is leaning toward 3 days as there is a market holiday on Friday. It is most likely there will be lighter trading or jubilation at the start of earnings season that is dashed quickly (next week) by a rockier short-term inflation drag on future outlooks. Plus 3 days away from the markets can lead to longer uncertainty (Russia, Middle Eastern conflicts, oil, etc.). We do not have many price targets, but should see a decent rally for this holiday shortened week. It is likely the inflation numbers are swallowed better than expected starting tomorrow. We are looking at a 2.5% rally with potential tops above 4500. Historically wave 2’s ending in 32C2 retrace 58-70% (4522.84-4570.16) of wave 1’s movement. History says this is possible, but my more conservative target is 38-50% (4495-4522). This movement will also contain an ABC upward pattern, where wave B is downward. All price targets are:
4491.75 which is 36.42% retracement of Intermediate Wave 1 as ended on April 11
4496.95 ----------- 38.69%
4520.05 ----------- 48.78%
4525.52 ----------- 51.17%
4541.43 ----------- 58.12%
4551.46 ----------- 62.50%
4570.16 ----------- 70.67%
4585.15 ----------- 77.22%
4601.47 ----------- 84.35%
4614.27 ----------- 89.94%
INTERMEDIATE WAVE 3
Intermediate wave 3 is where we am forecasting the most significant downward movement still. This could be Russia related, but it will also occur during the bulk of earnings season. Our guess is the economic outlook, inflation, interest rates, transportation costs, along with the Fed’s pace and rate of rate increases will take center stage during earning calls. This outlook may look bleak in the near-term, but we continue to anticipate the market to find its bottom before the end of the summer and as early as mid-May. We will have Intermediate wave 3 forecasts once we appear to finish wave 2 (with the first projections this weekend).
Feel free to follow us for more historical statistics and projections!

Bitcoin: Pillars of Overbought/OS on RSI’s w/ 100D EMA The first 2 pillars on the left price got rejected from 100 Day EMA when RSI's were overbought. The third pillar broke the 100EMA but was still getting/were oversold on the RSI's. The last pillar is close to/has bottomed on the Stoch's and regular RSI is under midline as were testing 100D EMA again. If BTC breaks 100EMA (43.6K) and RSI midline price could have some good room to run, if not RSI could want to bottom again before moving higher.

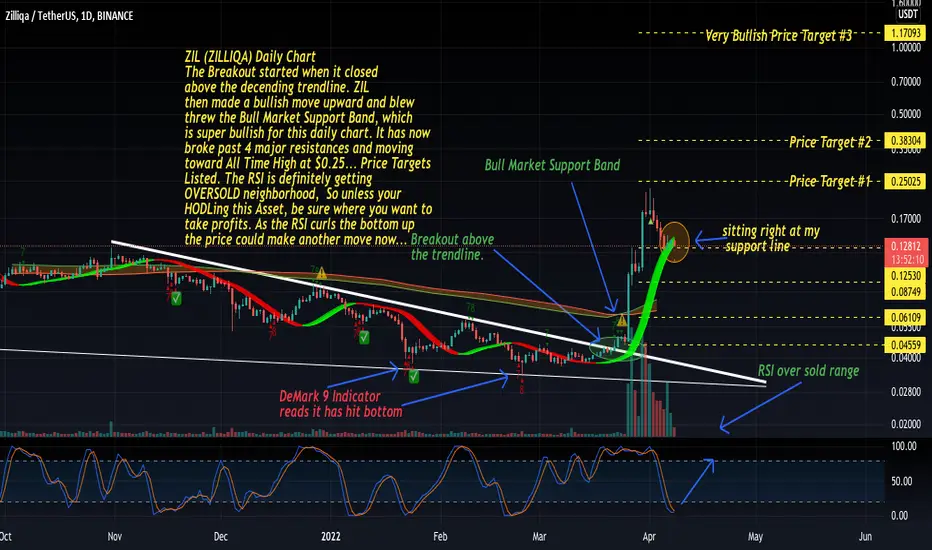
ZIL daily chart has cooled off & could make another push upwardZIL (ZILLIQA) Daily Chart
The Breakout started when it closed
above the decending trendline. ZIL
then made a bullish move upward and blew
threw the Bull Market Support Band, which
is super bullish for this daily chart. It has now
broke past 4 major resistances and moving
toward All Time High at $0.25... Price Targets
Listed. The RSI is definitely getting
OVERSOLD neighborhood, So unless your
HODLing this Asset, be sure where you want to
take profits. As the RSI curls the bottom up
the price could make another move now...
Dear Elon MuskDear @elonmusk :
I have heard you are facing a huge tax bill.
However, there is an instrument which can help you make money.
It is NZD, New Zealand Dollars, as known as Sheep Coin and Kiwi Coin.
I know you like to find profit from the trips of coins to the moon.
I think nzd is a nice instrument, but it is facing offensive spam from hostile market makers.
The news writters gave us two execuses.
One is covid19, especially the emerging B.1.1.529 variant.
I don't think so because New Zealand is one of countries encountering low impact from covid19.
New Zealand is far away from Europe, Asia and America, so people are less willing to travel from and to New Zealand.
The other is fear of Fed taper.
I don't think so either because nzd is in the progress of increasing interest rate.
Although Fed may consider speed up taper, they are still in the qe state.
I only believe two reasons.
One is New Zealand may spend a lot of money to buy oil.
The other one is spam from market makers.
It is because a lot of investors know to buy nzd, so market makers try to make us unprofitable.
Conclusion
Can you help us punishing those market makers and bring the justice back to the nzd investors?
Best Regards
clocks156t174 and other nzd investors

EURJPY Might Have Peaked. Price Might Range 135.00 - 125.00!EURJPY pushed higher with strong impulse last month after going all the way lower towards 125.000 psychological support and rejecting it. The current impulse was very intense until it tested the resistance that was present at 137.000 area and rejected it. This rejection was accompanied by the monthly candle closing beneath the key psychological resistance at 135.000. At this moment the price remains in a strong uptrend on the weekly charts as evident by the ascending long term weekly channel. Since the price rejected the 137.000 resistance and M candle closed below 135.000 resistance, it could likely mean that the price might reverse and start heading lower gradually.
Fundamentally, the EURO is the weakest major currency at the moment due to the ongoing conflict and the YEN has depreciated considerably against most major currencies due to the bank of japan monetary policy outlook. The bank of Japan might likely intervene in the markets to prevent the YEN sliding further. These two factors would likely mean that the EURJPY might have tested its high at 137.000 and now would be looking to head lower primarily driven by the EURO weakness.
Coming back to the technical part, last month's impulse was so strong that its failing to provide any technical short term outlook for the EURJPY. However at the 125.000 psychological support, we can see that if its breached (Monthly candle closing below 125.000) then the price would likely resume heading lower towards the 122.000 support. This breach in turn would also violate the long term ascending weekly channel. Therefore patience is required while trading EURJPY on weekly and daily time frames.
On the Flip side, if EURJPY were appreciate more, which would be unlikely given the current fundamental state, it faces multiple resistances unless it manages to clear the 140.000 psychological level after which the path to 145.000 is open to be tested.
In conclusion, we can expect a gradual range trading for EURJPY between 135.000 & 125.000 in the coming weeks. If 125.000 is violated based on current technical picture then we can take this pair short towards 122.000.
Cheers, I hope you find this insight helpful. Please LIKE & FOLLOW for more insight on Major & Minor currency pairs.

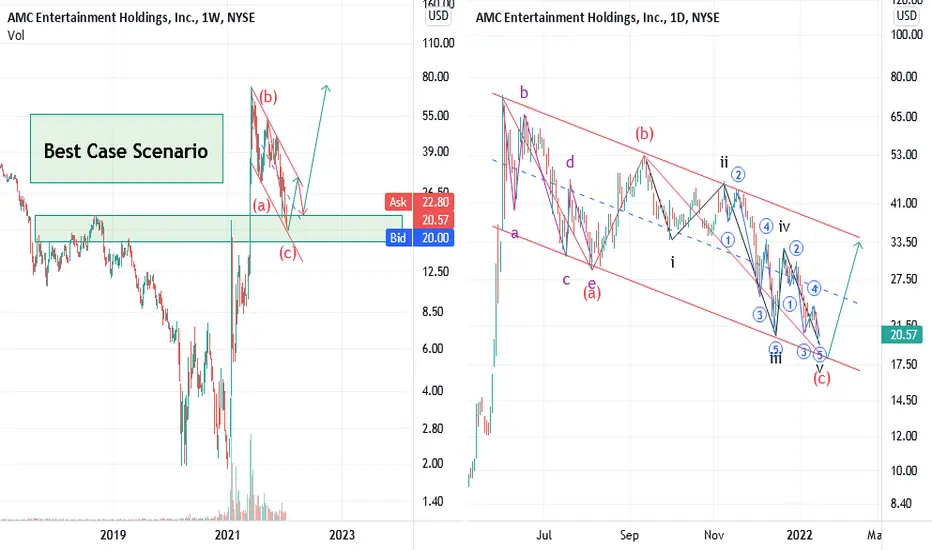
AMC, Major Update as promised on 4th Aug 2021 !(( Stopped out. Wave counting need a major update ! )) 4th Aug 2021
(( General trend is still down. There will be a considerable Up going counter trend correction . Then we will have another large down going wave . I will publish the update at appropriate time . )) 4th Aug 2021.
Above are my last two updates on the idea published on 15th July 2021 . We found a possible long setup (See related idea for detail), entered and stopped out and predicted the upcoming path accurately! We promised to publish our update in appropriate time and now its the time !
Weekly chart :
AMC's decline from ATH to current price can be beautifully charted inside a down going parallel channel in logarithmic scale. Decline shows an ABC form of correction which is almost completed while stock is reaching to strong support formed by the area of price action and different Fibonacci levels of different types . This area has been shown by a green box on the left side chart. Also ,Indicators in weekly and daily time frame are in oversold zone.
Daily chart:
We have a closer look to correction pattern shown on the weekly. Wave (a) can be decomposed to abcde components to form a leading diagonal . Wave (c) can be beautifully decomposed to 5 leg impulse down with wave iii and v to be 5 legs down themselves . As shown on the chart stock is completing its wave 5 in circle of v of (c) near the strong support.
Please note this is the best case scenario as emphasized on the weekly chart. It means there may be some alternative scenarios like this whole abc pattern being just wave A of and ABCDE triangle or next move up being just a connecting wave X or....( For different correcting forms possibilities see related idea published on TSLA if you are interested to get more details).
If this proposed best case scenario happens , It makes a new ATH and we can take the advantage of next considerable move up.
Good luck my friend.
Could this be the bottom ?Ashford hospitality trust invest directly into the hospitality industry, mainly through hotels which of course have been annihilated since the pandemic, and there are arguments that business travel will never return to pre pandemic levels which Ashford hospitality rely on. At the start of 2020 the SEC launched an investigation into the business due to transactions dating back to 2018 (this was resolved in Feb 2022 with no actions taken) so do not get me wrong this is a company that is well and truly down in the dumps and the chart reflects such a case.
However from a technical perspective this is certainly worth a second look. Trading 99% down from ATH of $1000 and change whilst beginning to show strong signs of bullish divergence across an array of indicators.
Relative strength index in over sold territory with bull divergence.
MACD showing bullish divergence.
Awesome oscillator has printed a new high whilst price has made a new low but tapping into resistance.
Volume is also falling along with the price which is a good indicator that may signal a weak trend.
Will follow up with analysis of the 1D timeframe
Take care.

EURUSD: Fundamentals Are Against The EURO! SHORT Move FavorableA tricky scenario regarding the EURUSD! Its too oversold however the fundamentals are still very much against the EURO here. A LONG move is being capped by multiple resistance and one of the nearest trendline capping its growth is visible on the main 4H chart. Therefore a SHORT move would be favorable shall the technical criteria meet, one of them being the daily candle to needs to close below 1.09100 support which would likely give way to further drop in price.
Even if the above criteria is fulfilled, the price needs to retrace considerably before a SHORT trade could be executed and to achieve a 1:1 RR. Also note that if the price hits TP target first then retraces, the trade becomes invalid. Therefore a retrace needs to take place first. All the vital details are present on the main chart to observe.
Cheers, I hope you find this insight helpful. Please LIKE & FOLLOW for more insights into other major currency pairs.

BABA - Oversold to overbought
Everybody knew 77 was ridiculous level for this name to see when eCommerce was booming WW. But when the risk appears in the percentage terms in front of you...its hard to justify the buy. The core of how the titans of the investing world operate. Value is the most when retails is the most scared to touch anything. This applies to many chinese names. Not all of them will end up making money for the investors, but there are big names that should hold well over the next decade - BIDU, BABA, TECHY to name a few
Despite how much the price has bounced, that can't be your reason to trade. Critical indicators are VMA, 30 EMA and ATR buy zone. If you really believe in the turnaround theory (volume suggests yes), any dip below 112 could be used to build a position. right up to 95 as the first stop loss.

FTM - Purple War Zone!Hello everyone, if you like the idea, do not forget to support with a like and follow.
FTM is overall bearish trading inside our brown channel .
However, it is currently approaching the lower brown trendline.
The highlighted purple circle is a strong area to look for buy setups as it is the intersection of the blue support (1.0 - 1.2) and lower brown trendline. (acting as non-horizontal support)
As per my trading style:
I will be looking for bullish reversal setups on lower timeframes(like a double bottom pattern, trendline break, and so on...)
Unless FTM breaks the blue zone downward aggressively with many big bearish candles.
Always follow your trading plan regarding entry, risk management, and trade management.
Good luck!
All Strategies Are Good; If Managed Properly!
~Rich

EURCHF: Inverse H & S Complete! Price Likely To Climb Further.With the risk off markets that highly affected the EUR against the safehaven CHF a couple of weeks ago, the price plummeted near the parity! At the moment the price seems to be recovering slightly and likely looks to be headed over to the next psychological resistance found at 1.05000 area.
The Swiss National Bank is likely handing a helping hand to the EUR here by intervening in the market. On the technical basis, the inverse head and shoulders formation was completed and the price is likely to test the neckline before heading higher. All the complete trade details can be found on the main chart.
Cheers, I hope you find this insight helpful. Please LIKE & FOLLOW for more insights on other major currency pairs.

GBPUSD LongConsidering the bullish sentiment on the GBP index and the bearish sentiment on the USD sentiment serving as additional confluence to the current oversold situation on GBP/USD, I will consider going long for at least till Thursday.

Falling Wedge- Bullish (Long) - UpdateRUN looking really nice here heading into earnings sitting right on its 9-Day EMA. Big Falling wedge on both the daily and weekly timeframes (See Attached Chart Below), Bollinger bands are starting to squeeze (Not Pictured) as buyer volume starts to pick up relative to seller volume. Slight bullish hidden divergence on the RSI on the daily timeframe & the weekly timeframe along with a bullish Gartley harmonic pattern formed on the weekly timeframe- Bullish and will be looking for a breakout from this falling wedge (broader market conditions permitting)- Just some support and resistance levels along with some RSI-based supply and demand zones to keep an eye on in the meantime (Previous Charts Attached Below)
- Falling Wedge
- Bollinger bands are starting to squeeze (Not Pictured)
- Slight bullish hidden divergence on the RSI on the daily timeframe & the weekly timeframes
- Bullish Gartley harmonic pattern formed on the weekly timeframe
- RSI getting out of oversold territory as buyer volume starts to pick back up
PT1- $23.87
PT2- $24.60
PT3- $25.54
PT4- $26.06 +
--Weekly Timeframe--
--Previously Charted--

$WMS - OVERSOLD BEFORE EARNINGSWith remote work on the increase, people are upgrading their home furniture and living conditions more than ever before.
A company like Williams-Sonoma will feel the benefit of this changing trend in living styles.
Increased demand should allow furniture retailers to counter-act rising material costs by raising prices.
Adding to this point, the housing market has remained strong. People need to buy furniture more than ever.
WMS earnings are released Wednesday, March 16th after the bell.
Quote from Pragya Pandey's Stock News article below:
"WSM is an omnichannel specialty retailer of multiple products for the home. It also supplies cooking, dining, and entertaining products such as cookware, tools, electrics, cutlery, tabletop and bar, outdoor furniture, and a library of cookbooks under the Williams Sonoma brand, along with home furnishings and decorative accessories under the Williams Sonoma Home brand; and furniture, bedding, lighting, rugs, table essentials, and decorative accessories under the Pottery Barn brand.
Last month, Pottery Barn Kids and Pottery Barn Teen, members of WSM, announced new collections with the famous resort wear brand Lilly Pulitzer. The ‘Lilly Pulitzer x Pottery Barn Kids’ and ‘Lilly Pulitzer x Pottery Barn Teen’ collections launched new product categories to the partnership, including décor, textiles, sleepwear, backpacks, and water bottles in Lilly Pulitzer’s signature prints. Jennifer Kellor, President, Pottery Barn Kids, and Pottery Barn Teen, stated that “Our collaboration with Lilly Pulitzer is the result of coming together as brands who value incredible design with exceptional quality,”
Also, in January, WSM announced its collaboration with Black Artists + Designers Guild (BADG), a global organization committed to developing a more equitable and overall creative culture through the improvement of independent Black makers. The new collaboration between Pottery and Barn and BADG comprises products designed for entertaining, hosting, and gathering."

WHY INVESTORS IGNORE STRONG FUNDAMENTALGLS NSE Shares:
Market Cap
₹ 5,428 Cr.
Current Price
₹ 445
High / Low
₹ 800 / 376
Stock P/E
12.8
Book Value
₹ 161
Dividend Yield
2.42 %
ROCE
96.9 %
ROE
61.0 %
Face Value
₹ 2.00
EPS
₹ 134
Industry PE
24.3
Debt
₹ 3.64 Cr.
Debt to equity
0.00
Earning Power
26.5 %
Promoter holding
82.8 %
FII holding
8.32 %
DII holding
0.47 %
Pledged percentage
0.00 %
High price all time
₹ 800
Low price all time
₹ 376
Market Cap to Sales
2.63
No. Eq. Shares
12.2
Public holding
8.36 %
Earnings increasing yearly.
Technically Indicators Oversold
Forming daily chart triangle.
Bullish above 465 1 day close
SL: 425
Target 800
Risk is yours and Reward is too yours totally
Time Frame : 1-3 Years

LAC about to jump higher before the March stumble?Based on historical movement, the trough could occur anywhere in the larger red box. The final targets are in the green boxes. The pending top should occur within the larger green box as has been the historical case. Half of all movement has ended in the smaller green box. In this instance, the signal indicated BUY on March 4, 2022 with a closing price of 24.973.
If this instance is successful, that means the stock should rise to at least 25.11 which is the bottom of the larger green box. Three-quarters of all successful signals have the stock rise 3.579% from the signal closing price. This percentage is the bottom of the smaller green box. Half of all successful signals have the stock rise 8.399% which is the end point of the black dotted arrow. One-quarter of all successful signals have the stock rise 17.491% from the signal closing price which is the top of the smaller green box. The maximum rise on record would see a move to the top of the larger green box. These are the same concepts for the levels in the red boxes as well.
The ends/vertical sides of the boxes are determined in a similar fashion. The peak of the rise can occur as soon as the next trading bar after signal close, while the max rise occurs within the limit of study at 50 trading bars after the signal. A 0.4% rise must occur over the next 50 trading bars in order to be considered a success. Three-quarters of successful movement occur after at least 6 trading bars; half occur within 21 trading bars, and one-quarter require at least 40 trading bars.
The black dotted arrow represents median historical movement. Medians are a good metric, but they are just one of many I use when forecasting future movement.
As always, the stock could decline the very next bar after the signal without looking back (therefore the red boxes would not come into play) or the stock may never decline (and the green boxes may never come into play).

What is happening with the EUR (EUR/USD)Hello guys. We could see that the EUR has shown extremely high bearish pressure in the previous week. EUR bleeds. And this is not only the case with the USD (which is the main rival to the EUR) but with a basket of other currencies. Unfortunately, this is a consequence of the war that is happening in Europe, and according to various economic sources, the impact of the war on the European economy will be huge and all this is not in favor of the euro. Many economists do not rule out the possibility that the ECB will intervene in Forex to stabilize the currency, but this may or may not happen.
However, from a technical point of view, I don't have much to say. I think we could only wait for one scenario, and that is that we will get a decent pullback, preferably up to 0.382 fib levels, and that would be a good opportunity to enter a short position. At the moment, the market is in theoversold area (daily chart, look at the RSI) and with that in mind, it is reasonable to expect a pullback. But when we have geopolitics in the center of attention, everything can be and nothing has to be.
I would also like to note that many experts predict parity for EUR/USD and this seems reasonable to expect, especially when we look at the economic situation and the differences in the monetary policy of the ECB and the FED.

BTC Short TermOn H4 chart BTC is bearish/oversold in the MACD, RSI and Stoch RSI. I expect BTC to consolidate or make a small correction to the FVG zone. This will open up possibility for fresh entries and both alts if we stabilize or correct here. BTC has now become a strong asset during the Ukraine/Russia crisis, BTC also looks stronger than fiat and jump in BTC price and ''MCAP of stable coins'' indicate that investors are buying these assets. 3 of the top 11 coins are stable coins (usdt, busd and usdc)

RSI AMPLIFIER// (v4) RSI AMPLIFIER ( MCDX-Oscillator + Renko-Filter ) ( BTC ) ( 1h,2h,3h,4h )
//Authors credit:
//Smart Money based of / Indicator | MCDX
//Renko Volume based of "Weiss Wave Volume" / "WWV"
//The SmartMoney MCDX (MultiColor-Dragon) amplify rsi values to give confirmation of so called BANKER or SMART-MONEY against Retaillers.
//The main issue to me was that the original "SmartMoney MCDX" give only half the potential information since it focus only on positive price action.
//Therefore this version is a SMART-MONEY OSCILLATOR built to give entry/exit signals for shorts as well as long.
//The Real-Momentum plot replaces HOT MONEY (area, darkgreen/darkred), react quickly to oversold/overbought and hit the max/min value at almost every bar.
//The Over-Extended plot replaces BANKER MONEY (stepline, yellow/blue), need a stronger oversold/overbought value to move from the middle.
//The Signal-Line plot (line, green/red, with filler), is halfway between the Real-Mommentum & Over-Extended trying to give a signal after the move start but before the biggest candles.
//
//The original RETAILLERS MONEY carries no information and as been erased.
//
//Renko-Filter reduce the noise by adding volume values to each new columns until the trend reversal.
//How to use:
//
//The purpose and logic of this indicator is " Amplify to Simplify "
//
//Enter trade when the Signal-Line leave the middle.
//Long when it go TOP GREEN / Short when it go BOTTOM RED
//Exit trade when the Signal-Line return to middle or/while the Renko-Filter reverse.
//
//When you analyze the chart stay zoom out with max/min on the edges of the pan. Only the biggest Renko-series will be visible.
//When trading, you may zoom in to see evolution in real time.(version built for minutes time-frames in progress)
//
//You can easily set a LONG TRADE alarm on the Signal-Line, choosing "Greater than 10" then "Less than 50000"
//You can easily set a SHORT TRADE alarm on the Signal-Line, choosing "Less than -10" then "Greater than -50000"
//
//Be careful when Real-Momentum start being choppy or simply goes too much/too long in the opposite side of the trend.
//If the Over-Extended plot follow the Signal-Line after you enter a trade, you're good but always exit before the Over-Extended return to mid.
//Use the Renko-Filter to detect lauching Extended-Trend, to confirm Real-Momentum reversal, or to stay in a trade to the last candles.
// INFO:
//This version is built on purpose for BTC 1h/2h/3h/4h, differents assets, time-frames or exchanges may need change.
//If you can't see the Over-Extended, Signal Line or Renko-Filter with a particular time-frame or asset, you can change the value of the rsi at "rsi := 500000" & "rsi := -500000".
//Change by a value > to that of the candles (last value in status line).
//Zoom in on the indicator to see the Renko-Filter but idealy you want to see the max/min value of the 3 plot of the indicator(default = 50000).
//
// Overlay:
//You can display this indicator directly on your Chart and set No scale (fullscreen), to use it like as a RSI Baseline.
//If so, i made specifics version doing it by default (overlay,BTC)(overlay,largeCAP).
//@version=4
