Bullish- Looking for a breakoutROKU looking very interesting here- Double top played out as expected, however, ROKU held the longer-term uptrend quite nicely- will be watching closely for a breakout here (broader market conditions permitting). Just some support and resistance levels to watch along with some RSI based supply and demand zones to keep an eye on- Bullish
- Falling wedge (bullish) on shorter timeframes, Bollinger bands also squeezing (See Chart Below)
- Doji reversal right on the 200-day EMA
- RSI in oversold territory
- Buyer volume increasing relative to seller volume
- MACD cross looks to be imminent
PT1- $354.43
PT2- $357.50
PT3- $366.55
Oversold

EURUSD: Weekly Forecast 22nd August 2021EURUSD had another bearish week right after a short recovery from the week before, essentially breaking new low again.
While reviewing our past weekly forecast, it actually followed an ABCD pattern based on the weekly timeframe and shall be completed this week should the price drops further into the demand level at 1.16.
The dollar has been strengthening weeks before the Fed has turned hawkish where it now stands ready to taper this year, thus potentially bring about a reverse effect when it does taper.
This week, we shall follow the current trend and look for selling opportunity starting from 1.1710 supply level, and aiming for the demand level at 1.16.
Otherwise, we will be observing for a clear reversal signal as an ABCD in the weekly timeframe completes at 1.16.

WTI: Weekly Forecast 22nd August 2021WTI just recorded another record-breaking drop in a week, showing no sign of stopping even in the last trading day.
The oil price has definitely reached an extremely overbought level and it should not be any surprise to see major correction like this.
Do keep in mind that oil is still in a bull market and it's very likely that oil demand will reach another record-breaking level once travelling overseas return in the foreseeable future.
Putting the fundamental aside, when the oil market does a major correction, it is usually within a range of 20%, and guess what? We are just 1% away from 20%.
Therefore, we will resume looking for buying opportunities at the current demand level around 61 BUT keeping in mind that the short-term trend is still very bearish though extremely oversold.
Should the price rebounds, we should be able to see 66 again and eventually resuming into a bullish trend overall.

$BABA$BABA is simply being sold for one reason right now, fear that the Chinese Communist Party (CCP) policies will do "something".
That "something" ranges from nationalizing large companies in China to banning profits and foreign investment to the more standard communist practices of wealth redistribution and an inefficient government bureaucracy amongst widespread corruption.
But if we’re looking at $BABA as a company it’s undervalued.
If price is able to find support around my boxed level it would give a good long term hold.
Oversold on all major timeframes.
- Factor Four

Ethical Diapers with Cute Patterns! Clean Beauty! Great news Great news! The long-term value and ethics of Honest is immense, and it’s currently oversold, a perfect opportunity to catch some Honest gains! This is a long term hold, PT: $42 or more. Could have Etsy- like expansive growth. The decrease in share price after an IPO is common. Don’t be discouraged, and HODL!
Have fun! Be safe!
“Not investment advice” (legally required to say until I pass all my Series exams)

Do you really wanna short this here?!Look where it rests and think again about selling short at support. Just an observation!
Pivoting soon to new ATH IMO; Oversold.

Smallcaps Oversold again: Bounce in channel likely?!At lower support, way oversold, red volume dropping here, sellers near exhaustion. Maybe an exhaustion gap down?!

✅NZD_CHF LONG FROM SUPPORT🚀
✅NZD_CHF has reached a support level
And we are already seeing a bullish reaction
I think that the pair is oversold
And thus a bullish continuation is a likely scenario
With the target being the supply area above
LONG🚀
✅Like and subscribe to never miss a new idea!✅

GBPJPY Week Insight (Aug 16-20)Hello All and blessed.
Since price failed to break the top trendline
there can be some downside to 149.
Also RSI is not yet oversold, and has not reversed.
Price also has to break below the 149 to continue head and shoulders pattern.
If there is a break above the top white trendline then we see a big major move up.
Note that in weekly time, there is a cup and handle pattern and we are in the handle.

Time for ConocoPhillips to end the skid?Based on historical movement, the trough could occur anywhere in the larger red box. The final targets are in the green boxes. The pending top should occur within the larger green box as has been the historical case. Half of all movement has ended in the smaller green box. In this instance, the signal indicated BUY on August 16, 2021 with a closing price of 54.82.
If this instance is successful, that means the stock should rise to at least 55.17 which is the bottom of the larger green box. Three-quarters of all successful signals have the stock rise 2.337% from the signal closing price. This percentage is the bottom of the smaller green box. Half of all successful signals have the stock rise 4.213% which is the end point of the black dotted arrow. One-quarter of all successful signals have the stock rise 8.049% from the signal closing price which is the top of the smaller green box. The maximum rise on record would see a move to the top of the larger green box. These are the same concepts for the levels in the red boxes as well.
The ends/vertical sides of the boxes are determined in a similar fashion. The peak of the rise can occur as soon as the next trading bar after signal close, while the max rise occurs within the limit of study at 40 trading bars after the signal. A 0.5% rise must occur over the next 40 trading bars in order to be considered a success. Three-quarters of successful movement occur after at least 7 trading bars; half occur within 21 trading bars, and one-quarter require at least 34 trading bars.
The black dotted arrow represents median historical movement. Medians are a good metric, but they are just one of many I use when forecasting future movement.
As always, the stock could decline the very next bar after the signal without looking back (therefore the red boxes would not come into play) or the stock may never decline (and the green boxes may never come into play).

Imagine AR rebound after long period of consolidationCup and handle pattern approaching
IP was highly oversold in the last couple of months connected to a general small cap drop
News situation is promising and I expect some more NR's connected to the international soccer business and other partnership or customers
I expect a reversal from the current level with significant gains in the next weeks

Falling Wedge- Watching CloselyBroader market conditions permitting, will be looking for a breakout from this falling wedge- just some support and resistance levels and some RSI based supply and demand zones to keep an eye on- bullish

Falling Wedge- BullishBroader market conditions permitting, will be looking for a breakout from this falling wedge, just some FIB levels and some RSI based supply and demand zones to keep an eye on- bullish
- Bollinger bands are squeezing
- Oversold on the RSI

Possible Ascending Triangle FormingPossible ascending triangle forming on PYPL and currently sitting right on its 100-day EMA at the moment. Keeping an eye on PYPL here for a long-term entry. RSI is in the oversold range on almost every timeframe and has a big gap to fill on the upside after selling off after earnings. Will be looking for a breakout (broader market conditions permitting) Bullish - just some support and resistance levels to keep an eye on as well as some RSI based supply and demand zones

FUTU Greatly OversoldFUTU is resting at its historical support and is also showing signs of bouncing off of this place allowing for major gains to be had. Our Bullish Signs are the %R oversold oscillator about to create a crossover buy signal and the squeeze displaying a reduction in selling momentum.
Bullish Signs
-Oversold, on oscillator
-Squeeze indicator
-historical support
Price Targets
-1st 121
-2nd 133
-3rd 142
-4th 153
-5th 164
Hope you enjoyed and remember to invest safely :)

Amazon Bullish ConsolidationAmazon has been consolidating for a great period of time indicating that a big move may occur. Using the 4hour time frame, we can preemptively dictate that we may see a move towards the upside. Selling momentum has been reducing while the VPCI has had a buy signal as seen by the crossover. Not only have we seen a buy indication from the VPCI on the 4h but also the 1day time frame. Greater confirmation for this play would be to watch the daily time frame for reducing momentum. I think a target to 3560 is great since that is the monthly resistance but it is best to only sell when given a sell signal.
Bullish Signals
-Squeeze indicator
-VPCI crossover(4h and 1day)
-Oversold Willy oscillator
Price Target
-3,560

$PTON looking ROUGH, but bounce imminent. Stoch RSI on the 65 min chart looks very oversold - once it crosses back up we should see a nice healthy bounce assuming the market cooperates. I took a healthy position on 116c 8/20 exp.

Natural Gas Inverse ETF Looking Bullish In RangeNatural Gas is looking bearish with a potential bearish ABCD:
There for in an attempt to play this bearish move down i will be looking into trading this inverted ETF.
This ETF seems to be trading near the bottom of a long term trading range that has never been broken in it's 10 years history while showing MACD Bullish Divergence and being Oversold on the RSI so i see this as the perfect place to buy.

Perfect Entry on HTHI wanted to see how HTH reacted when faced with its Fibonacci Support and from the looks of it, it showed it has room for bullishness. The squeeze indicator indicated a decline in selling momentum with an additional oversold indication given by the Oscillator. I would swing this stock all the way up to 35-37.
Bullish Signals
-Fibonacci Support Bounce
-Oversold via oscillator
-Squeeze
Price Targets
-1st 35
-2nd 37

Bullish Squeeze for TTETTE has retraced to one of its Fibonacci supports and have bounced off of it pretty significantly. Not only is it holding support, but there is greater indication of a greater bullish move. The %R indicates that a oversold condition was not too long ago with the addition of selling momentum reducing greatly, given by the Squeeze indicator. My price targets are 47, 50 then 57 if it gains a substantial amount of bullish momentum. For a significant sell signal, let the squeeze play out until there is a reduction in momentum.
Bullish Signals
-%R oscillator
-Squeeze indicator
-Fibonacci Support
Price Targets
-1st 47
-2nd 50
-3rd 57

✅USD_CHF WILL GO UP|LONG🚀
🏛USD_CHF has fallen sharply after the DXY demise
But the pair seem to be oversold at this point
And the support level is nearby
Which makes me expect a local pullback up
Once the pair retest the support properly
LONG🚀
✅Like and subscribe to never miss a new idea!✅

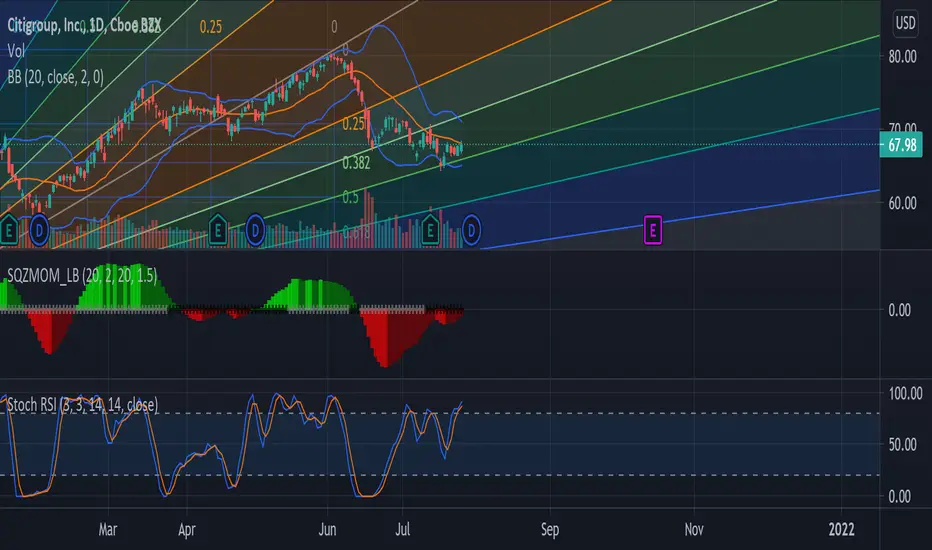
Great Entry for Citigroup Great Up-move to be expected. A squeeze is about to occur on the daily while also holding its support. Another indication towards bullish sentiment is the Stochs Bullish Divergence. Not only does the daily suggest an up-move, but the weekly indicates an oversold condition. Price targets are 73 then 80.
Bullish Signals
-Squeeze
-Stoch Divergence
-Fib Support
-Weekly oversold
Price Targets
-1st 73
-2nd 80
Buy Usdchf! 68 pip winI’m hoping to see a retest of this trendline but if not then there will be no entry. I have been watching this pair and saw it would go up but without all of my confluences met I saw no entry. If this retests the white trendline and produces a doji candle we are in. We already know this will go up we just need a higher low for confirmation which is my last confluence for this pair. I will update when I get in if I do. I’m feeling very bullish.
Make sure to do your own due diligence and use proper risk management.
