$SPCE super oversoldSPCE looks amazing. Super oversold followed by major volume on the drop. $22.80 is main support, as long as we hold that then i'll be looking to take this thing back up to the gap at $26.42.
SPCE 15min:
SPCE 4hr:
Oversold

Amazing self driving car technology buy opportunity You don’t want to miss out on this buy opportunity. Money will be funneling into this stock in the coming years. I believe this will be a large cap stock one day. This will provide over 100% returns in the mid-term. We are oversold on the stochastic and just touched the 200 day moving average. BUY BUY BUY 🖤

OGI Canadian Cannabis Gem Hop on the train quick today is offering some nice discounts on this undervalued stock. We will see $6-$8 in the next coming weeks/ months. Recently invested in by a tobacco company for about $173 million will allow them to expand their reach and will be getting into the CBD scene. Go luck y’all lmk what you guys think!

ASTI heavily discounted renewable energy stock I bought into this one after the election believing Joe potato head Biden would cause some parabolic movement. I picked up a few thousand shares for about .063 per share. Being now where it is I’m going to be buying another few thousand shares because we are way oversold on our stochastic and it’s undervalued. If the Democrats go through with their trash progressive energy reforms we may just be able to profit off of some of the tard legislation.

$RIDE Primed A potential break out in the making could push some massive moves!
Keep a close eye... for the utmost safety, wait on the earnings call eod today or spin the wheel a Lil early ;).
Do you own Due Diligence on what is happening and make a sound decision. My best gains have come from these times in the past, especially on SHOP. Around $180, a short report said Shopify would never surpass $200 about two years ago now. I will hold and add and only exit if we break $9.00 and take my loss with pride!
Companies in the USA attempting to make the world a better place are risky currently, but in my opinion, they belong in any growth portfolio for the long haul as this will be the future. Buy the hype train, or buy when everyone else is fearful and taking losses. TSLA, XPEV, NIO, RIDE, and soon Rivian have/are/will be my personal long holds for the EV sector.
Gl and best wishes to all!

OCUGEN Inc. Don t miss the great long opportunityGan Box play !!
OCUGEN INC - OCGN
Broke resistance
1D stoch oversould
4h RSI- bullish divergence
4h-6h MACD- bullish divergence and bullish cross
If you like my worck ,smash the like button,comment or follow me !
I would also be very happy about TV tokens ,for more free setups and privat tips
No trading advice,dyor and trade save!

FANS switching to bullish mode after recoveryAfter the strong performance based on great news in February 2021, there was an overreaction by investors and an excessive sell-out
The result was a pull-back to around 1.10 CAD $, also as a result of overall red markets especially in the tech sector.
Based on Stoch RSI indicator the stock is oversold at the moment and seems to be ready for a significant turnaround.
News regarding the application for U.K. Gambling Licenses (4th of March) is very promising too. Awareness and interest in FANS is rising.
I consider that it's possible that FANS will be able to climb up to 2.50-3.00 CAD $ by the end of March.

Bitcoin Golden Cross approaching 70k $ end of May 2021After Bitcoin's latest setback, I expect a reversal from the current point.
MACD looks strong and healthy. Golden cross could create the next bullish mode.
I expect we will see a gold cross on March 9th around the start of the US equity market's trading day.
The upcoming chart pattern could be pretty similar to February 2021. Price target ca. 70k $ then by the end of May.


FUBO OVERSOLD ON LAWSUITCompanies get sued all the time. They hire gangs of lawyers and negotiate settlements, the shares recover, the business grows.
Bouncing off support here, pretty clear buy signal at end of impulsive bear move.
I'm buying for kids' college funds and calls in my trading account.
Not investing advice; do ur due diligence please! GLTA!

PLTR - On the Precipice of Greatness
I jumped into PLTR back in mid/late FEB when it was tanking pretty hard. I've been patiently waiting and pulled the trigger on another lower price point to decrease my DCA. After more waiting... I think we're on the precipice of greatness here with PLTR.
Most of my points are called out above. Some additional notes here.
2 day candles show a LONG stretch of being oversold
Last time we left oversold we saw a 79% pump
We've once again been oversold for a very long stretch
Double bottom established and could give us the momentum we need to break out of the oversold position
Things to keep an eye on:
Would be really nice to see the DMI tick up towards bullish momentum
Keep an eye on the neck line of the W (orange dotted line) - needs to break that to finish the push
Obviously do your own research and due diligence before investing... but as for me... I just like the stock.
-Matt

Very bullish on this oneLooking good on TME in my opinion making all time highs. Very very impressive technicals and especially fundamentals with continuing uptrend of revenue and EPS and would probably fit a CANSLIM stock selection. In terms of pricing, compared to other china stocks like BILI, BIDU, etc. with impressive fundamentals. TME should reach $100 per share as well near their pricings. Probably after this bear market were experiencing right now and low volume, TME would have a high possibikilty it wont go back to this $20 per share right now. Addition to that, you can see a huge volume the other day which represents intstitutional entry plus RSI indicates were almost on the oversold side which is a good entry point.

EURUSD 1H ADX TRADING STRATEGYADX STRATEGY RULES
1 - Add ADX & RSI Indicators to chart.
2 - Add Horizontal line with Coordinates of 25 to ADX.
3 - Wait for RSI to go below oversold 20 level.
4 - Wait for ADX line to rise above 25 level for ENTRY.
5 - SL above Fractal High.
6 - TP EXIT when ADX falls below 25 level.

Mohawk is oversold. Is this one ready to run up?I have changed up how to best display projected movement. In the case of MHK, 4 of my algorithms signaled a BUY on March 24, 2021. Equities nearly always obey the signal and move up, but sometimes it may continue to move down first.
I have placed two red boxes and two green boxes on the chart. The larger red box depicts all of the historical movement, from a percentage standpoint, that this stock has moved on the 3 Hour chart after a BUY signal occurred. Therefore, this box represents 100% of previous movement downward before the stock finally moved upward. The smaller red box represents 50% of all historical movement downward, before the stock moved upward. The smaller box is more of a precise target for the potential bottom in this instance.
The green boxes represent the same thing. In this instance, the smaller green box would be my projected target for the final top.
The black dotted arrow represents median historical movement. Medians are a good metric, but they are just one of many I use when forecasting future movement.
As always, the stock could rise the very next bar after the signal without looking back (therefore the red boxes would not come into play) or the stock may never rise (and the green boxes may never come into play).
All statistics and the full analysis are available for free as always at the site below.

Finally in the zone of interestFrom overbought ATH around 61780 price fell down to oversold and showing us bullish divergence on 4H RSI. When we consider strong support FIBO zone around 52.4K we get great probability for trade with minimal risk. Longs positions are starting stabilize too. (green line above charts). After all of that I will still opening only a small position of my account to leave room for further maneuvering :D Because the price CAN have many obstacles upwards (56500,59300,60000 and ATH.)
15% of account i long at market price.
Comment below where you will buy or maybe where you will short: D
And if you agree like.
I will update this idea in close future so if you want, follow me.

WDC shines with multi-chart oversold signalsI have changed up how to best display projected movement. In the case of WDC, 5 of my algorithms signaled a BUY on March 23, 2021. Equities nearly always obey the signal and move up, but sometimes it may continue to move down first.
I have placed two red boxes and two green boxes on the chart. The larger red box depicts all of the historical movement, from a percentage standpoint, that this stock has moved on the Hourly chart after a BUY signal occurred. Therefore, this box represents 100% of previous movement downward before the stock finally moved upward. The smaller red box represents 50% of all historical movement downward, before the stock moved upward. The smaller box is more of a precise target for the potential bottom in this instance.
The green boxes represent the same thing. In this instance, the smaller green box would be my projected target for the final top.
The black dotted arrow represents median historical movement. Medians are a good metric, but they are just one of many I use when forecasting future movement.
As always, the stock could rise the very next bar after the signal without looking back (therefore the red boxes would not come into play) or the stock may never rise (and the green boxes may never come into play).
All statistics and the full analysis are available for free as always at the site below.

USDJPY-Weekly Market Analysis-Mar21,Wk4Trendlines are amazing, there are many ways you can use them, for this instance I'm waiting for a shorting opportunity when the candle touches the red line but not closing above it.
When it hit the middle trendline, I'm going to shift my stop-loss to entry and once it reaches the bottom trendline, as long as it closes below the trendline, I'm going to keep the trade, if it doesn't, I'm going to exit my shorting trade and turn it to a buying trade.

EURUSD-Weekly Market Analysis-Mar21,Wk4After a week, EURUSD didn't create a new low on the daily chart. I'm waiting for a counter-trend opportunity. On the 1-hourly chart within the 4-hourly buy zone, there is an opportunity that awaits, at 1.1881 I'm waiting for a buying opportunity. Candle confirmation at that level became important to the trading setup.

YFI - I Yearn For Gains!!
Full disclosure, I bought YFI at $42,900... and am desperately needing a recovery. So I *might* have a slight bias towards seeing a push here... BUT... regardless... I think there are some strong bullish signs in the coming week for YFI.
Lots called out in the graph above so some additional thoughts below to supplement the graph:
There have been other points where a touch on the 50 day sends the price to the upper resistance line
The Stochastic RSI isn't perfect... and the patterns are not exactly the same... but given it's in the same spot as the last big push... there's gas in the tank at it's current position.
There *could* be a possible W forming - we could be at the second touch of the double bottom right now (big speculation there...)
Price is currently respecting gan fan channel - could jump back to median (dotted line) for this next push
Lot's of speculation all around, but I'm hopeful!

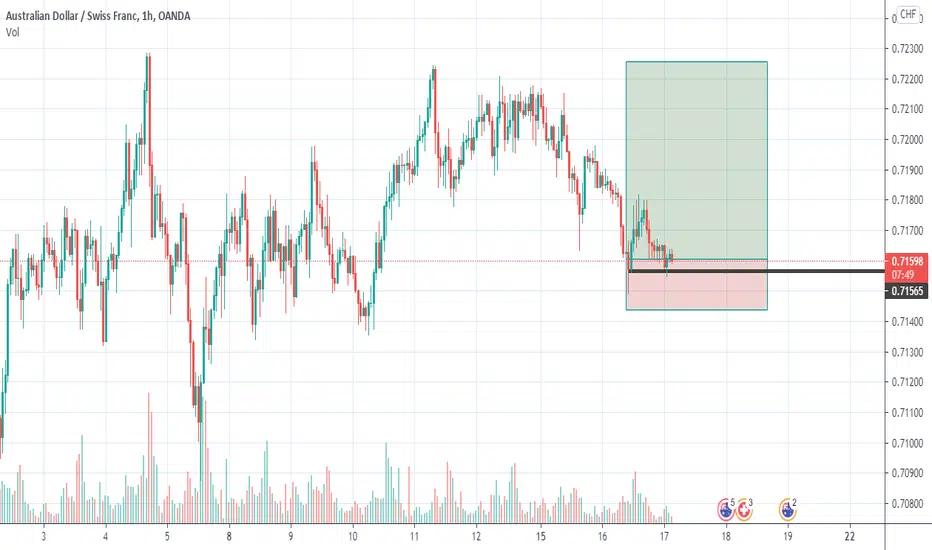
AUDCHFThe pair has been long in H4 TF and now forming a Double bottom. The Price is expected to long to 0.72127. Use risk management.
Looks like it should bounce hereI expect a bounce in this stock. Ever time the RSI hits 30 this stock bounces. We are testing this resistance level for the 3th time now. If it fails the stock can go further down to 50.
Fundamentally i believe AI to be one of the biggest opportunities, maybe even more revolutionary then the internet.

The Regular Divergence (2) Stock price is lower low, but indicator is higher low. The price touches the support trend line.
Tips:
This is index, not a stock. But the tips should apply as well.
2013 dec 13, price and stochastic have divergence.
Stochastic is to value price momentum.
The divergence is a regular divergence. Means the price will bouce back. Here is for price lower low, but indicator higher low.
Stochastic works only for a range price move. For strong trend, not working. Here the indicator value is very low, and the stock not in a strong trend swing, means oversold. More probably to bounce back.
The stock runs in a very long range. The price drops almost on the support trend line.
Over all these, a strong buy hint is here.

4 hour sell technical analysisPresented is the four hour chart with MACD and RSI playouts.
RSI has been trend trading within oversold zone and continues with a confirmed MACD/SIGNAL divergence below zero line.
Two take profit points the first being .95900 with a take profit 2 at .91400 if first support breaks.
Please comment with thoughts and ideas. Thank you!
