The downtrend is coming, not yet!Last week's macroeconomic announcements created support at the price level of 1.1870, which is the lower limit of the downtrend channel. So, from a technical analysis point of view this was almost to be expected. Then looking at the indications of the Stochastic it seems that the upward movement still has a lot of room for development because the index has just come out of the oversold level.
In the case that the downtrend that has been created is valid, and it is not a downward corrective move of the main upward trend, a rise of prices up to the resistance point of 1.2070, so that prices cover almost the entire range of the downtrend channel, it is very likely to be verified.
In the case, now, that the movement within the downward channel is a correction, the point 1.2070 and the possibility of its breaking is the first indication for the future upward movement.
Oversold

RSI highly oversold --> Pullback expectedentry price: 8.75 --> above current price for assurance
Stop loss: 8.25
take profit: around 18 or higher.

The Hidden Divergence (1)Stock price and indicator have hidden divergence. This maybe means the price will extend the trend.
Tips:
This is forex, not a stock. But the tips should apply as well.
2014 Jun 6, price and stochastic have a hidden divergence.
Stochastic is to value price momentum. Also can be treated as if stock overbought or oversold.
The divergence is a hidden divergence. A hidden divergence is for a price higher lower, but indicators are lower low. Or for a price lower high but indicators are higher high.
The hidden divergence means the price will continue the trend.
Here the trend is uptrend, means probably price will go up.
2014 jun 6, stochastic showed oversold, possibly price bounce back.
The price also dropped almost on 50 ma, possibly price bounce back.
It is below 200 ma, should bias on downtrend. But here is a buy hint, so can buy , but not a very strong one.

The Regular Divergence (1)Stock price is lower low, but indicator is higher low. This divergence can be a trading opportunity.
Tips:
This is forex, not a stock. But the tips should apply as well.
2014 apr 28, price and stochastic have divergence.
Stochastic is to value price momentum. Use 8,3,3 as the parameter can wipe out some market noise.
The divergence is a regular divergence. Over 200 ma, should have bias of doing uptrend. Hence, for regular divergence, should only trade when price is lower low, but indicators is higher low.
If below 200 ma, should be reverse, which is for regular divergence, should only trade when price is higher high, but indicator is lower high.
The price also dropped on 50 ma, more probable to bounce back.
Stochastic works only for a range price move. For strong trend, not working. Here the value is about 20, and not in a strong trend swing, means oversold. More probable to bounce back.
There is also a horizontal support below the price.
Over all these, a strong buy hint is here.

ADA new ATH!!? (⊙_⊙;)BINANCE:ADAUSDT BINANCE:ADABTC
Hi guys , As we saw in this week we have finished our main pullback and we are starting to go up generally in crypto market .
For ADA according to what I see in the charts we can go for a new ATH soon , currently in cardano/btc chart we are in a very important level of Demand also we have hit the 0.236 Fibonacci level and showed Resistance to it , this level also matches with 200 4h EMA too and we are in OVER SOLD stage, so we can expect resistance from this level and its a very important level to keep an eye on for now.
Also we have a long time low in ATR that that indicates we will have a huge move soon.
So my suggestion is to have an eye on ADA because we are in a very important level.
If my idea was helpful for you consider liking it ,leaving a comment and following me for more content!! Thanks!! ^_^

PD: Still as bullish as ever. Best entry into the name since NovPD is still one of my favorite picks in 2021. The recent sell-off in high multiple names has wrongfully been aimed at PD. PD has a modest multiple when compared to other software names/peers. The stock dipped into the oversold region of RSI and is now just barely above it. Also very bullish that it held the 200SMA. Please look at my earlier PD notes to see my full thesis on the name.

Zillow Cup of TeaCup of Tea
How I'm expecting Zillow to move in the next 2-3 mos.
Let's see how it goes.
Slow for my liking but tasty enough to dip


TSLA very clear 5 waves down - The 'A' wave may be finished TSLA very clear 5 waves down and measurement levels are clean.
5 waves down is corrective and has 2 possible outcomes, this being the less bearish of the 2 and i lean towards this more conservative count for now.
It looks like tsla has put in an A wave of an ABC correction, and its very possible the A wave down is done.
Looking for a B wave bounce to start soon.
Other tickers as well as the QQQ have very similar 5 waves down.
Price bounced at the 50% fib of an extension fib setup. The longer term target for this fib setup is 1068 as long as 465 doesnt break.
Trendline Support.
Volume climax at lows.
RSI and Stoch oversold.
Watching for the start of the B wave up. Resistance into recent supply levels would make sense possibly up to 840.

$GLBS BULLISH REVERSAL $4 to $20 to $95The chart pattern is a falling wedge, it’s a bullish reversal. The price has been bouncing between support and resistance and today we can confirm its a buying opportunity. I have continued to buy and bought more at the $4.00 range.
The rsi is oversold on all time frames, the emas were trashed, the volume is high, the OBV is down, the only indicator was the chart pattern connecting trendlines.
Currently the price is $4.00, my forecast on this stock in the next 24 months is a target of $24.00. And the highest possible target is $95.
Float percentage of total shares outstanding is the percentage of float shares relative to the total shares outstanding. As of today, Globus Maritime's float shares is 9.61 Mil. Globus Maritime's total shares outstanding is 9.62 Mil. Globus Maritime's float percentage of total shares outstanding is 99.85%.
Insider Ownership is the percentage of shares that are owned by company insiders relative to the total shares outstanding. As of today, Globus Maritime's Insider Ownership is 0.00%.
Institutional Ownership is the percentage of shares that are owned by institutions out of the total shares outstanding. As of today, Globus Maritime's Institutional Ownership is 0.53%.
Short Percentage of Float is the percentage of shares shorted compared to the float. As of today, Globus Maritime's Short Percentage of Float is 18.03%.
Globus Maritime is a dry bulk shipping company. It was impacted by the world shutting down due to Covid-19, bad business decisions such as reverse splits and net loss on sales. However the company was able to finance to expand business operations with a new fleet and they continue to expand. This isn’t a short squeeze opportunity, this is a slow growth opportunity.
When investing always do your own research, you are responsible for your trades. I’m not your financial advisor, im share an idea. And I personally invested in this stock because I believe in it long term. I’m holding, im buying more and its my risk.

FANS is ready for the next reboundAfter the strong performance based on great news in February 21 there was an overreaction by investors that were selling afterwards.
The result was a pull-back to around 1.35 CAD $.
Also based on Stoch RSI indicator the stock is oversold at the moment and seems to be ready for a turnaround.
Today's news regarding the application for U.K. Gambling Licenses is very promising.
It seems to be realistic to me that FANS will be able to climb up to 2.50-3.00 CAD $ by the end of March.

PTON 3day oversold target for longThere are a hand full of prior high flyer names I will be charting, that look like 3day oversold conditions are solid targets for scaling into long positions.
Indicator to calculate relative price level for == 30rsi , is RSI LEVELS
Thanks.

NIO 3day oversold target for longThere are a hand full of prior high flyer names I will be charting, that look like 3day oversold conditions are solid targets for scaling into long positions.
Indicator to calculate relative price level for == 30rsi , is RSI LEVELS
Thanks.

TSLA 3day oversold target for longThere are a hand full of prior high flyer names I will be charting, that look like 3day oversold conditions are solid targets for scaling into long positions.
Indicator to calculate relative price level for == 30rsi , is RSI LEVELS
Thanks.

I Spy Double Bottom, Oversold ConditionRead the chart.
Not investing advice
Trade at ur own risk, GLTA!

$UAVS - If I liked it in the 6's...UAVS is way oversold IMO. I have bought in and sold UAVS for profits a few times now. The first time I bought in was in the low 6's. If I liked it at 6...waiting for funds to settle, I may add a full position to UAVS again tomorrow. I am already holding a (losing) 1/4 position on it now. But I think it's time to go all in again. Will see tomorrow.

AUD-USD Close To Support! Buy!
Hello,Traders!
AUD-USD fell sharply from the recent heights
And even broke the nearest support area
But now, the pair is clearly oversold locally
And the nearest horizontal support is near
Therefore, I will wait till the pair reaches this support
And then I will buy it from support
Buy!
Like, comment and subscribe to boost your trading!
See other ideas below too!

$TRCH Bearish still in playBearish pattern still in play on the daily
Please click a like if you like what you see on our chart

Apple IdeaWhen looking at the 1 week chart we can see more clearly that this recent pullback in price was preceded by a bearish divergence between price action and RSI. We have now entered oversold territory and I think there's a good chance that price will bounce at support however if support is broken we could see an even further pull back to the $100-$110 region.

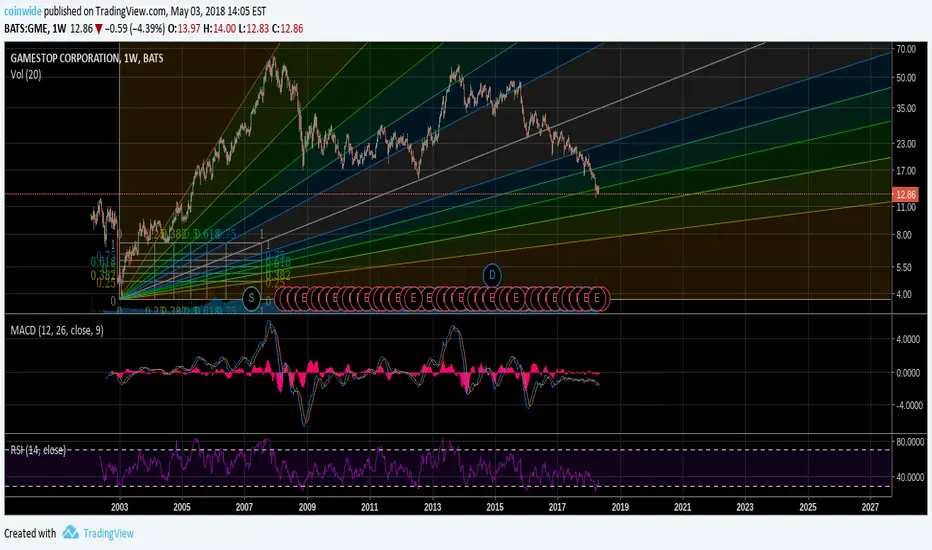
Gamestop at reversal pointEvery 3rd time RSI got below 30 we saw a good bounce
Fib line 0.50 fits bounce too up to 0.75
in the meantime while holding it pays 0.38 USD per share every 3 months
this is not a trading advice - just for my review
Good boarding price before report, thanks to big brother.I find it a buggy thing that the market also sold the NIO because of the TSLA, but the co-movement of the sector has resulted in a good entry.
I think for a number of reasons that, a serious rise in the exchange rate is expected, e.g. the consumer power of the Chinese market, expansion, etc.
Good luck to everyone. (:

BNGO Potential long position around 12.00 supportBNGO broke below the 12.00 support today. Two possible scenarios now, the price further tanks but I would not expect it to dip below 10. I am personally expecting a bounce back after today's dip as:
Not much volume to justify downtrend strength
Stochastic shows oversold signal at support
RSI shows oversold signal at support
No strong downtrend indicator overall
But please keep in mind that the price already went up +2000% in the past 3 months, and that the pharma market took a little hit today.
Trade well!

$CRSR Long if channel is not broken.$CRSR has strong fundamentals, also nice TA setup to make a reverse movement somewhere next week and head to the top of the channel.
1st PT: $44-45
2nd PT: $48-49
My drawings are not perfect, you can adjust accordingly, but the overall pattern is clear as of right now.
Do your own DD, not a financial advice.
