EURAUD - Wait For The Trigger 🏹Hello TradingView Family / Fellow Traders. This is Richard, also known as theSignalyst.
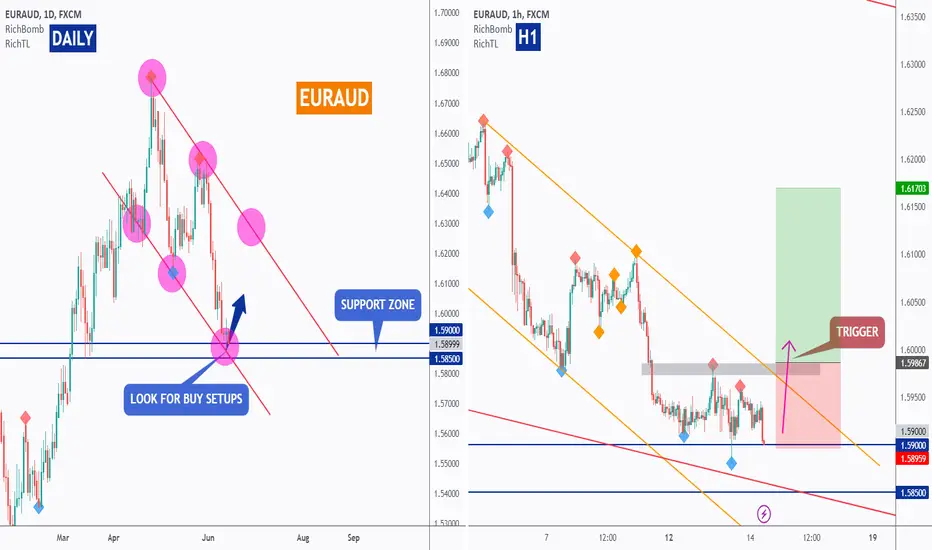
on DAILY: Left Chart
As per my last analysis, we know that EURAUD is sitting around a strong rejection zone as it is the intersection of a horizontal support in blue and a non-horizontal support in red.
So we will be looking for buy setups on lower timeframes.
on H1: Right Chart
EURAUD has been overall bearish medium-term. However, it is diving inside the daily support zone.
🏹 For the bulls to take over , for a potential shift in momentum, we need a break above the last major high in gray and upper orange trendline.
Meanwhile, EURAUD can still trade lower.
📚 Always follow your trading plan regarding entry, risk management, and trade management.
Good luck!
All Strategies Are Good; If Managed Properly!
~Rich
Oversold
BTC/USDTIf StochRSI on weekly will go under 20 level and:
1. The price will stay above aprox. 25k level
2. StochRSI (weekly) will close with red line on one week above 20 level
then
there are great chances that BTC can continue the rally this year.
Happy trading!

at least 20%Analysts downgraded it, but technically and fundamentally, this action has the potential for a significant rise. Furthermore, within its group, it has the strongest fundamentals.

PDD | Finally Oversold | Accumulate LONGPDD Holdings Inc. operates as a commerce company. It owns and operates a portfolio of businesses, including Pinduoduo, a social commerce platform primarily for agriculture in China; and Temu, an online marketplace. The company was formerly known as Pinduoduo Inc. and changed its name to PDD Holdings Inc. in February 2023. PDD Holdings Inc. was incorporated in 2015 and is based in Dublin, Ireland.

EUR-CAD Will Go UP! Buy!
Hello,Traders!
EUR-CAD keeps falling
Down and the pair
Will soon be quite
Oversold so after
The retest of the horizontal
Support at 1.426 from
Where we are likely
To see a bullish correction
Buy!
Like, comment and subscribe to help us grow!
Check out other forecasts below too!

🔥 CFX First Daily Oversold In 2023 Bounce IdeaCFX has seen incredible gains in the start of the year. However, we've been largely been trading rangebound since the March top.
As of today, CFX's daily RSI is on the edge of being oversold. This is the first time since half December that the RSI has hit daily oversold levels. This is significant because it has taken 6 months for it to happen, hence I'm anticipating bulls to step in.
Keep in mind that we're currently in a news-related event, so volatility is to be expected. The signal will activate once the daily RSI has closed below 30.

Does SPY want a correction? Maybe not but it will get one.SPY has had a good run this spring. However, things are changing. Just this week, the debt \
ceiling got raised. The fed will be auctioning large amounts of treasuries to pay bills. This is
money that will not go into the equities markets. Buying volume on a dollar basis will likely go
down as a consequence.
On the daily chart with a double Bollinger Band setup, SPY is more overbought than ever.
The part of the body of the last candle of this past week went outside of both the inner and
outer bands. Looking back this has not occurred in well over a year. Candle wicks did go
outside the bands in late October 22 and mid-December 22. On lower time-frames SPY
has already pulled back into the Bollinger Bands and begun a reversal. I believe that
many traders will take their profits off the table and take another look at bonds and treasuries.
ETFs like TLT and TMF may see significant inflows no matter for stocks in general may not.
I see this as a SPY pullback or correction upcoming for which to take a short trade.
I will look at SPY and QQQ put options with very short DTEs as well as call options on SQQQ.
For stock purchases, I might go with the ETFs SPXS and SPXU. The simple and basic analysis is
their chart shows price candles partially below the lower Bollinger Bands, the inverse of
the SPY. They are oversold and accordingly available for purchase at a discount.

Big Bounce from here Thanks NVDA RSI BounceSo last night we witnessed NVDA we saw NVDA come up from a BULLISH GRAVE. I mean GEEEEEEEZ LA WEEEZ. This is the same bounce that the market seen from META, AMAZON and APPLE . The market was in a slump and then boom tech came into save the day. So as you can see on the 30 mins and hourly channel. We are indeed oversold and this along side with the QQQ being bullish late in th week this will carry over into next week. But here's my outlook on things was we head into WITCHING . Please do not forget. It's only weeks away and it's the same thing from last March . Please do not trade against the market. Trade with the market. The first half of June to me will be bullish. Look out for weakness after that.

$BTC #Bitcoin Stoch RSI At Bottom For 1st Time EVER!-4 Qtr ChartLook at this #Bitcoin chart and tell me when the best time to buy CRYPTOCAP:BTC in the past 2 years was.. YOU ARE NOT LATE lol..
NFA
DYOR
#AirCoin

☆ The Relative Strenght Index (RSI) # on4 ! ☆The Relative Strength Index (RSI)
-
is a popular technical indicator used by traders to identify overbought and oversold conditions in the market. The RSI with a period of 4 is a shorter-term version that can provide more frequent signals.
I use RSI 4 effectively following these steps:
Understanding RSI Basics:
The RSI measures the strength and speed of price movements.
It oscillates between 0 and 100, with values above 89 indicating overbought conditions and values below 11 indicating oversold conditions.
Identifying Overbought and Oversold Conditions:
When the RSI 4 rises above 89, it suggests that the market may be overbought, indicating a potential reversal or a corrective pullback.
When the RSI 4 falls below 11, it suggests that the market may be oversold, indicating a potential buying opportunity.
Confirming Signals with Price Action:
While RSI 4 can provide valuable insights, it is important to confirm its signals with other technical indicators or price action.
Look for additional confirmation such as trendlines, support/resistance levels, or candlestick patterns to strengthen the validity of the RSI signals.
Divergence Analysis:
RSI 4 can also be used to identify bullish or bearish divergences.
Bullish divergence occurs when price makes a lower low while RSI 4 makes a higher low, indicating potential upward momentum.
Bearish divergence occurs when price makes a higher high while RSI 4 makes a lower high, suggesting potential downward pressure.
Setting Stop Loss and Take Profit Levels:
Determine appropriate stop-loss levels to protect your trades in case the market moves against you.
Set take-profit levels based on your risk-reward ratio and the potential of the trade.
Remember, RSI 4 is just one tool in your trading arsenal. It is essential to combine it with other technical indicators, chart patterns, and fundamental analysis for a comprehensive trading strategy. Regularly monitor the performance of RSI 4 in different market conditions and adjust your trading approach accordingly.
Note:
The use of any technical indicator, including RSI 4, does not guarantee successful trades. It is important to practice risk management, conduct thorough analysis, and make informed trading decisions based on a holistic view of the market.
Always remember that no single indicator or strategy can predict market movements with 100% accuracy. Utilize RSI 4 as part of a well-rounded trading methodology, and continually refine your skills and knowledge through experience and ongoing education.
HappyForexTrading ☆ J

Paypal - too cheap? PayPal's stock looks undervalued, trading at 6-year lows and a forward P/E ratio of 12.3, despite a strong Q1 performance with respectable transaction revenues, total payment volume, and growth in value-added services.
Operating expenses are well-managed, contributing to substantial growth in operating income and earnings per share, while consensus estimates suggest mid-to-high teens EPS compound annual growth rate.
Market concerns, such as PayPal's Q2 revenue guidance and increased competition, are offset by the Moderate Buy consensus rating, suggesting a 60.7% upside potential.
The involvement of activist investor Elliott Management and the potential sale of the cross-border payment unit, Xoom, signal strategic changes that could enhance PayPal's performance.
PayPal still rides the wave of the growth in e-commerce, with 12% payment volume increase in Q1 2023, and a rise in peer-to-peer transfers, demonstrating resilience in a challenging macroeconomic environment.
The fundamentals of this company have become detached from the share price, making this a long term buy and hold with hugely asymmetrical risk/return profile.
Shorter term, the move back to the highly developed Point of Control would represent over 20% growth, which I see as a high probability outcome within weeks.

Introducing the Dynamic Fusion OscillatorHello, it's Stock Justice here! In our latest video, we delve into the world of the Dynamic Fusion Oscillator (DFO) - a tool that blends the power of the Relative Strength Index and the Stochastic Oscillator. I walk you through how it works, from understanding these two base components to how we fuse them to create a balanced and sensitive tool for identifying market trends and reversals.
We dive deep into how the DFO uses moving averages to signal potential bullish or bearish trends, and how divergence within the DFO can indicate trend reversals or continuations. I also touch on the DFO's capacity for multi-timeframe analysis, giving you the bigger picture of market trends.
Wrapping up, I remind you of the DFO's value as a versatile trading tool, but also emphasize the importance of using it alongside proper risk management and other technical analysis components. All in all, this video is a must-watch for traders aiming to enrich their toolkit and navigate the market more effectively!

CIPLA AT STRONG SUPPORT ZONE !!!!The price is trading at strong demand zone 850-- 875, Which is multiple time tasted by the price. Price taken support multiple times and bounce back towards the upside level. As we can see that price is trading at lower level and we seen a heavy correction in price from the all time high level of 1185 and now price is trading at 877.
850 --- 875 is strong support zone. If price respects the support level and shows good momentum either forms any bullish pattern or candle with high volume than we can plan the trade for upside with low risk & high Reward Setup.
#CIPLA
👉Price Near support zone of 850--875.
👉Heavy Correction Seen from ATH Level of 1185
👉If Respect the support zone than good bounce back possible.
👉Wait for bullish pattern or candle formation with good volume
👉Track on lower TF for strong reversal
👉A good entry we can see

AUDCAD Oversold Pair with 5:1 RR5:1 Reward:Risk ratio. It is AUDCAD on a daily chart. If this oversold pair does not rise at this level, then the level below is a good level.
AUD is the most oversold than the rest of the G10 FX with an economical growth pattern that has not showed up on the charts yet. What's more, AUD has a lot of padding compared to CAD in its real estate market from its prepayments to help absorb higher rates.

COMPUSDT Initial Long - Oversold1D chart. Posting for future reference. (bored, cant write extensive explanation on :long: decision)

Tips to Help Demystify the RSIPrimary Chart: Tips to Help Demystify the RSI
Introduction to Momentum Indicators
Many indicators exist for technical analysis. And a number of them focus on momentum, which is distinguishable from other core technical concepts such as trend, support and resistance, volatility, and standard deviation. Momentum tools measure the velocity of a directional price move. Using a train as an analogy, momentum considers the speed, velocity and magnitude of the train's movement in a given direction, e.g., north or south. In a sense, it helps determine the strength and speed of the directional travel of the train.
By contrast, trend analysis considers whether a price move is consistently heading in a given direction. A trend can be valid despite corrective retracements, where price retraces a portion of the prior move, consolidates a portion of the prior move, and then resumes movement in the trend's direction. Using the same train analogy, trend analysis considers how effectively and persistently the train is moving in a given direction, such as north or south. Momentum, though, considers the train's speed and velocity in whatever direction the train is moving.
Many momentum indicators also are not limited to analyzing momentum and may have utility as a trend gauge as well. For example, Stochastics, MACD and RSI all have the additional capacity to help analyze trends.
Basic Concepts and Calculation of RSI
Created by J. Welles Wilder, the RSI is one of the most widely used and well-known momentum indicators. The acronym "RSI" means relative strength index. RSI should not be confused with the concept of relative strength, which compares one instrument or security against another to determine its outperformance or underperformance. Some other common momentum indicators that have been in use for many years include the Rate-of Change, Chande Momentum Oscillator, Stochastics, MACD, and CCI. Most momentum indicators, including RSI, share some conceptual aspects, such as overbought and oversold conditions and divergences, even though they may vary in the way they are calculated and interpreted.
Reviewing the way an indicator is calculated can sometimes help to sharpen one's understanding of it and interpret it more effectively. RSI's calculation is not as complex as some indicators. So reviewing its calculation remains an accessible exercise, but this is not essential to mastering the indicator. TradingView's RSI description contains a useful summary of how the indicator is calculated. See the Calculation section of the RSI description at this link: www.tradingview.com(close%2C%2014).
Another excellent description of how RSI is calculated may be found on this reputable technical-analysis website: school.stockcharts.com
To summarize, RSI's basic formula is as follows: RSI = 100 – (100 / 1 + RS), where RS = average gain / average loss.
Using the default lookback period of 14 (note that any lookback period can be selected), the calculation then proceeds to include 14 periods of data in the RS portion of the calculation (average gain / average loss). So the average gain over the past 14 periods is divided by the average loss over the past 14 periods to derive "RS," and then this RS value is plugged into the formula at the start of this paragraph. The subsequent calculations also have a lookback of 14 periods (using the default settings) but smooth the results.
Smoothing of these values then occurs by (1) multiplying the previous average gain by 13 and adding the current period's gain, if any, and dividing that sum by 14, and (2) multiplying the previous average loss by 13 and adding the current period's loss, if any, and dividing that sum by 14. If the lookback period is adjusted from the default of 14, then the formula and smoothing techniques will have to adjust for that different period.
In short, the calculation reveals that RSI's core function is to compare the size of recent gains against the size of recent losses and then normalize that result so the indicator's values may fluctuate between 0 to 100. Note that if a daily period is used, for example, the average day's gain is compared against the average day's loss over the lookback period selected. Similarly, if hours are used, the average hour's gain is compared against the average hour's loss over the relevant lookback period.
RSI can be used on any timeframe, including a 1-minute or 5-minute chart, and simply calculates its values based on the period to which the indicator is applied, based on a default using closing prices for the period specified. With TradingView's RSI indicator, traders have a great deal of flexibility in adjusting such defaults to some other preferred value, so the closing price need not be used—the default can be changed to the open, the high, the low, high+low/2, high+low+close/3, or several other options.
Interpreting RSI's Overbought and Oversold Signals
With some exceptions, the higher-probability RSI overbought (OB) and oversold (OS) signals align with the direction of the trend. The old trading adage remains valid for RSI as with other forms of technical analysis: the trend is your friend. In the chart below, consider the yellow circles flagging OS signals that could have been effective in the Nasdaq 100's uptrend in 2021.
Supplementary Chart A: Example of RSI OS Conditions That Align with an Uptrend and Key Support
As with other technical trade signals, countertrend setups should be avoided in the absence of overwhelming confirmation from other technical evidence. If a countertrend setup is traded, use extra caution and smaller position size. In this context, trading RSI signals against the trend means selling or entering a short or bearish position in an uptrend when an OB signal appears, or it means buying or entering bullish positions in a downtrend when an OS signal appears. It may also mean trading counter-trend positions as soon as RSI begins exiting an OB or OS zone.
Stated differently, trading overbought and oversold signals against the trend will likely result in mounting losses. Countertrend trades require much technical experience and significant trading expertise—and even the most experienced trading veterans and technical experts say that the counter-trend trades tend to be low probability setups. In short, never trade the RSI's OB and OS signals mechanically without considering any other technical evidence.
Supplementary Chart B: NDX OB Condition in an Uptrend
In the chart above, note how the Nasdaq 100 (NDX) reached a fairly high daily RSI reading of 77.17 on July 7, 2021. This chart shows an example of how even very high OB conditions can persist much longer than expected. RSI remained above 70 for over a trading week. And the ensuing pullback was not that significant, and it didn't reverse the uptrend at all. The risk-reward for mechanically trading this setup would have been poor, and stops would probably have been ignored at some point in the days following the signal. For an experienced trader with small position size, perhaps the second RSI peak immediately following the July 7, 2021 peak would have worked for a short-term trade given that a divergence arose (higher price high coinciding with a lower RSI high). But it would still have been a difficult trade requiring excellent timing and precision.
In summary, OB / OS signals should not be interpreted and traded mechanically. The trend and other technical evidence should always be considered. OB / OS signals work best when aligned with the direction of the trend on the relevant time frame. They also work best when taken at crucial support or resistance.
Consider several other tips and tricks when interpreting OB / OS signals on RSI.
1. The importance of an OB / OS signal depends not only on the context of the trend in which it arises but also on the time frame on which it appears and the lookback period used in its calculation. This is intuitive, but it helps to keep this in mind. For example, an OB / OS reading has a greater effect on the weekly or monthly chart than on the daily, and an OB / OS reading has a greater effect on daily chart than on the hourly or other intraday chart. Furthermore, if the RSI lookback period is set to 5 periods on a given time frame, the effect of an OB / OS reading will less significant than if the RSI lookback period is set to 14 (the default setting).
2. Consider past OB / OS readings for the same security or index being considered (using the same time frame for past and current OB / OS readings). Each security or index may have OB / OS levels that differ somewhat from other securities or indices. In addition, the OB / OS readings that are typical for a given a security, index or instrument may vary over time in different market environments. It may help to draw support or resistance lines on the RSI indicator within the same market environment and trend to determine what RSI OB / OS levels are typical. RSI support or resistance levels in an uptrend should not drawn to be applied and used in a downtrend for the same index or security.
Supplementary Chart C.1: RSI Support and Resistance Levels for NDX in 2021 on Daily Chart
Supplementary Chart C.2: Two RSI Downward Trendlines Drawn on BTC's Weekly Chart to Help Identify Resistance
3. Divergences can strengthen the effect of an OB / OS signal. Stated simply, a divergence occurs when the RSI and price are in conflict. For example, consider two or three subsequent higher highs in price that occur (this can happen in an uptrend or a bear rally or in a trading range). When price makes the second or third high, a divergence arises if RSI makes a lower high. Or consider two or three subsequent lower lows in price. When price makes the second or third lower low, a divergence arises if the RSI makes a higher low. A greater number of divergences presents a stronger signal than a lower number of divergences. And having divergences on multiple time frames can also be helpful. Finally, a divergence should not be traded until confirmation comes from price itself, i.e., a trendline or other support / resistance violation.
Supplementary Chart D: Example of RSI Bearish or Negative Divergence at NDX's All-Time High in November 2021
4. OB / OS signals also can be helpful in chop when they arise at the upper boundary of a well-defined trading range. In choppy trading ranges, one has a better trading edge at the edge. OB / OS signals that arise at the edge (at critical support / resistance) are the most useful. But depending on the trading strategy, setups in choppy trading ranges can be more difficult and lower probability than setups in strong trends.
Using RSI as a Trend-Analysis Tool
While primarily a momentum tool, the RSI has trend-analysis aspects. Because the RSI will likely remain in overbought (OB) or oversold (OS) for extended periods, it helps evaluate the strength and duration of price trends.
In an uptrend or bull market, the RSI (daily) tends to remain in the 40 to 90 range with the 35-50 zone acting as support. In a downtrend or bear market the RSI (daily) tends to stay between the 10 to 60 range with the 50-65 zone acting as resistance. These ranges will vary depending on the RSI settings, time frame, and the strength of the security or market’s underlying trend. As mentioned above, RSI readings will also vary from one security or index to another. They also vary in different market environments, e.g., a strong uptrend vs. a weak uptrend will have different OB / OS readings.
So the RSI can help confirm the trend when it moves within the RSI range that is typical of that security or index when trending. As a hypothetical example example, if a major index appears to be making higher highs and lower highs, respecting trendline and other key supports, and showing technical evidence of an uptrend, then RSI can help confirm this trend analysis by marking OS lows within the 35-50 range (perhaps 30 on a volatile pullback). RSI can also help time entries and exits when reaching the area that has been where RSI has found support in its current market environment.
The following points summarize how RSI tends to operate during trending price action:
During an uptrend, RSI will trend within the upper half of the range (roughly), moving into OB territory frequently (and at times persisting in the OB zone) and finding support around 35-50. When RSI finds support around 35-50, this may represent tradeable a price pullback—a retracement of the recent trend’s price move—that may work as a bullish entry if other technical evidence confirms.
During a downtrend, RSI will trend within the lower half of the range (roughly), moving into OS territory frequently (and at times persisting in the OS zone) and finding resistance around 50-65. When RSI finds resistance around 50-65 (sometimes higher given the violent nature of short-squeeze induced bear rallies), this may represent tradeable a price bounce—a retracement of the recent trend’s price move —that may work as a bearish entry if other technical evidence confirms.
RSI, like other indicators, cannot produce perfectly reliable and consistently accurate signals. Like other indicators, it can help identify higher probability trade setups when used correctly and when confirmed with other technical evidence. When considering trade setups in terms of probabilities rather than certainties, traders will find position sizing and risk management to be a vital part of any strategy that relies in part on the RSI.

[BTCUSD] BULL SEASON COMING SOON! 2969$ IS BOTTOM Bitcoin has been in reversal since DEC 17 and now look at weekly chart THE RSI LOOKS OVERSOLD (lowest since 2015)
the chart looks bullish too in the long-term.
Accumulate when Thor hits his hammer

AHCO | Good Long Entry | LONGAdaptHealth Corp., together with its subsidiaries, provides home medical equipment (HME), medical supplies, and home and related services in the United States. The company provides sleep therapy equipment, supplies, and related services, including CPAP and bi-PAP services to individuals suffering from obstructive sleep apnea; medical devices and supplies, including continuous glucose monitors and insulin pumps to patients for the treatment of diabetes; HME to patients discharged from acute care and other facilities; oxygen and related chronic therapy services in the home; and other HME devices and supplies on behalf of chronically ill patients with wound care, urological, incontinence, ostomy, and nutritional supply needs. It serves beneficiaries of Medicare, Medicaid, and commercial insurance payors. The company is headquartered in Plymouth Meeting, Pennsylvania.

BTC 1H Range I find it very interesting just how well BTC can respect the quarterly lines of a range. You can spot certain price action patterns within the overall range but trading within the boundaries of the range can be very beneficial in a sideways environment that we find ourselves in.
When range quarters are hit and coincide with oversold indicator triggers they are great places to go long while we are stuck in this range between 26.5k & 29.2k
Indicators:
RSI
CM_Williams_Vix_Fix

GOLD | Great Entry Point | LONGBarrick Gold Corporation engages in the exploration, mine development, production, and sale of gold and copper properties. It has ownership interests in producing gold mines that are located in Argentina, Canada, Cote d'Ivoire, the Democratic Republic of Congo, the Dominican Republic, Mali, Tanzania, and the United States. The company also has ownership interests in producing copper mines located in Chile, Saudi Arabia, and Zambia; and various other projects located throughout the Americas, Asia, and Africa. Barrick Gold Corporation was founded in 1983 and is based in Toronto, Canada.

CGC | Time to Get High Again | LONGCanopy Growth Corporation, together with its subsidiaries, engages in the production, distribution, and sale of cannabis and hemp-based products for recreational and medical purposes primarily in Canada, the United States, and Germany. It operates through two segments, Global Cannabis and Other Consumer Products. The company's products include dried cannabis flower, extracts and concentrates, beverages, gummies, and vapes. It offers its products under the Tweed, 7ACRES, 7ACRES Craft Collective, DOJA, Ace Valley, Quatreau, Deep Space, First + Free, Surity Pro, Spectrum Therapeutics, Vert, Tokyo Smoke, Twd, Martha Stewart CBD, DNA Genetics, BioSteel, Storz & Bickel, This Works, HiWay, Simple Stash, Whisl, and Truverra brands. The company was formerly known as Tweed Marijuana Inc. and changed its name to Canopy Growth Corporation in September 2015. Canopy Growth Corporation was incorporated in 2009 and is headquartered in Smiths Falls, Canada.

BAX | Catch the Falling Knife | LONGBaxter International Inc., through its subsidiaries, develops and provides a portfolio of healthcare products worldwide. The company offers peritoneal dialysis and hemodialysis, and additional dialysis therapies and services; intravenous therapies, infusion pumps, administration sets, and drug reconstitution devices; remixed and oncology drug platforms, inhaled anesthesia and critical care products and pharmacy compounding services; parenteral nutrition therapies and related products; biological products and medical devices used in surgical procedures for hemostasis, tissue sealing and adhesion prevention; and continuous renal replacement therapies and other organ support therapies focused in the intensive care unit. It also provides connected care solutions, including devices, software, communications, and integration technologies; integrated patient monitoring and diagnostic technologies to help diagnose, treat, and manage a various illness and diseases, including respiratory therapy, cardiology, vision screening, and physical assessment; surgical video technologies, tables, lights, pendants, precision positioning devices and other accessories. In addition, the company offers contracted services to various pharmaceutical and biopharmaceutical companies. Its products are used in hospitals, kidney dialysis centers, nursing homes, rehabilitation centers, doctors' offices, and patients at home under physician supervision. The company sells its products through direct sales force, as well as through independent distributors, drug wholesalers, and specialty pharmacy or other alternate site providers in approximately 100 countries. It has an agreement with Celerity Pharmaceutical, LLC to develop acute care generic injectable premix and oncolytic molecules. Baxter International Inc. was incorporated in 1931 and is headquartered in Deerfield, Illinois.

BDRY | Loading Time Again | LONGThe fund seeks to achieve its investment objective by investing substantially all of its assets in the Freight Futures currently constituting the Benchmark Portfolio. The Benchmark Portfolio includes a combination of Capesize, Panamax and Supramax Freight Futures.
