Palladium Futures (PA1!) Approach Key Supply ZonePalladium Futures (PA1!) Approach Key Supply Zone: Is a Reversal Imminent?
June 30, 2025 – Palladium Futures (PA1!) opened the new trading week with a bullish candle, reaching a fresh high at 1,161 after last week’s uncertain Doji rejection near 1,193.5. The metal is now approaching a critical supply zone between 1,199 and 1,255, where traders should watch for potential reversals.
Key Technical Levels in Play
Current Price Action: After a strong push today, PA1! is testing higher levels, but the previous week’s Doji near 1,193.5 suggests hesitation among buyers.
Supply Zone (1,199 – 1,255): This area has not acted as resistance previously, and with price nearing it, a pullback or reversal could be in play.
Daily & Weekly Timeframes: The daily chart shows steady bullish momentum, but the weekly reveals a bearish divergence in Non-Commercial (smart money) positions—raising caution.
COT Report Signals Warning Signs
The latest Commitment of Traders (COT) report reveals interesting dynamics:
Commercials (Hedgers): At their lowest levels since February, suggesting producers are hedging aggressively at these prices.
Non-Commercials (Large Speculators): Still holding elevated positions but showing divergence—price is rising while their net-long exposure weakens.
Retail Traders: Remain bullish, which often acts as a contrarian signal when combined with Commercial hedging.
What’s Next for Palladium?
Given the confluence of factors:
Supply Zone Resistance (1,199 – 1,255): A logical area for profit-taking or short entries.
Bearish Divergence in Non-Commercials: Suggests weakening bullish conviction.
Commercials Hedging at Highs: Indicates potential downside ahead.
✅ Please share your thoughts about CL1! in the comments section below and HIT LIKE if you appreciate my analysis. Don't forget to FOLLOW ME; you will help us a lot with this small contribution.
Pa1

Which Leads the Pack?Looking at the cyclicality of the precious metals complex and which moves first, vs lag

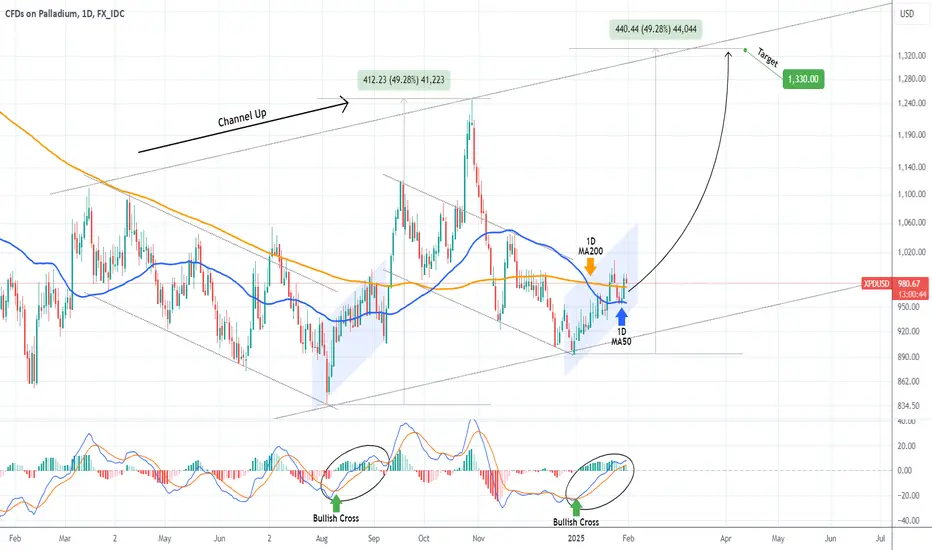
PALLADIUM Strong buy signal on the Channel Up bottom.Palladium (XPDUSD) has been trading within a long-term Channel Up, which priced its most recent Higher Low exactly a month ago (Dec 31). This coincided with a 1D MACD Bullish Cross, a formation that was also present during the pattern's previous Higher Low on August 05 2024.
This resulted in a similar Channel rebound, that initiated the new Bullish Leg, which eventually peaked after a +49.28% rise. We expect a similar technical reaction, thus turning bullish on Palladium, targeting 1330.
-------------------------------------------------------------------------------
** Please LIKE 👍, FOLLOW ✅, SHARE 🙌 and COMMENT ✍ if you enjoy this idea! Also share your ideas and charts in the comments section below! This is best way to keep it relevant, support us, keep the content here free and allow the idea to reach as many people as possible. **
-------------------------------------------------------------------------------
💸💸💸💸💸💸
👇 👇 👇 👇 👇 👇
PALLADIUM | XPDUSD: Prepare to SELL!Over the next couple of weeks, be ready to sell Palladium on the pullback! This is a ERL to IRL to ERL move in the making! Don't miss it!
Check the comments section below for updates regarding this analysis throughout the week.
Enjoy!
May profits be upon you.
Leave any questions or comments in the comment section.
I appreciate any feedback from my viewers!
Like and/or subscribe if you want more accurate analysis.
Thank you so much!
Disclaimer:
I do not provide personal investment advice and I am not a qualified licensed investment advisor.
All information found here, including any ideas, opinions, views, predictions, forecasts, commentaries, suggestions, expressed or implied herein, are for informational, entertainment or educational purposes only and should not be construed as personal investment advice. While the information provided is believed to be accurate, it may include errors or inaccuracies.
I will not and cannot be held liable for any actions you take as a result of anything you read here.
Conduct your own due diligence, or consult a licensed financial advisor or broker before making any and all investment decisions. Any investments, trades, speculations, or decisions made on the basis of any information found on this channel, expressed or implied herein, are committed at your own risk, financial or otherwise.

Palladium: Analyzing the Recent Surge in PricesSince the beginning of August 2024, Palladium has experienced a notable surge in value, reaching approximately $1,250 today. This strong bullish rally signals renewed interest in the precious metal, driven by various market dynamics. However, as the price approaches a critical supply area, traders must exercise caution and prepare for potential market reversals.
Price Movement and Historical Context
The recent price increase in Palladium has not gone unnoticed, and it coincides with a historical trend. Over the past five years, data shows that Palladium has typically encountered a reversal in value around this time of year. This historical pattern serves as a vital reference point for traders considering their next moves.
Evaluating Supply Areas and Potential Reversals
As Palladium nears a significant supply area, it becomes essential to analyze price action carefully. Before contemplating any short positions, it is prudent to wait for a clear bearish pattern to emerge. This approach minimizes the risk of entering prematurely, particularly in a market characterized by bullish momentum.
Commitment of Traders (COT) Report Insights
The latest Commitment of Traders (COT) report reveals contrasting positions among market participants. Retail traders appear to be holding long positions, indicating optimism regarding Palladium's future performance. Conversely, "smart money" or institutional investors have begun to build bearish positions, suggesting that they anticipate a potential downturn. This divergence in sentiment may create a volatile environment as both sides adjust their strategies.
The Importance of Patience
In the current landscape, patience is crucial. Rushing into trades without solid confirmation can lead to unfavorable outcomes. By waiting for a clear bearish signal, traders can better position themselves for potential market reversals. This disciplined approach aligns with the principles of risk management and enhances the chances of executing successful trades.
Conclusion
In summary, Palladium's recent rally to $1,250 places it at a critical juncture. As it approaches a historically significant supply area, traders must remain vigilant and analytical. Observing the emergence of a bearish pattern, coupled with insights from the COT report, will be essential in determining the appropriate timing for any potential short positions.
With patience and a strategic mindset, traders can navigate the current market conditions effectively. What are your thoughts on Palladium's trajectory, and how do you plan to position yourself in this evolving landscape?
✅ Please share your thoughts about PA1! in the comments section below and HIT LIKE if you appreciate my analysis. Don't forget to FOLLOW ME; you will help us a lot with this small contribution.

PALLADIUM Bullish Cross on MACD sets the tone.Palladium (XPDUSD) has been rising since the 1D Golden Cross (October 07) and on top of the 1D MA50 (blue trend-line) since September 09. We view this as the emergence of a Channel Up, currently on its 2nd Bullish Leg, aiming for the next Higher High.
The 1D MACD is on a Bullish Cross, and that's all we need to confirm the continuation of the rise. Our first Target is near the top (Higher Highs trend-line) at 1200. After that and if a potential subsequent pull-back holds the green zone, we will turn bullish again towards 1270.
-------------------------------------------------------------------------------
** Please LIKE 👍, FOLLOW ✅, SHARE 🙌 and COMMENT ✍ if you enjoy this idea! Also share your ideas and charts in the comments section below! This is best way to keep it relevant, support us, keep the content here free and allow the idea to reach as many people as possible. **
-------------------------------------------------------------------------------
💸💸💸💸💸💸
👇 👇 👇 👇 👇 👇

Ducks in A Barrel Long Setups - BTC, SOL, TON & PADISCLAIMER: This is not trade advice. This for educational purposes only to show how I am looking to participate in these markets. Trading involves significant risk, do your own homework and due diligence.
Ducks in a Barrel Weekly-Daily Strategy
LONGS: BTC, SOL, TON
SHORT: PA
LONGS:
The crypto market is overall in a strong up trend based on weekly MA's sloping up. We see that BTC, SOL & TON are undervalued vs the price of Gold and Treasuries, and are oversold on stochastic. If we see a trend change to the upside on the Daily chart, I'll look to long these markets. I admit, I'd like to see sentiment more bearish, as currently sentiment is in the middle of the road. Perhaps one more flush to the downside would create some panic and bearish sentiment, which would make this trade idea even more valid.
SHORTS:
Palladium is in a strong weekly downtrend. Right now we are overvalued vs treasuries, but not yet overvalued vs gold or overbought. I'd like to see this market get overbought & overvalued vs gold to qualify looking for shorts on the daily time frame.
Good luck & Good trading.

PALLADIUM Will be among the biggest winners of this correction.Palladium (XPDUSD) is in the process of forming a Double Bottom on February's Low, following the rejection on the 1W MA50 (blue trend-line). That level has been unbroken as a Resistance since the week of October 10 2022. Once the 1W MA50 breaks, we will have a confirmed buy signal, whose first emergence was when the 1W RSI formed Higher Lows against the price's Lower Lows, which is a Bullish Divergence.
Technically this is a recurring cyclical bottom formed on a 6-year Cycle as the previous ones (January 11 2026 and December 01 2008). All took place on a 1W RSI Bullish Divergence. We expect Palladium to reach at least the 'Russia-Ukraine war peak' at 3450 by mid 2026 - mid 2027.
-------------------------------------------------------------------------------
** Please LIKE 👍, FOLLOW ✅, SHARE 🙌 and COMMENT ✍ if you enjoy this idea! Also share your ideas and charts in the comments section below! This is best way to keep it relevant, support us, keep the content here free and allow the idea to reach as many people as possible. **
-------------------------------------------------------------------------------
💸💸💸💸💸💸
👇 👇 👇 👇 👇 👇

PALLADIUM Trend changing from bearish to bullish.Palladium (XPDUSD) gave us the most optimal sell entry on our March 15 (see chart below) sell signal:
Now however it is time to take profit on that trade before the projected Target as the 1D RSI Double Bottomed, while the price is on Lower Lows. Even though this isn't a direct Bullish Divergence, when RSI Double Bottoms were formed along price Lower Lows, Palladium always started a rally, at a minimum of +21.30%.
As a result, since the 1D MA50 (blue trend-line) and the 1D MA200 (orange trend-line) are squeezed the closest they've been to each other since November 2022, we turn bullish now, targeting 1090 (+21.30% rise).
-------------------------------------------------------------------------------
** Please LIKE 👍, FOLLOW ✅, SHARE 🙌 and COMMENT ✍ if you enjoy this idea! Also share your ideas and charts in the comments section below! This is best way to keep it relevant, support us, keep the content here free and allow the idea to reach as many people as possible. **
-------------------------------------------------------------------------------
💸💸💸💸💸💸
👇 👇 👇 👇 👇 👇

XPDUSD Sell opportunity near the 1D MA200.Palladium (XPDUSD) has been trading within a Channel Down pattern since the October 04 2022 High and the recent Feb 13 2024 Low rally is approaching the 1D MA200 (orange trend-line). This is where the last Lower High of the Channel Down was priced (Dec 22 2023), thus a sell opportunity is being presented. On top of that, the 1D RSI just hit the 70.00 overbought barrier.
As a result, we turn bearish on Palladium, targeting just above the Support 1 level at 865.00. We will turn bullish only if the price breaks above Resistance 1 and then pulls back to the 1D MA50 (blue trend-line), targeting 1630 (just below Resistance 2).
-------------------------------------------------------------------------------
** Please LIKE 👍, FOLLOW ✅, SHARE 🙌 and COMMENT ✍ if you enjoy this idea! Also share your ideas and charts in the comments section below! This is best way to keep it relevant, support us, keep the content here free and allow the idea to reach as many people as possible. **
-------------------------------------------------------------------------------
💸💸💸💸💸💸
👇 👇 👇 👇 👇 👇

Palladium is on secular bull and has a lot to go!/Palladium is the best commodity in town, in an ever rising trend since inception and with another 8/10 years to go...

Palladim UpdatePalladium is one of the most clearly bullish commods in a secular bull market... could see around 1k if current support goes (which seems likely at the moment)...

Palladium: Time for the Turnaround! 🔄Palladium is heading a little further downwards: the price is now drilling deeper and deeper into our turquoise Target Zone (coordinates: $1092 - $997). We expect that the low of wave B in turquoise will be deposited within this price range and that the trend reversal to the north will then succeed, which should subsequently bring us the price increases in wave C in turquoise. All technical conditions have now been met for this low; however, we allow the price to move a little lower again within our Zone. To hedge or minimize the risk of long trades, a stop 1% below the lower edge of the Zone can be placed. However, if the primarily expected bullish trend reversal succeeds, the metal should soon break above the resistance at $1257 and thus gain fresh upward momentum.

XPDUSD on the verge of a long-term bullish break-out.Palladium (XPDUSD) has been trading within a Channel Down pattern since the October 04 2022 High. Today though, the price broke, marginally so far, above it for the first time after a strong post-Fed 1D candle. This rise was initiated on a Lower Lows trend-line but on an underlying Bullish Divergence as the 1D RSI was during the same period on Higher Lows.
This was the first signal of a potential long-term bullish break-out and a break (and 1D candle closing) above both the Channel Down and more importantly the 0.382 Fibonacci retracement level (which is where the April 18 2023 High was rejected), will be the confirmation.
If it happens (closing 1D candle above it), then we will buy and target the 1D MA200 (orange trend-line) at 1255.00, which is slightly below Resistance 1 (1291.00). A further closing above Resistance 1, will be new break-out buy entry, with which we will target slightly below Resistance 2 at 1625.00.
-------------------------------------------------------------------------------
** Please LIKE 👍, FOLLOW ✅, SHARE 🙌 and COMMENT ✍ if you enjoy this idea! Also share your ideas and charts in the comments section below! This is best way to keep it relevant, support us, keep the content here free and allow the idea to reach as many people as possible. **
-------------------------------------------------------------------------------
💸💸💸💸💸💸
👇 👇 👇 👇 👇 👇

XPDUSD: Engage above or below this Channel. Neutral within.Palladium has been trading relatively sideways as its inside a low slope Channel Down pattern since June 27th. There is no surprise that the 1D technical outlook is neutral (RSI = 54.874, MACD = -7.340, ADX = 26.821). Consequently you can scalp the Channel's range on the short-term on trade the direction of the breakout on the longer one.
If the price delivers a 1D candle closing over the top of the Channel Down (and most likely the 1D MA100), buy and target the 1D MA200 (TP = 1,400). If the price delivers a 1D candle closing under the bottom of the Channel Down, sell and target the end of a -26% decline (TP = 985.00).
## If you like our free content follow our profile to get more daily ideas. ##
## Comments and likes are greatly appreciated. ##

Palladium: Early Bird? 🐦Primarily, we expect Palladium to move downwards once more to dive into the yellow zone between $1176 and $1088. There, it should finish wave v in green as well as wave (b) in blue before taking off in the direction of $1577. However, there is a high 48% chance of the metal being an early bird. In that case, Palladium would have already concluded wave Alt.v in green and would thus directly start the ascent, skipping the yellow zone.

PA1!3.26.23 I had technical problems Uploading Videos yesterday..... this is Sunday and I managed to do one more video here to give you a perspective on how I might look at the market and judge Market behavior to find trade location. I should not have Determined that the market was going higher on the Thursday video. I show you why that is on today's video. My message is that even if you get into trouble or make some mistakes... whether they're due to the market or to you.... the tools can help you get out of trouble... and even find you a better trade location.... or tell you when you should be a seller when you started out being a buyer.... in the analysis should include A good entry with a small stop.... and a reasonable target. It turns out that the best trade would have been the long trade near the end of the trading day once the market traded down to where it had gapped higher days earlier. This was a tough video for me.... so the best I can do is just read it whether it's looking at gaps or extensions or ABCD patterns or Retracement patterns.... it's hard to come up with a way of trading without actually reading and interpreting how the Market's moving in real time. I think it takes Perseverance and caution. I pretty much feel that if I lose money in the market... it's because I miscalculated something..... it's not my tools . I don't even blame the buyers or sellers on the other side of my trade.... loss Below my stop Is almost always my mistake. If I'm getting a run of 1/1 trades....I'm doing something wrong, I'm out of sync. Or it's something That is off on my end. Wait for the good trades.

PA1!3.23.23 Palladium can be a very volatile market and this is what makes it very appealing... if you can afford it and you're comfortable with your trading. The details are in the video.... and I show A few opportunities to compare this market when it's ranging... which is A little different from what's going on now when we have a fairly solid support resistance line and possibly An inverse head and shoulders pattern.

Palladium ready for some upside?Palladium - Intraday - We look to Buy at 1474.1 (stop at 1450.1)
Short term bias has turned positive.
Previous resistance at 1475 now becomes support.
We are trading at oversold extremes.
We look to buy dips.
We look for gains to be extended today.
Our profit targets will be 1534.1 and 1544.1
Resistance: 1515 / 1527 / 1540
Support: 1490 / 1475 / 1450
Please be advised that the information presented on TradingView is provided to Vantage (‘Vantage Global Limited’, ‘we’) by a third-party provider (‘Signal Centre’). Please be reminded that you are solely responsible for the trading decisions on your account. There is a very high degree of risk involved in trading. Any information and/or content is intended entirely for research, educational and informational purposes only and does not constitute investment or consultation advice or investment strategy. The information is not tailored to the investment needs of any specific person and therefore does not involve a consideration of any of the investment objectives, financial situation or needs of any viewer that may receive it. Kindly also note that past performance is not a reliable indicator of future results. Actual results may differ materially from those anticipated in forward-looking or past performance statements. We assume no liability as to the accuracy or completeness of any of the information and/or content provided herein and the Company cannot be held responsible for any omission, mistake nor for any loss or damage including without limitation to any loss of profit which may arise from reliance on any information supplied by Signal Centre.

PA1!3.15.23 Palladium made a long series of lower lows and lower highs until it traded down to the 618 retracement, I showed you how to draw a channel line using Andrews Forks,,, because it was easy to demonstrate on this particular chart. normally I do not like nor do I use channel lines at this stage of my life. In this case however it's significant that price could trade outside the Channel. I show you on the video what really could have been A long trade before the Traded above the channel.... which actually happened today after a long swing of lower lows and lower highs. the details are in the video. I'm sorry this dragged on in such a slow manner tonight but I was too tired to really do this on one hand, But I didn't want to redraw the channel lines and go through the description of this again... so here is the post.

Palladium setting a very big sell signal to $880Descending triangle has formed on the weekly chart for Palladium
Last week, was a breakout to the downside.
200 >21> 7 - Red background
RSI <50 lower highs
Bearish
Target $880
WHY WOULD Palladium go down?
I can't tell you with any certainties why it's coming down but I can think of a few potential factors like:
~ Lower demand for Palladium as an investor point of view
~ There is an increase in the supply of palladium - I assume with all of the automotive catalysts and with the higher confidence in electric vehicles (cough Tesla)
~ Interest rate changes with there talks about inflationary measures and interest rate drops, this can result in a drop in Palladium prices
~ Technological advancements reducing the need for palladium. For example, they may be using alternatives like Rhodium, Iron, PLatinum for catalysts in newer vehicles that contain less palladium.

Palladium Futures ( PA1! ), H4 Potential for Bearish DropTitle: Palladium Futures ( PA1! ), H4 Potential for Bearish Drop
Type: Bearish Drop
Resistance: 1839.0
Pivot: 1640.5
Support: 1734.5
Preferred case: On the H4 chart, we have a bearish bias. To add confluence to this, price is crossing below the Ichimoku cloud which indicates a bearish market. If this bearish momentum continues, expect price to possibly break the support at 1734.5, where the 61.8% Fibonacci line is before heading towards the pivot at 1640.5, where the previous swing low is.
Alternative scenario: Price may possibly head back up towards the resistance at 1839.0, where the 50% Fibonacci line is.
Fundamentals: There are no major news.

Palladium Futures ( PA1! ), H4 Potential for Bullish RiseTitle: Palladium Futures ( PA1! ), H4 Potential for Bullish Rise
Type: Bullish Rise
Resistance: 1835.0
Pivot: 1734.5
Support: 1656.5
Preferred case: On the H4 chart, we have a bullish bias. To add confluence to this, price is crossing above the Ichimoku cloud which indicates a bullish market. If this bullish momentum continues, expect price to possibly continue heading towards the resistance at 1835.0, where the 78.6% Fibonacci projection line is.
Alternative scenario: Price may possibly head back down towards the pivot at 1734.5, where the 61.8% Fibonacci line is
Fundamentals: There are no major news.
