$BANANA – Gift Below $30, Trend Reversal Confirmed
BINANCE:BANANAUSDT under $30 feels like a gift.
Starting to build here, and if price dips back into the purple zone, I’ll keep adding.
Monthly trend is active off the lows—this looks like a clear reversal. If it holds, I expect new highs over the next 5 months.
Not sure if $22 gets retested, but if it does, that’ll be a major area of interest.
Strong coin. Strong setup. Time to act.
Community ideas

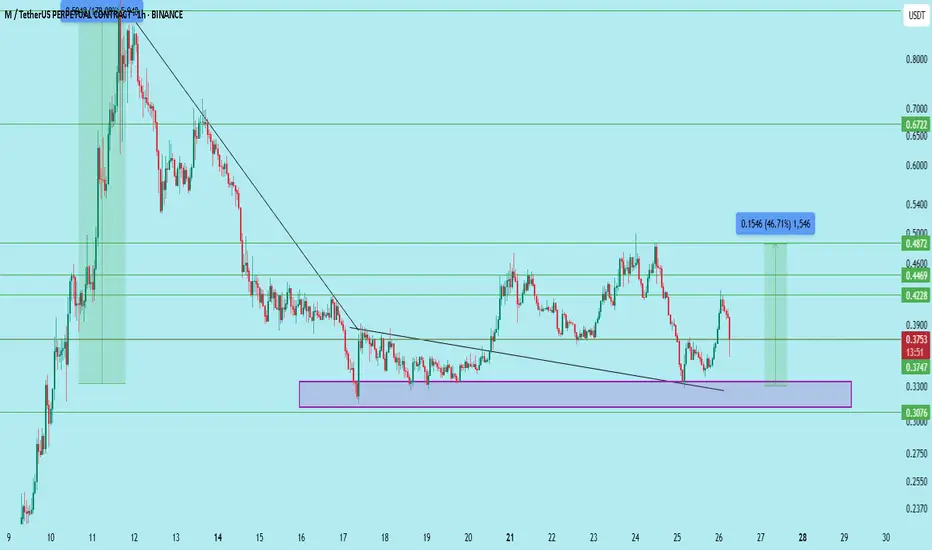
M/USDT — Demand Zone Retest with Strong Risk-Reward$M/USDT is retesting a significant demand zone (0.3210–0.3352) after a breakout and prior rally. This level previously sparked a major impulse move, and price has respected it again on the recent pullback.
Trade Setup
Entry: 0.330–0.345 (highlighted rectangle)
Stop Loss: Below 0.3076
Targets: 0.3747, 0.4228, 0.4469, 0.4872
Long-term Target: 0.6772
Structure
The setup offers nearly 46% upside to the first target and 100%+ to the long-term level. Retest and hold of the demand zone confirms bullish strength with a clean invalidation below 0.3076.
DYOR | Not Financial Advice
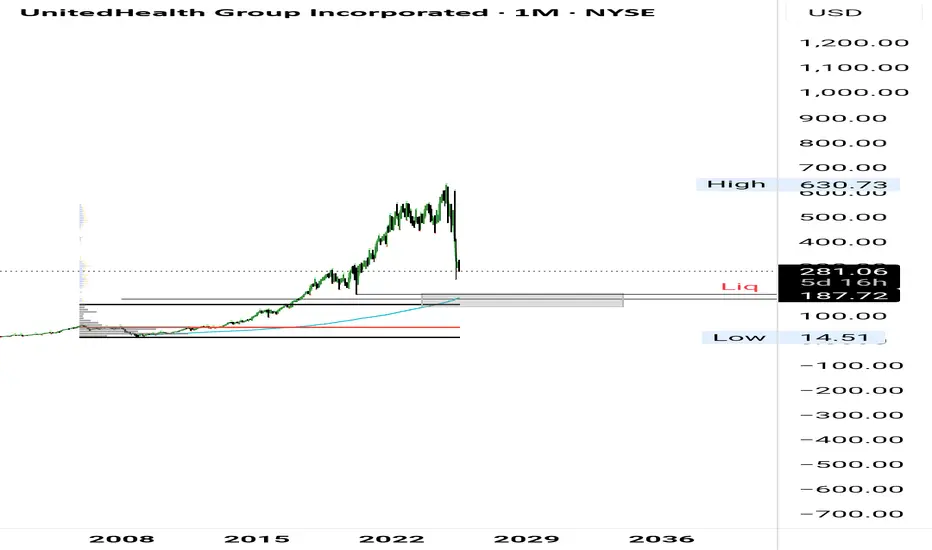
UNH Long Setup BuildingStill expecting more downside. Area of interest isn't far—anchored VWAP, VAH, 0.75 fib, and a possible liquidity sweep all line up there.
FET — The AI narrative isn't over yetFET is still being held back by the 0.75–0.80 zone, but bulls are not giving up. On the daily timeframe, a trend reversal is emerging based on the moving averages. A breakout above resistance could send the price toward the $1 area — a potential 50–60% gain, which looks quite attractive for a spot long. Support lies at 0.67–0.70. With multiple attempts to break through, there’s a strong chance the next test of the 0.80 zone will lead to a breakout.
Entry on confirmation above $0.80, targeting $1.20

SOUN is about to enter the Wyckoff Markup phaseThis is a classic Wyckoff setup—accumulation, SOS, then a shallow pullback on dead volume.

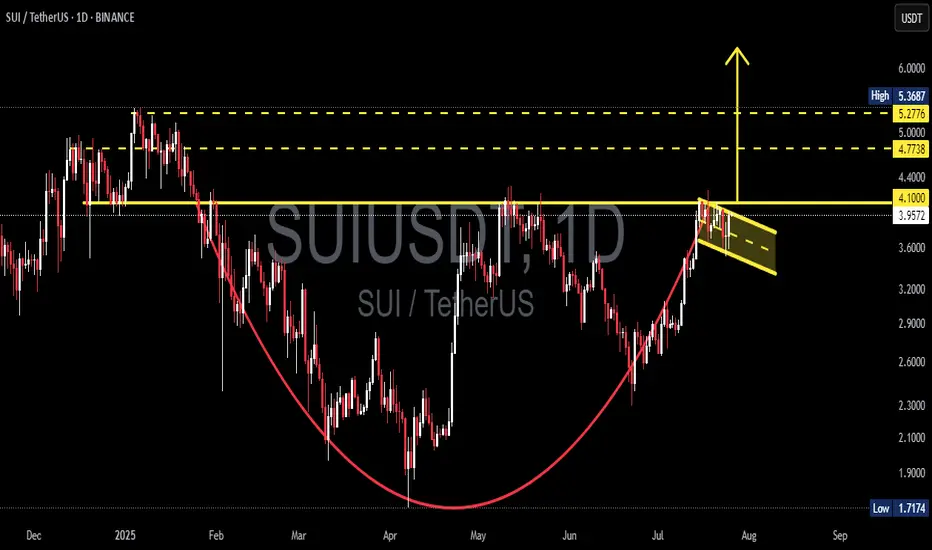
SUI/USDT Massive Cup and Handle Pattern Unfolding Is a Breakout?🧠 Technical Overview:
The daily chart of SUI/USDT showcases a textbook formation of the Cup and Handle pattern — a powerful bullish continuation signal that often precedes explosive upside moves.
The “Cup” took shape between January and July 2025, reflecting a deep rounding bottom. This indicates a long-term accumulation phase where bears gradually lose control.
The “Handle” is currently forming as a downward-sloping consolidation channel, often known as a bullish flag, which is typically the final pause before a breakout.
🔍 Key Technical Levels:
Current Price: $3.9661
Support Zone: $3.96
Major Resistance Levels to Watch:
$4.10 (handle resistance & breakout trigger)
$4.40 (local structural high)
$4.77 (previous high & fib extension zone)
$5.00 (psychological level)
$5.36 (measured move target from cup breakout)
---
🟢 Bullish Scenario: Breakout Incoming
If price breaks and closes above the handle resistance around $4.10, backed by increasing volume:
This confirms the Cup and Handle breakout.
Expect a rapid move toward $4.77 – $5.36 in the short to mid term.
The height of the cup projected upward gives a target of approximately +35% gain from breakout point.
🔔 Watch for:
Bullish engulfing candles
Volume spike during breakout
Break of upper trendline from the handle
---
🔴 Bearish Scenario: Breakdown Risk
If the price fails to hold the $3.96 support and breaks down from the handle channel:
Price may retest lower support zones near $3.60 or even $3.20
However, as long as the cup’s base at ~$2.50 holds, the macro bullish structure remains valid.
⚠️ Invalidation: A daily close below $3.60 would invalidate the short-term bullish setup.
---
📊 Pattern Psychology:
The Cup and Handle pattern reflects investor accumulation, shakeout, and renewed confidence. This is often seen in strong uptrending markets — and the current structure suggests that bulls are quietly preparing for a potential breakout.
---
📅 Timing Outlook:
Handle formations typically last between 1–3 weeks. If this timeline holds, a breakout could occur before mid-August 2025.
---
✅ Conclusion:
The technical setup for SUI/USDT is extremely compelling. With a strong Cup and Handle pattern nearing completion, and key resistance just overhead, traders should prepare for potential breakout conditions. A confirmed move above $4.10 could trigger a bullish wave toward $5.00+.
📌 Set alerts. Manage risk. And don’t ignore the volume.
#SUI #SUIUSDT #CryptoBreakout #CupAndHandle #BullishSetup #CryptoChartPatterns #AltcoinAnalysis #TechnicalAnalysis #BreakoutTrade
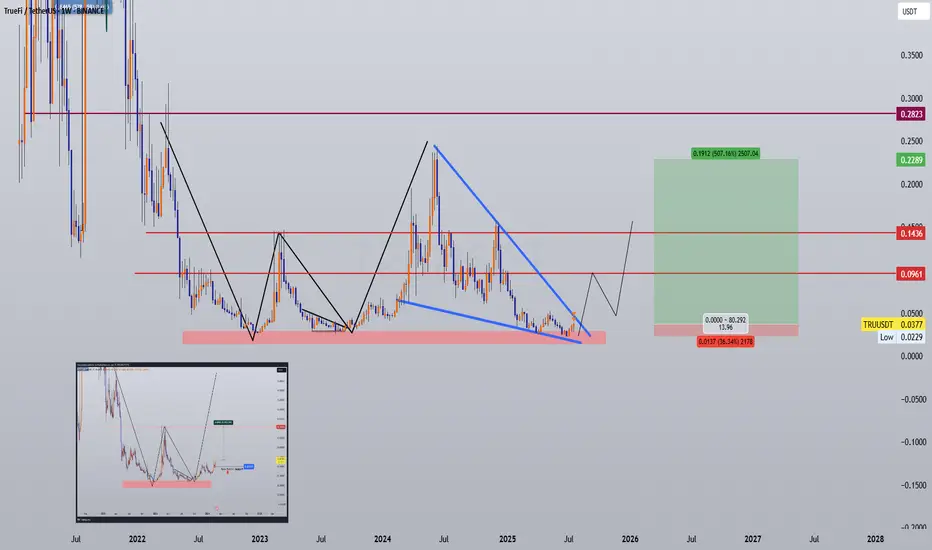
TRUUSDT Setup – Real World Asset DeFi Play | Buy Zones + Target📌 Coin: TRU (TrueFi)
💰 Buy Levels:
✅ First Entry: $0.0378
✅ Second Entry: $0.0325
✅ Third Entry: $0.0270
🛑 Panic / SL Level: Weekly close below $0.0240
🧠 Fundamental Analysis (FA) – In Short
*️⃣ Sector: DeFi / Real World Assets (RWA) Lending
*️⃣ Use Case: TrueFi is a decentralized credit protocol focused on unsecured and real-world asset lending, serving institutions with on-chain transparency.
*️⃣ Tech: Combines DeFi-native liquidity pools with off-chain credit assessment for borrowers. Offers tokenized credit portfolios, automated debt servicing, and risk scoring.
*️⃣ Narrative Fit: Perfectly aligned with the RWA + on-chain credit markets narrative, TrueFi offers one of the few active RWA lending infrastructures in DeFi.
*️⃣ Adoption: Partnered with large institutions including Archblock (formerly TrustToken), active in real-world treasury and asset-backed lending markets.
*️⃣ Unique Angle: TrueFi pioneered on-chain uncollateralized lending — a rare use case bridging traditional finance (TradFi) with DeFi.
📊 Tokenomics & Market Data
(As of July 2025)
🪙 Current Price: ~$0.034
🧾 Market Cap: ~$38M
🔢 Rank: ~Top 450
🧮 Circulating Supply: ~1.1B TRU
🔒 Max Supply: 1.45B TRU
⚙️ Token Use: Governance, staking, incentive alignment for underwriters and lenders
💡 Inflation: Fixed max supply, most emissions already circulated
🎯 Bull Market Target (Realistic)
Target Range: $0.09 – $0.12
*️⃣ Based on revaluation of DeFi protocols aligned with RWA lending and increased institutional adoption.
🚀 Mega Bullish Target (Speculative Top)
Target Range: $0.18 – $0.28+
*️⃣ If on-chain credit and RWA tokenization become core crypto narratives, TRU could be a top re-rated microcap in that sector.
*️⃣ As one of the first RWA lending protocols with real integrations, it has potential to lead a sector-wide DeFi resurgence.
✅ Final Take
🧠 TRU stands out as one of the earliest movers in institutional RWA lending on-chain.
Your $0.027–$0.0378 entries are deep within macro support, and the $0.024 SL offers clear protection against breakdown.
Low market cap + strong narrative = explosive upside if RWA gains traction.
we ask Allah reconcile and repay
Bitcoin’s Battle at Resistance Watch These Critical Levels.Bitcoin is currently forming an AMD (Accumulation–Manipulation–Distribution) pattern.
The market recently dipped due to manipulation, only to push back up and break through a key resistance level, moving toward the inversion zone. However, it now faces additional resistance from a descending trendline.
If the market decisively breaks above this trendline and successfully retests it, there is potential for further upward movement.
Keep a close watch on these critical levels for confirmation.
Do Your Own Research (DYOR)

GALA. USDTGala is one of the cryptocurrencies in the market with high growth potential.
This is not speculation. Rather, Gala growth has good prospects, given that it is an American cryptocurrency based on Ethereum, ( ERC-20).
The limited number of Gala tokens is another factor that can contribute to the growth of Gala, and Gala's dynamics have proven this many times.
Therefore,
The first target price of Gala is $0.04, that with strong growth, it will reach $0.08.
However,
Zero elimination is the first goal of Gala, and in the long term (maybe in a year or two), the price of Gala will reach $1.

Link pump today at least $18.78Am taking this #Link long. Anticipate tp to hit today if goes according to plan.
Weekly bullish
Daily bullish
4hr bearish
1hr bullish
I think the market will soon attempt to flip back bullish on the 4hr tf. Market is making...(Further breakdown on my X page with more charts)

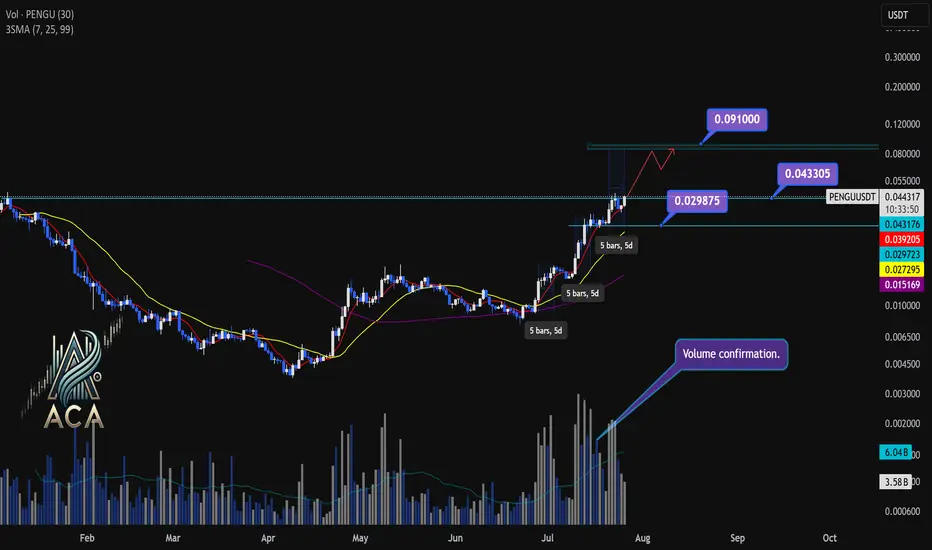
PENGUUSDT Daily Chart Analysis | Powerful Uptrend in PlayPENGUUSDT Daily Chart Analysis | Powerful Uptrend in Play
🔍 Let’s dissect the current PENGU/USDT daily chart, highlighting the unmistakable bullish structure and mapping potential targets as this trend matures.
⏳ Daily Overview
PENGUUSDT is riding a strong upward trend, with all three daily SMAs (7, 25, and 99) lined up in bullish sequence—clear confirmation of momentum. Recent rallies are also supported by textbook volume behavior: volume consistently surges during price climbs and tapers off during minor corrections, reflecting the classic signature of a robust uptrend.
🔺 Bullish Setup and Price Targets:
The next major upside target sits at $0.0910, almost 85% above the current level. For bulls, a daily candle closing above $0.043305 with convincing volume should act as a confirmation for fresh highs—though, as it’s Saturday, even moderate volume could suffice for a valid breakout.
📊 Key Highlights:
- All SMAs (7, 25, 99) confirming the uptrend on daily timeframe.
- Volume spikes on upward moves, fades on corrections—classic bullish confirmation.
- Historical trend velocity: Each time a new high (HH) is set, it’s preceded by around 5 days of advance; first leg was +83%, second +124%, the next (projected) is +160%, aligning with the $0.0910 target.
- Corrections: After each rally, pullbacks have measured about 15% and 20%. Should the first target be reached, expect a correction up to 25%—a healthy reset for further continuation.
🚨 Conclusion:
With all signals aligned—moving averages, volume dynamics, and historic price structure—the path remains bullish. A decisive close above $0.043305, especially with solid volume, could be the catalyst for the next major leg higher. As always, monitor for typical correction ranges post-breakout in line with the prior trend.
NZDUSD Potential UpsidesHey Traders, in today's trading session we are monitoring NZDUSD for a buying opportunity around 0.59800 zone, NZDUSD is trading in an uptrend and currently is in a correction phase in which it is approaching the trend at 0.59800 support and resistance area.
Trade safe, Joe.

Inside day breakoutYesterday was an inside day. On the daily chart it is breaking out, pulled back to 50% and supported by 200ma + 20ma. Ascending triangle supported by 20ma above 200ma into the Asian session. Looking to hold till close

USOIL BUY Smart Money + trend analysis expecting bullish Smart Money + Elliott Wave analysis expecting bullish move after corrective wave (C) completes at demand zone with Order Block, FVG, and liquidity sweep confluence

CHILLGUY Rebound Zone, Targets in Sight!#chillguy
Price is still holding above the key trendline and support zone. Buyers have stepped in again from this level, and the chart shows a potential bounce setup.
If this area holds, CHILLGUY could continue upward.
Entry Zone: Around $0.066–$0.068
Stop Loss: Below $0.062
Targets:
Target 1: $0.072
Target 2: $0.075
Target 3: $0.080
Target 4: $0.086
DYOR, NFA
#Altseason2025

BTCUSDT #056 ( Is it clear Road map ? )Hello dear traders.
Good days . First of all thanks for your comment and support.
-----------------------------------------------------------------------------------------------
On long term Gann Square, BTCUSDT stuck below 0.382 Gann Box price level.
With refer to all Daily bullish Gann Square ( Blue Square) of bitcoin, it is expected to fill up at least 0.75 Daily Gann Square up to 97 percent which will be 135-150 k for this bullish cycle .
Safe trades and good luck.

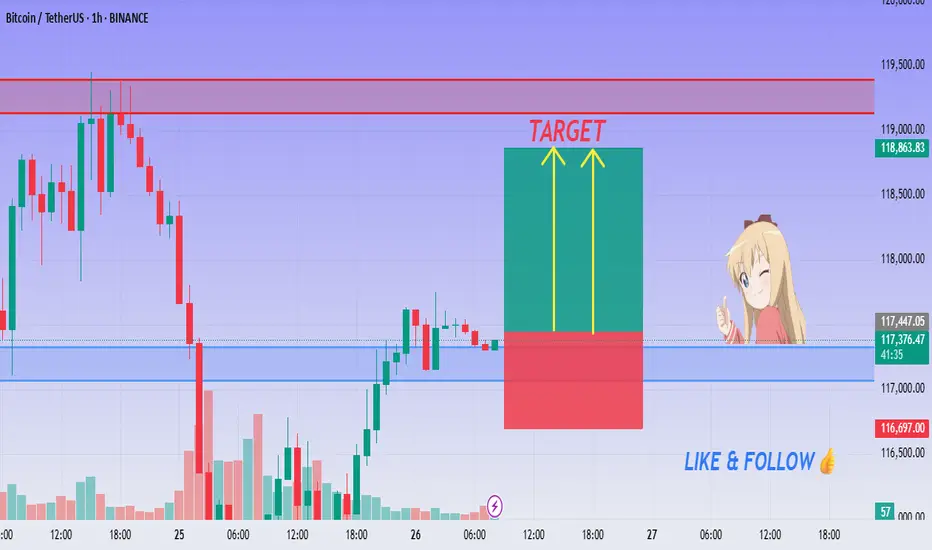
BITCOIN Ready to Pump - 1H Buy Setup Active!💚 BTC/USDT Bullish Breakout Setup ! Entry Activated!
👨💻 Dear traders,
BTC/USDT is showing a sharp rebound from a temporary base structure near $116,500, forming strong bullish momentum on the 1H timeframe. The breakout above local resistance signals the possibility of an impulsive move toward higher levels.
Bias – Bullish (Intraday)
🎯 Target 1 – $118,800
🎯 Target 2 – $119,200
🎯 Final Target – $119,500
🛑 Stop Loss – $116,500
📊 Reasoning:
– Clean bounce from previous structure support
– Bullish engulfing confirms short-term reversal
– Green zone = reward area, red = safe SL zone
– Two yellow arrows project upside momentum
– Strong volume spike during reversal
– R:R favors long scalpers and intraday swing
⚡ Stay disciplined. Let price confirm the zone and follow the momentum!
ETHUSD Will Go Down From Resistance! Sell!
Here is our detailed technical review for ETHUSD.
Time Frame: 1D
Current Trend: Bearish
Sentiment: Overbought (based on 7-period RSI)
Forecast: Bearish
The market is testing a major horizontal structure 3,641.87.
Taking into consideration the structure & trend analysis, I believe that the market will reach 2,871.15 level soon.
P.S
Overbought describes a period of time where there has been a significant and consistent upward move in price over a period of time without much pullback.
Disclosure: I am part of Trade Nation's Influencer program and receive a monthly fee for using their TradingView charts in my analysis.
Like and subscribe and comment my ideas if you enjoy them!

Smart Money Concepts (SMC) Strengths of the analysis:
1. Break of Structure (Choch + Bos)
A break of Structure (Bos) is clearly identified after s Choch, indicating the star of a new bearish structure.
2. OB 1H and FVG as an entry zone:
the price returns to a block order (OB-1H) within the resistance zone, which is an excellent institucional area to look for a short entry. Furthermore, the presence of a FVG on the 1H provides additional confluence.
3.Projection toward the last LL (Lower Low):
It is very accurate to project the bearish continuation toward the support zone, which coincides with the last LL, an area with a high probability of being mitigated.....

Trend Exhaustion Detected – Bearish Structure AheadUS100 (NASDAQ) 30-minute chart as of July 26, 2025, with technical insights based on the visible elements.
🔍 1. Trend Analysis
Primary Trend: Uptrend (bullish structure)
The price has been respecting a rising parallel channel, marked by:
Ascending support (lower boundary)
Ascending resistance (upper boundary)
Market structure shows:
Higher Highs (HH)
Higher Lows (HL)
✅ This indicates continuation of bullish momentum until structure breaks.
📐 2. Market Structure Elements
Structure Type Label on Chart Price Zone (approx.)
Break of Structure (BOS) BOS (center-left) ~22,950
Higher Low (HL) HL (2x) ~22,700 (1st), ~23,050 (2nd)
Higher High (HH) HH (2x) ~23,150 and ~23,300
Resistance Labelled ~23,300–23,320
Demand Zones Labelled ~22,450–22,700
🔁 Break of Structure (BOS)
The BOS occurred after a prior swing low was broken, followed by a new higher high, confirming a bullish shift.
🧱 3. Support / Resistance Analysis
🔼 Resistance Zone
The price is testing strong resistance around 23,300–23,320
Multiple rejections in this area
Trendline resistance also aligns here
A rejection arrow is drawn, indicating potential bearish reaction
🔽 Support Zone (Immediate)
23,180–23,220: highlighted green box is a local support block
If broken, likely to revisit 23,000–23,050, or even down to 22,900 range
🟩 4. Demand Zones
Zone 1:
22,450–22,600: Strong bullish reaction historically — likely to act as a key demand if a deeper pullback occurs
Zone 2:
22,850–22,950: Validated with prior accumulation & BOS event
🧠 5. Key Observations
Price is at a critical inflection zone:
Testing a resistance zone
At the upper trendline of an ascending channel
A bearish reaction is projected (black arrow)
Possibly targeting the green support zone around 23,180–23,220
If that fails, demand at ~23,000 will likely be tested
Ichimoku Cloud:
Currently price is above the cloud → still bullish
Cloud is thin → potential weakness or upcoming consolidation
⚠️ 6. Trading Bias & Setup Ideas
✅ Bullish Bias (if price holds above ~23,180)
Long entries can be considered on bullish reaction from support
Target: retest of 23,300–23,350 or even breakout continuation
❌ Bearish Bias (if breakdown below support)
Short entry valid below 23,180 with:
TP1: 23,050
TP2: 22,900
A breakdown from the ascending channel would signal trend exhaustion
🔚 Conclusion
Current Price: 23,298.4
Trend: Bullish, but at resistance
Next move: Watch for reaction at resistance and support box below
Bias: Neutral-to-bullish unless the structure breaks below ~23,180

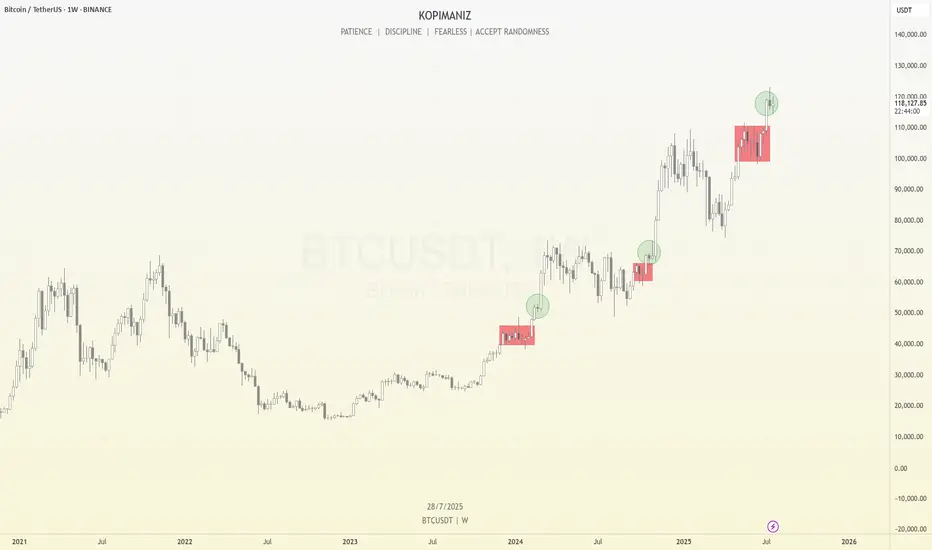
Bitcoin Weekly Structure: Repeating Rhythms and What’s Next
Bitcoin continues to follow a consistent structural rhythm on the weekly timeframe. We can observe that before every major breakout, price enters a multi-week consolidation phase, which I’ve marked using red boxes on the chart. These red box zones represent long periods of sideways movement, typically acting as reaccumulation phases. Once price breaks above these levels, it often results in a strong impulsive move, confirming that these areas serve as foundational support for trend continuation.
After each of these longer consolidations, Bitcoin tends to enter a brief 1–2 week consolidation right after the breakout, which I’ve marked with green circles. These short pauses are signs of healthy bullish momentum, often acting as flags or continuation patterns before the next leg up. What’s notable is that each of these green circle phases occurs after a clean breakout from a red box, and they consistently lead to further price appreciation.
Currently, Bitcoin has just broken out of another red box zone between ~$100k and ~$110k. Over the past two weeks, it has formed a small range near $118k, resembling the same green circle structures we’ve seen earlier in the trend. Given this recurring pattern, there’s a high probability that we are once again in the early stages of a bullish continuation. If the pattern plays out as it has in the past, the next move could be another strong weekly candle pushing toward new highs.
However, I’m paying close attention to the $125k–$126k level. This psychological zone may act as a major turning point. It could lead to either a prolonged consolidation phase that lasts for months, or potentially trigger a significant correction if the market faces strong resistance. This level marks a critical area where momentum may shift, so it deserves extra caution as we approach it.
This type of structural repetition helps me stay grounded in my analysis—focusing not just on price, but also on how long and where Bitcoin consolidates. So far, the rhythm has been clean and reliable.
Let’s see if Bitcoin respects the rhythm once again.
SONIC. USDTIt's been a long time the current Sonic( S ), and the Fantom of the past have been moving in neutral.
So,
It's time to make a profit for their investors.

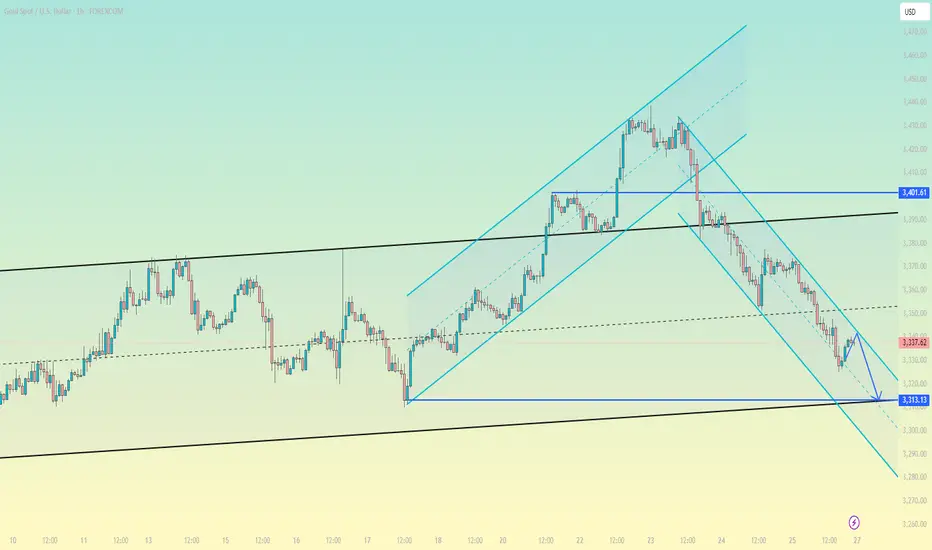
Gold prices are under pressure, focusing on the Fed stormGold prices are under pressure, focusing on the Fed storm
Weekly gold price report: The rebound of the US dollar suppresses precious metals, and the market focuses on the Fed's policies and trade negotiations
Market review
On Friday (July 26), the international gold price was under pressure to fall, with spot gold falling 0.9% to $3,336.01/ounce, and COMEX gold futures closing down 1.1% to $3,335.6/ounce. The US dollar index rebounded from a low of more than two weeks, and the progress in US-EU trade negotiations weakened the demand for safe havens, which jointly suppressed the performance of precious metals.
Analysis of core influencing factors
The US dollar and trade situation
The US-EU trade agreement negotiations have entered a critical stage. The EU said that "the agreement is just around the corner", but member states still approved the potential counter-tariff plan. US President Trump said that he will negotiate with the EU on Sunday, with a probability of 50%. If the agreement is implemented, it may further suppress the safe-haven properties of gold.
The recent trade agreement between Japan and the United States also boosted market risk appetite, and funds flowed to risky assets.
Fed policy expectations
Despite the resilience of the US labor market (initial jobless claims fell to 217,000 last week, the sixth consecutive week of decline), the market generally expects the Fed to keep interest rates unchanged at its July meeting.
Trump has recently pressured the Fed to cut interest rates and even made a rare visit to the Fed headquarters, sparking discussions on policy independence. Some analysts believe that if inflationary pressures ease, the Fed may release dovish signals in the second half of the year.
Fund positions and central bank demand
As of the week of July 22, hedge funds' net long positions in gold increased to 170,868 contracts, the highest level since April, reflecting the market's long-term concerns about trade tensions.
Central bank gold purchase demand still provides structural support for gold prices.
Geopolitical dynamics
Israeli-Palestinian conflict: Hamas said that the ceasefire negotiations have made progress, but the US statement caused a surprise, and the progress of subsequent negotiations may affect market sentiment.
Russia-Ukraine situation: Turkey coordinates all parties to hold a leaders' summit in Turkey. Russia and Ukraine have agreed in principle to meet, and potential peace plans may reduce the safe-haven premium.
Outlook for the future
Key short-term events:
US/EU/China trade negotiations: If progress is optimistic, gold prices may fall to the support level of $3,300/ounce.
Federal Reserve July resolution: Pay attention to the policy statement's hints on the path of interest rate cuts and the Fed's response to political pressure.
US non-farm data: If the employment data is strong, it may strengthen the expectation of "higher for longer" interest rates.
Technical aspect: Near $3,300/ounce may attract buying, but breaking through the previous high requires clearer signals of monetary policy shift.
Risk warning: Repeated trade negotiations, escalating geopolitical conflicts or unexpectedly dovish Fed may reverse the decline in gold prices.