XRP | Full AnalysisHere is the full analysis for CRYPTOCAP:XRP as requested 🫡
Let’s start with the weekly timeframe:
With the recent breakout above the $3.40 high, we’ve activated a new, larger bullish sequence on the weekly chart. This sequence has its target region between $6.57 and $7.84, which I believe we will reach at minimum during this bull run.
From now on, every pullback into the B-C correction area (turquoise) can be considered a legitimate re-entry opportunity.
Daily chart:
We successfully broke the all-time high with another breakout sequence (orange), which has already completed its target region.
Now, we’re trading the overall correction level — this is the same area as the B-C correction area from the weekly timeframe. It’s the Fibonacci retracement drawn from the start of the move to point C.
Local Price Action:
After reaching the target zone (orange), we activated a new bearish sequence in the upper region, which has just completed its target zone.
Now we expect a move back into the overall correction level (blue), and after that, according to the rulebook, the next legitimate U-turn could follow.
It gets really interesting if we enter the overall correction level and then start forming a bearish structure on the lower timeframes — this is where we can apply a multi-timeframe approach, which significantly increases the probability of a successful trade.
-----
Thats the my full Analysis for CRYPTOCAP:XRP , hope it was helpful if you want me to do another analysis for any other pair just comment down below.
Also, if anyone is interested in how my trading system works, let me know and I’ll post some educational content about it.
Thanks for reading❤️
Community ideas

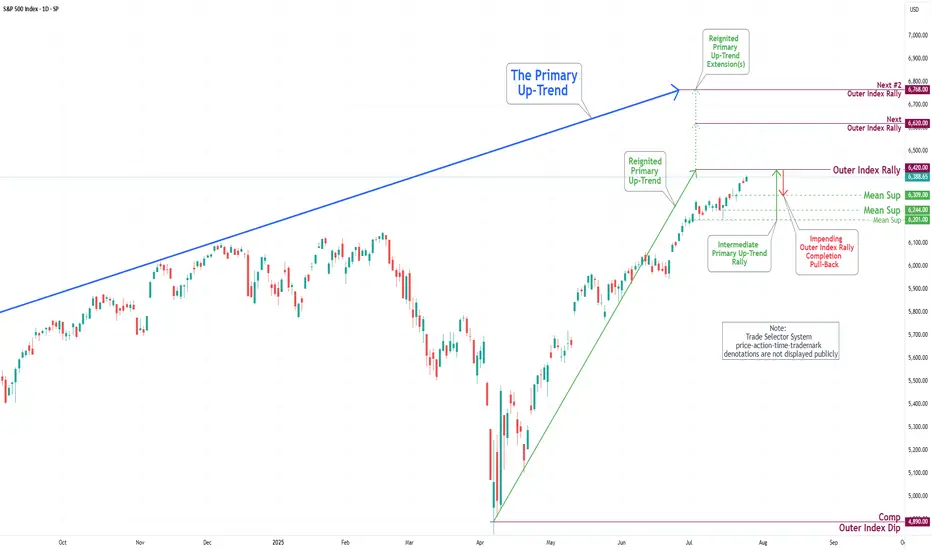
S&P 500 Daily Chart Analysis For Week of July 25, 2025Technical Analysis and Outlook:
In the trading activity observed last week, the S&P 500 Index exhibited a predominantly upward trajectory. It traded around the Key Resistance level of 6314. It successfully broke through this level, with the primary objective being to complete the Outer Index Rally at 6420, as outlined in the previous week's Daily Chart Analysis.
It is crucial to acknowledge that the current price movement may prompt a substantial pullback following the completion of the Outer Index Rally, with the main target identified as the Mean Support level of 6309. Following this potential downward adjustment, it is anticipated that the index will resume its upward trend, targeting a retest of the forthcoming completion of the Outer Index Rally at 6420.
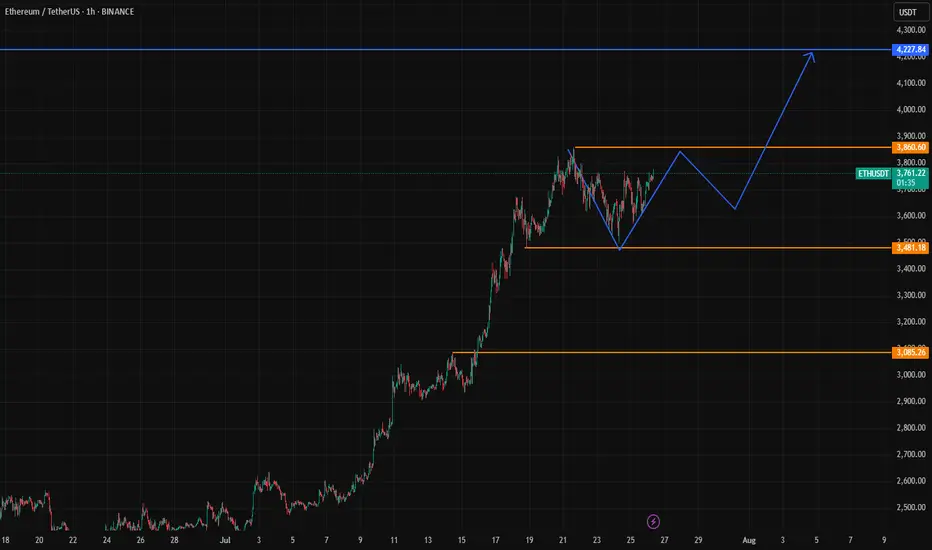
Ethereum (ETH) AnalysisEthereum (ETH), the second-largest cryptocurrency by market capitalization, continues to be a pivotal asset in the digital economy, driving the decentralized finance (DeFi), NFT, and Web3 ecosystems. Its price action is influenced by a combination of its own fundamental developments, the broader cryptocurrency market sentiment (primarily Bitcoin's movements), and macroeconomic factors.
1. Fundamental Strengths & Developments:
Ecosystem Growth: Ethereum boasts the largest and most vibrant ecosystem of decentralized applications (dApps). The majority of DeFi protocols, NFT marketplaces, and Web3 infrastructure are built on or heavily integrated with Ethereum. This network effect provides strong underlying demand for ETH as gas fees and collateral.
Scalability Progress (Ethereum 2.0 / Serenity): The ongoing transition to Ethereum 2.0 (now largely referred to as "Serenity" or simply "The Merge" and subsequent upgrades) is a critical long-term bullish factor.
The Merge (completed): The successful transition to Proof-of-Stake (PoS) in September 2022 drastically reduced Ethereum's energy consumption and introduced ETH staking rewards, making it a more environmentally friendly and yield-generating asset.
Shanghai/Capella Upgrade (completed): This enabled staked ETH withdrawals, reducing a major liquidity concern for stakers and attracting more participation in the staking mechanism.
Upcoming Upgrades (e.g., Danksharding, Proto-Danksharding): Future upgrades are focused on increasing scalability and throughput through sharding, which is crucial for lowering transaction costs (gas fees) and enhancing network capacity. Progress on these fronts generally bodes well for ETH's long-term value.
Deflationary Mechanism: EIP-1559, implemented in August 2021, introduced a mechanism to burn a portion of transaction fees. Coupled with staking, this can lead to a net deflationary supply of ETH during periods of high network activity, reducing circulating supply and potentially increasing value.
2. Price Action and Technical Considerations (General Outlook):
Correlation with Bitcoin (BTC): ETH's price often highly correlates with Bitcoin. A strong bullish trend in BTC typically pulls ETH higher, while a significant BTC correction usually leads to ETH declines. Observing BTC's technical structure (support, resistance, momentum) is crucial for predicting ETH's near-term movements.
Key Price Levels:
Support: Historically significant support levels often exist around previous highs or strong accumulation zones. These levels act as price floors where buying interest tends to emerge.
Resistance: Previous all-time highs or significant resistance zones (where selling pressure has historically been strong) act as ceilings. A decisive break above these levels, especially with high volume, can signal a continuation of an uptrend.
Market Cycles: Cryptocurrencies are highly cyclical. After periods of rapid price appreciation, consolidation or correction phases are common. These periods allow the market to digest gains, reset funding rates, and build new bases for future moves.
3. Macroeconomic and Regulatory Factors:
Interest Rates and Inflation: Higher interest rates and tighter monetary policies from central banks can reduce liquidity in financial markets, impacting risk assets like cryptocurrencies. Conversely, a more dovish stance can be supportive.
Regulatory Environment: Clarity or uncertainty from regulators (e.g., SEC in the US, MiCA in Europe) can significantly influence institutional adoption and overall market sentiment. Positive regulatory developments can instill confidence, while restrictive measures can cause FUD (Fear, Uncertainty, Doubt).
Global Economic Health: A robust global economy generally fosters a risk-on environment, which is favorable for crypto. Economic slowdowns or recessions can lead to risk aversion.
Outlook:
Ethereum remains a strong long-term investment given its foundational role in the decentralized web and its continuous technological advancements. The successful transition to PoS and ongoing scalability efforts are critical drivers.
Bullish Scenario: If the broader crypto market remains strong, Bitcoin maintains its uptrend, and Ethereum continues to deliver on its roadmap (e.g., successful sharding implementations), ETH could target new all-time highs. Increased institutional interest, ETF approvals (for ETH directly or indirectly), and sustained DeFi/NFT activity would further fuel this.
Bearish Scenario: Significant macroeconomic headwinds, a prolonged downturn in Bitcoin's price, major regulatory crackdowns, or unforeseen technical issues with Ethereum's upgrades could lead to a correction.
Conclusion:
Ethereum's value proposition is robust due to its vibrant ecosystem and relentless development. While short-term price movements will be influenced by market sentiment and macroeconomic factors, its long-term trajectory appears promising as it continues to solidify its position as the backbone of the decentralized future. Investors should closely monitor Bitcoin's price action, Ethereum's development milestones, and broader economic indicators.

GBPUSD Will Go Higher! Long!
Take a look at our analysis for GBPUSD.
Time Frame: 4h
Current Trend: Bullish
Sentiment: Oversold (based on 7-period RSI)
Forecast: Bullish
The market is approaching a key horizontal level 1.344.
Considering the today's price action, probabilities will be high to see a movement to 1.351.
P.S
Please, note that an oversold/overbought condition can last for a long time, and therefore being oversold/overbought doesn't mean a price rally will come soon, or at all.
Disclosure: I am part of Trade Nation's Influencer program and receive a monthly fee for using their TradingView charts in my analysis.
Like and subscribe and comment my ideas if you enjoy them!

AUDJPY: Strong Bearish Signal?! 🇦🇺🇯🇵
AUDJPY may retrace from a key daily resistance.
As a confirmation, I see a bearish breakout of a support line of a rising
wedge pattern with a high momentum bearish candle.
Goal - 96.47
❤️Please, support my work with like, thank you!❤️
I am part of Trade Nation's Influencer program and receive a monthly fee for using their TradingView charts in my analysis.

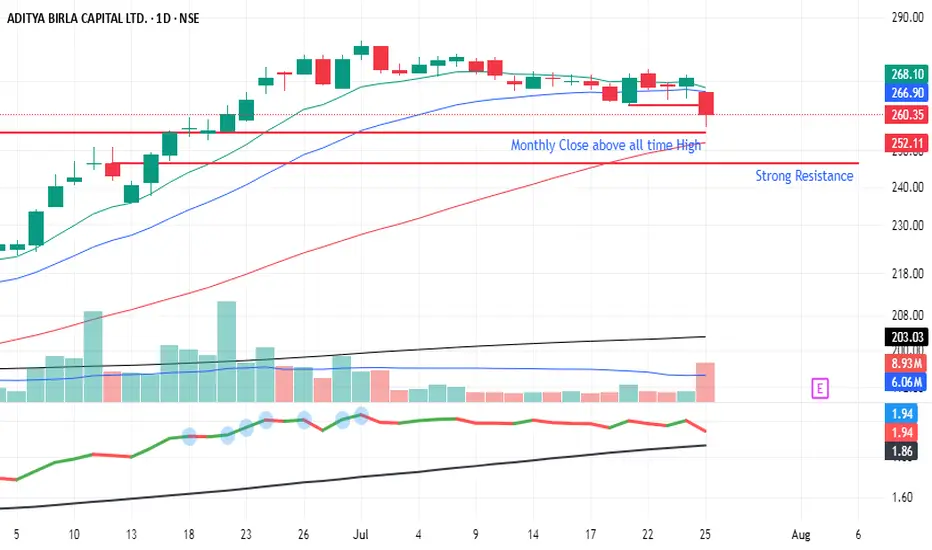
AB Capital - Closed above all time high and consolidationAB Capital
After closing above-time high of Rs. 255 in June 2025, the stock has entered a consolidation phase over the past month.
Key observations:
Support Zone: The 246-255 range is expected to provide strong support.
Trading Plan: Look for buying opportunities near the support zone (246-250) with a target of 280 and above.
A sustained move above 260 could lead to further upside.
This analysis is based on technical indicators and chart patterns. Always use proper risk management techniques and consider multiple perspectives before making trading decisions.
XRP Cup & Handle Pattern on the Daily Chart.XRP is now forming the handle on a very nice cup-and-handle pattern on the daily chart, starting at the previous all-time high set on January 16th, 2025.
But this pattern isn’t all sunshine and rainbows. The price of XRP could drop down into the $2.50 range—toward the bullish fair value gaps I’ve outlined at the bottom of the handle—before making any credible gains or a major breakout to higher levels.
I do believe we’ll see much higher prices in XRP in the coming years as we continue moving into the new global digital financial system. However, for this pattern to fully play out, there will likely be some pain before the pleasure.
I’d keep a close eye on the pink area marked on the charts—spanning from August 23rd through September 8th—as a potential zone for bearish price action.
Luckily for me, my XRP bags have been filled since before the Trump election pump, so I don’t personally need to buy more—unless I see a clear buying opportunity.
Good luck, everyone!
XRP - history repeating?Hello.
I'm going to walk you through what happened in the early years of XRP p.a. and how this fractal might play out today.
Here's what happened.
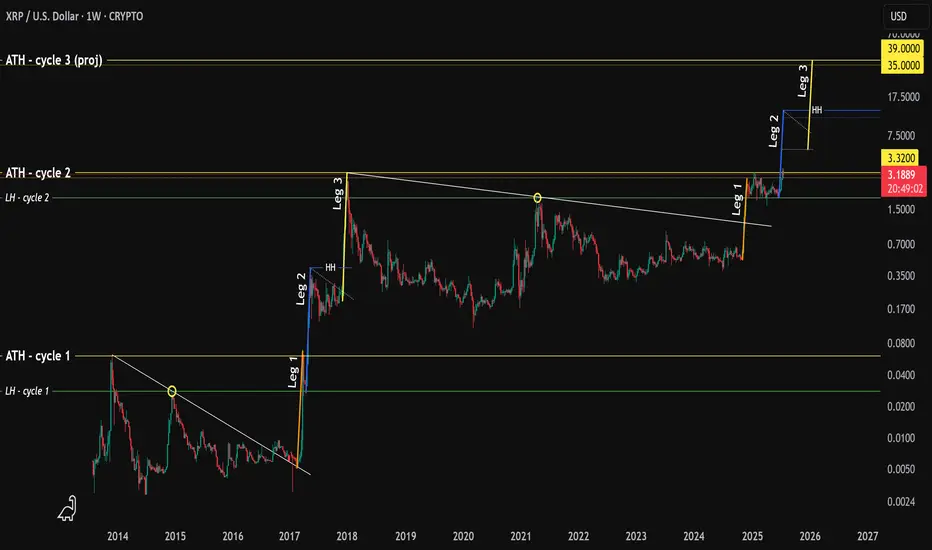
1. A high was printed in 2013 (ATH)
2. Followed by a lower high (LH)
3. XRP broke out of a downtrend 📈
4. In 2017 price increased 1,280% finding resistance @ ATH (we'll call this "Leg 1")
5. The LH then acted as support, followed by sideways price movement
6. Price increased 1,460% creating a higher-high (or "HH") which surpassed the ATH and this is "Leg 2"
7. Again, sideways price movement.
8. An increase of 1,560% creating a new ATH Dec 2017 - "Leg 3"
What's interesting here is that each leg takes 5 weeks to play out (that's 5 green weekly candles to put a finer point on it).
Fast forward in time - what do we see?
A high..
A lower high....
A breakout of the downtrend..
Followed by..... you guessed it... 5 green weekly candles
Hold on...
A rejection at the ATH
The LH acting as support...
With sideways movement .. 👀
The symmetry is quite profound and provides us with an idea of what will happen next.
If we consider the move in Nov 2024 as "Leg 1" then one could argue that "Leg 2" is currently in play.
Leg 1 was not as significant as the uplift we saw in 2017 (480% vs 1,280%)
However, if we assume that the variance between Leg 1 and Leg 2 rhymes then the projected uplift from the LH would be 550%.. making XRP price roughly $11-13
It follows that price will then move sideways/consolidate/capitulate for several months.
Followed by one last move to the upside which, using the variance between Leg 2 and Leg 3 put the final leg @ 585% or $35-39.
Wild guess but based on historical Bitcoin halving peaks and XRP ATH in both cycle 1 and 2 landed at the back end of Q4, it is assumed the same could happen (put simply: the end of 2025).
You're welcome.
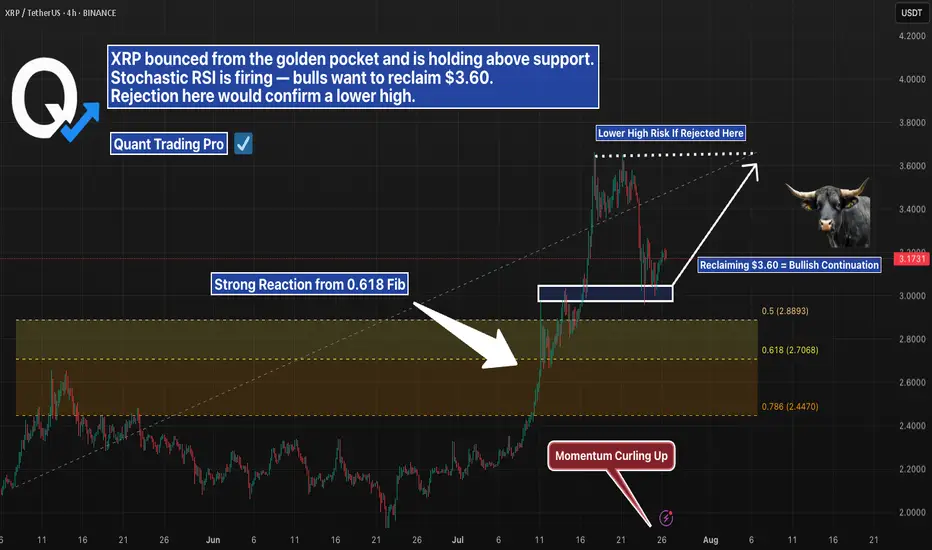
XRP 4H – Golden Pocket Bounce, But Will Bulls Reclaim $3.60?XRP pulled back cleanly into the golden pocket (0.618 Fib) after a strong rally — and buyers stepped in with force. Momentum flipped quickly, and Stochastic RSI is curling up with bullish intent.
Now price is holding above short-term support, but faces a key challenge:
→ $3.60 marks the prior high
→ Reclaiming that level would confirm bullish continuation
→ A rejection here would set up a lower high and shift structure bearish
This is a make-or-break moment for XRP in the short term. The golden pocket held — now the top of the range needs to flip.
#XRP #GoldenPocket #Fibonacci #CryptoAnalysis #StochasticRSI #LowerHighRisk #PriceAction #QuantTradingPro
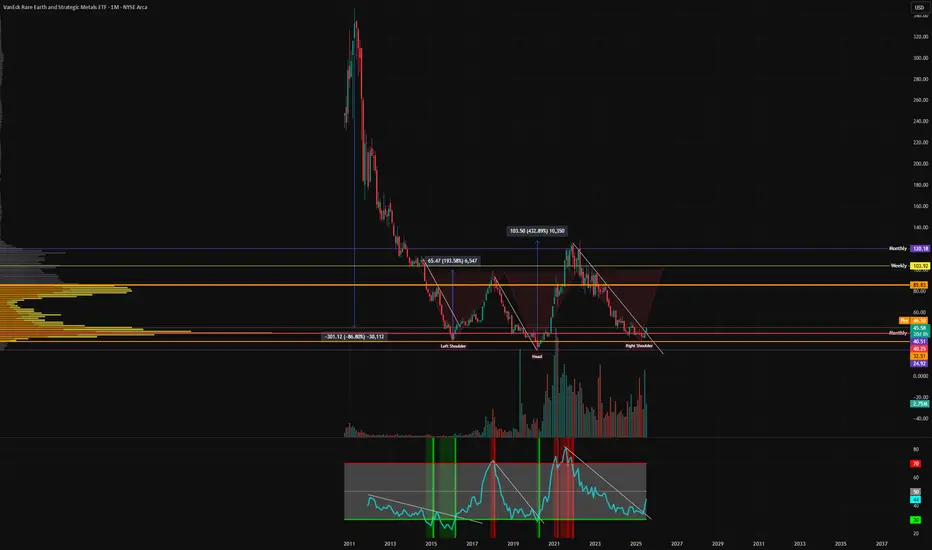
Rare Earth UpdateTo provide an update on why I went long Rare Earth. I noticed the after hours move up on MP materials, at 20% increase before market open which quickly became a 50% move when trading started. This particular ETF holds MP Material as a major holding and it hadn't moved much as it should have. I posted a trade idea on Lynas, which went up the following day. The TA on this chart suggests the move up may have plenty of room to the upside.
This is a highly cyclical ETF, as expected from any mining related asset. There's periods of huge drawdowns followed by sharp moves to the upside. We have broken out of the downtrend, we have held the POC as support and bullish volume suggests the move is not a fakeout.
Zooming out, I see a giant inverse head and shoulders pattern. You can also see the RSI downtrend has been broken.
Not financial advice, congratulations to anyone who took the trade on this with me. I have moved my stop loss to break even, if price breaks below I will get stopped out with no loss.
Not financial advice, do what's best for you.
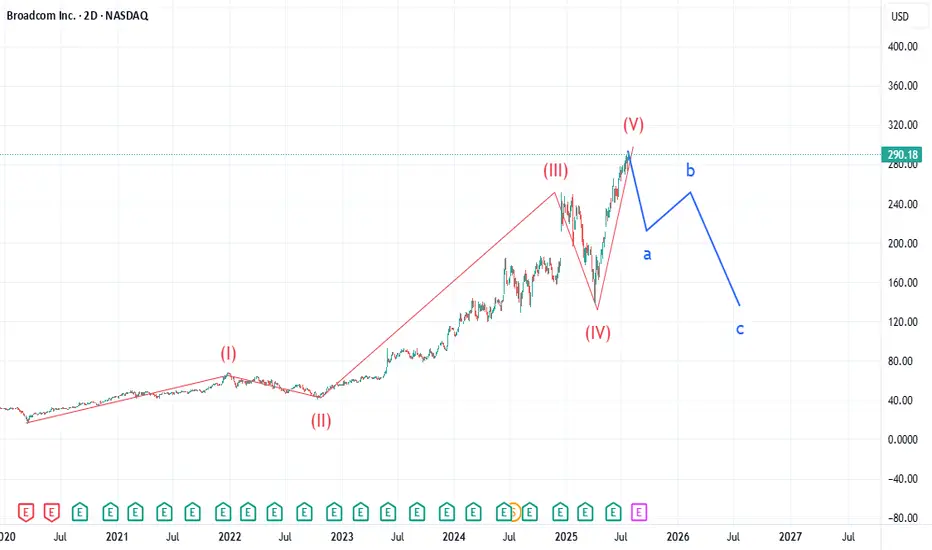
AVGO: Too Many Similarities Market WideLike my chart on BKNG, AVGO is showing an uncanny similarity to Booking.com's chart. Many indices are showing the end of 5 waves in a super cycle dating back to the drop of March 2020. AVGO pt1 is 211. Expecting selling to increase over the next 90 days. Not certain what the catalyst will be, but looking for a major drop in equities over the next 2 weeks. Check IBM chart. I called that drop last week and many stocks will have a similar gap down structure over the next 2 weeks from what I am tracking.
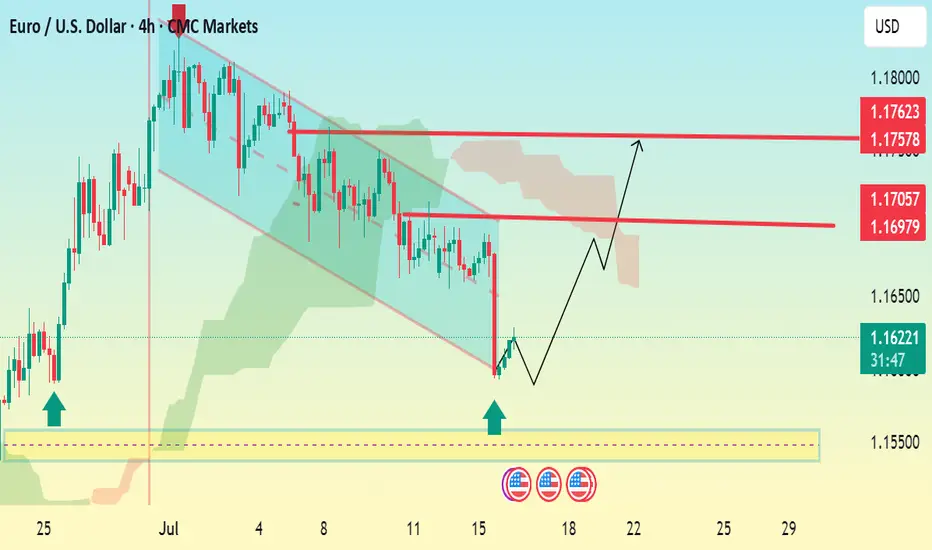
EUR/USD 4H Bullish Reversal Setup Analysis:The chart shows a falling wedge pattern, a typical bullish reversal signal.
Price has broken out of the wedge, suggesting a potential trend reversal to the upside.
Two strong demand zones (highlighted with blue arrows and yellow box) show strong buying pressure around 1.15500–1.15700.
The Ichimoku Cloud above indicates resistance, but a breakout above it would confirm continued bullish momentum.
Key Levels:
Current Price: 1.16171
Immediate Resistance: 1.16979
Next Targets (TP):
TP1: 1.17057
TP2: 1.17578
TP3: 1.17623
Support Zone: 1.15500 – 1.15700
Conclusion: If the price holds above the 1.15700 support zone and sustains momentum above the wedge breakout, expect bullish continuation toward 1.17500+. Ideal long setup on retracement with tight SL below 1.15500.
ERAUSDT Forming Bullish FlagERAUSDT has caught the attention of traders after a strong impulsive move that has laid the foundation for a possible continuation of its bullish trend. The current structure appears to be forming a classic bullish flag/pennant formation, a pattern often observed in strong uptrends, where price consolidates in a narrow range before breaking out higher. With volume supporting the recent breakout and price action showing resilience near consolidation support, this setup presents an exciting upside potential.
The projected gain of 90% to 100%+ aligns well with the technical structure seen on the chart, especially considering the momentum-driven environment ERAUSDT is trading in. As price continues to coil within a tight range, it builds the energy necessary for a decisive breakout. The bullish sentiment surrounding the ERA ecosystem, coupled with increasing interest from speculative and long-term investors, could be the fuel needed to push this pair into a significant rally.
Fundamentally, ERA is beginning to draw more eyes from across the crypto community, possibly due to developments or partnerships that are elevating its profile. This blend of technical readiness and rising investor interest makes it a coin to watch in the short to mid-term. If bullish confirmation holds, the next leg could be sharp and aggressive, potentially achieving or even exceeding the projected 100% target.
This is a moment where traders who rely on high-reward momentum setups could benefit by monitoring this pair closely. With risk well-defined below recent lows and the structure signaling strength, ERAUSDT deserves a spot on every active trader's radar.
✅ Show your support by hitting the like button and
✅ Leaving a comment below! (What is You opinion about this Coin)
Your feedback and engagement keep me inspired to share more insightful market analysis with you!

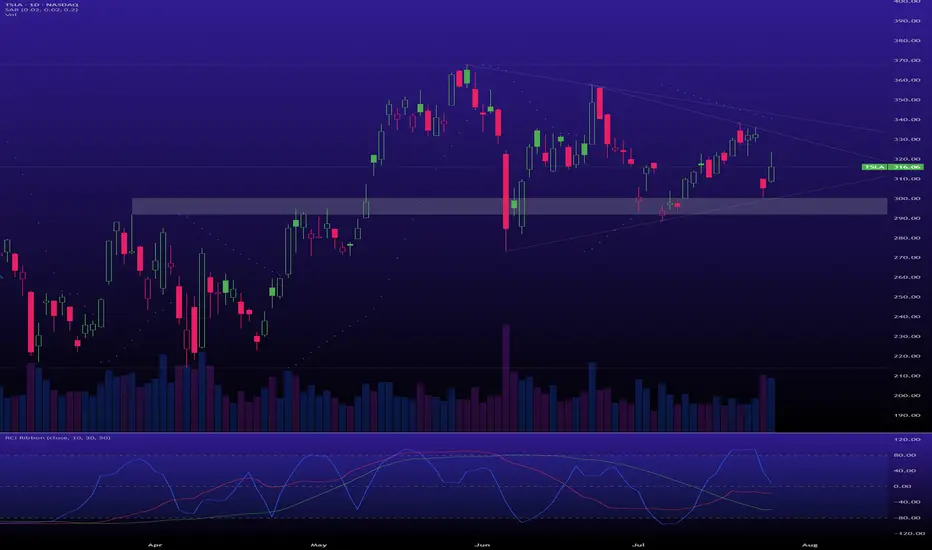
$TSLA is in an accumulation phase.A classic Wyckoff scenario is playing out, offering a prime opportunity if you have the nerve for it.
Support: The key support zone is $300 - $305. As long as this holds, the bullish thesis is intact.
Resistance: The primary target is the top of the multi-month accumulation range, around $370 - $380. A breakout above this would signal the start of a major new markup phase.
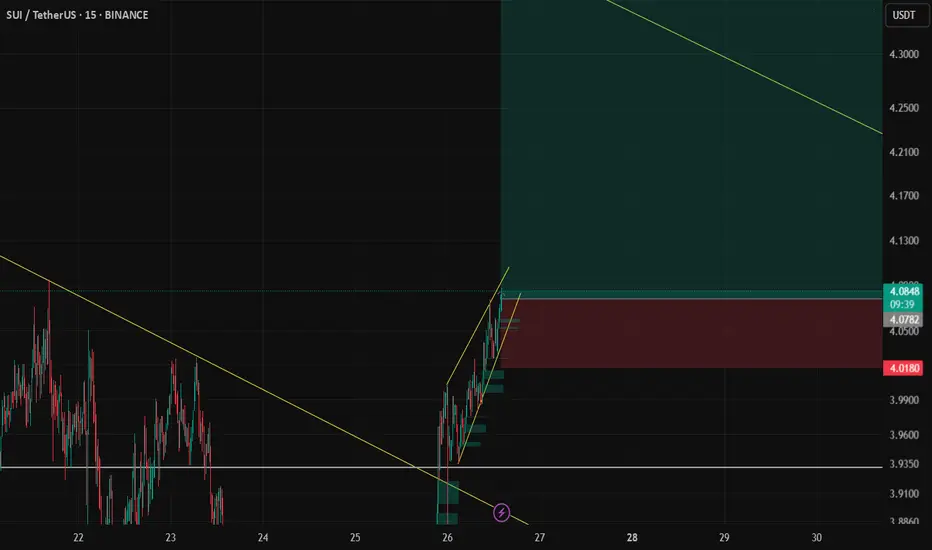
SUI 99 RR COULD IT BE???SUI 99 RR COULD IT BE??? - massive multiplier. Relative strength. Big time frame HVF. SUI Could be ready to pop.

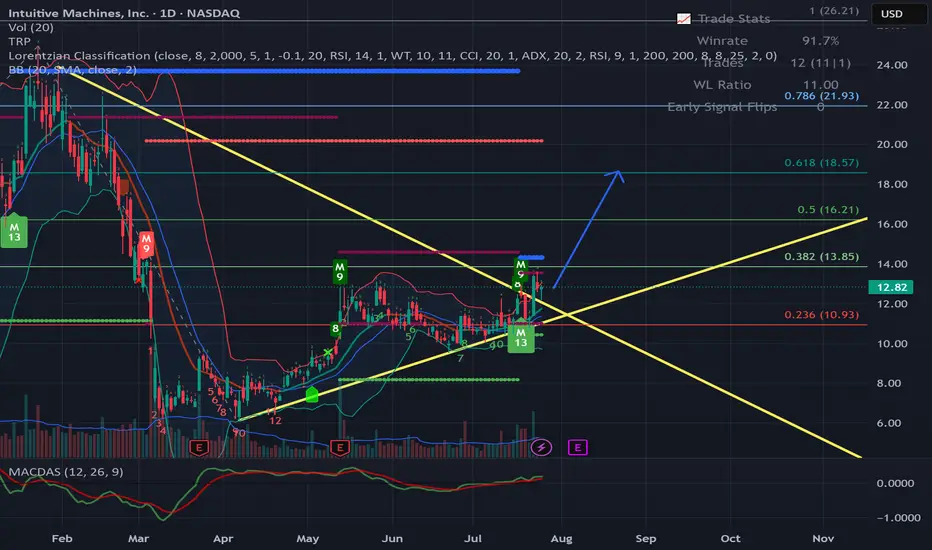
LUNR - Big Potential Hello Everyone,
2nd stock for today is LUNR Intuitive Machines, Inc.
What they do?
Intuitive Machines, Inc. is a public U.S.-based aerospace firm headquartered in Houston, Texas. Founded in 2013, the company specializes in commercial lunar exploration, offering payload delivery, mission control capabilities, and the development of lunar infrastructure.
Core Business Lines
Lunar Access Services – Cargo and scientific payload delivery via Nova‑C landers
Lunar Data Services – Building the Near Space Network (satellite/relay comms system)
Infrastructure-as-a-Service – On-surface navigation, maintenance, and automation systems
Financial:
It is still not a profitable company
Q1 25 - Revenue $62(m) / EPS ($0.11)
In the chart i see a big opportunity to reach 18.50 level which is over %40 gain .
There is a break up the up trend and already re-testet break level, so direction is now Up.
My final target is 18.00 / 18.50 . Resistance levels you can see in Chart as Fib levels.
Final remark, as i say long term i think it is one of the stocks that has a big potential.
This is just my thinking and it is not invesment suggestion , please do not make any decision with my anaylsis.
Have a good start a Weekend
6month log chart on xrpusd suggests crazy potential targetsThe bull pennant we are in shown here on the 6month time frame seems to have a symmetrical triangle for its flag. The breakout target for just the symmetrical triangle is in the $33 range. Factor in the pole of the flag and the potential target skyrockets to 1.2k. Definitely not financial advice and certainly no guarantee it will hit either target as it’s still up in the air if log chart targets reach their full target as reliably as linear chart patterns do. Even if it does hit these targets you can see the apex of the pennant in its current trendline trajectories doesn’t occur until 2026. The only way I see price remaining inside this triangle for that long is indeed if the SEC ripple case is extended through appeal and taken to the Supreme Court. Hopefully not but it isnt impossible. If this were to occur I would simply keep dollar cost average accumulating until it was to break out from the triangle which would give me more opportunity to take some profit at the first target but then also hold onto some of the asset in case it does indeed reach the full bullflag breakout somehow all the way up at 1.2k. Simply posting this hear so I can see how well price action chooses to follow this pattern over the next year or few. Once again *not financial advice*


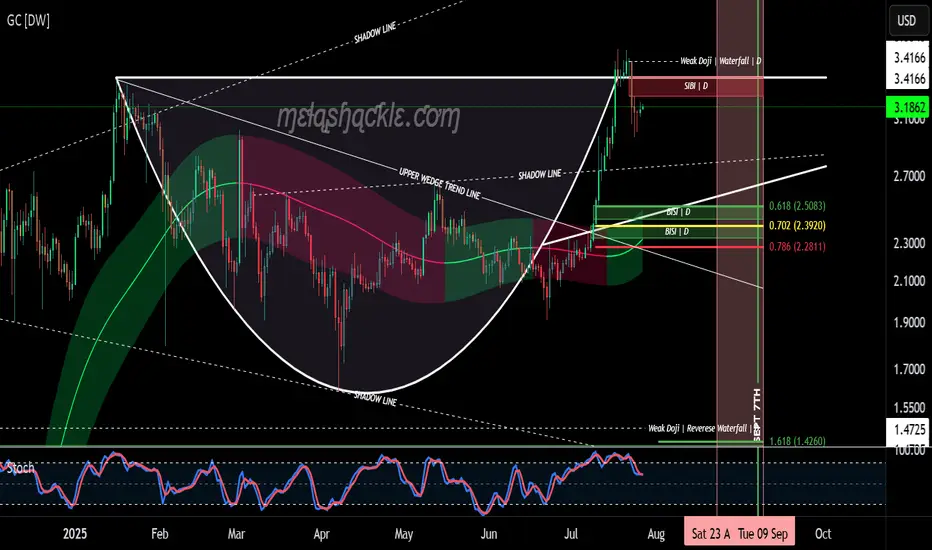
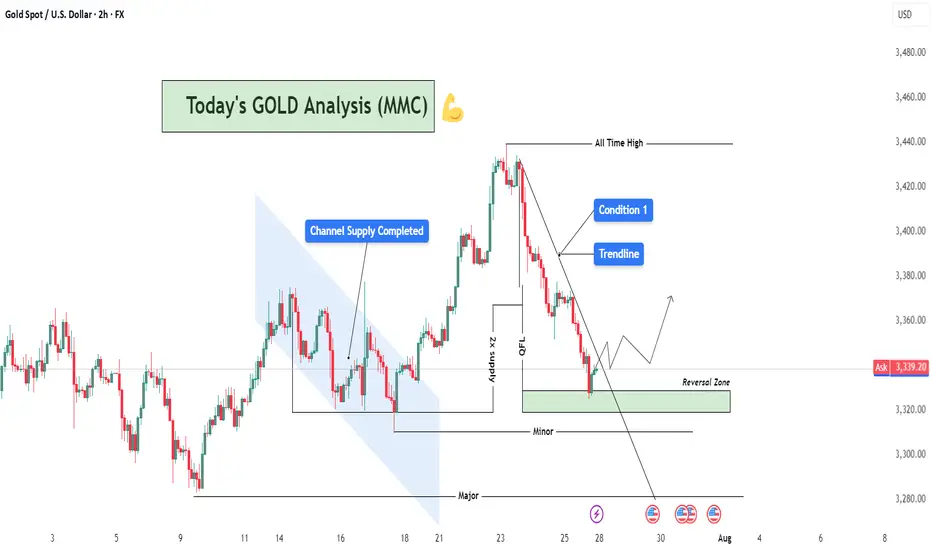
XAUUSD Analysis : Reversal Zone & Trendline Break Setup 🧠 Market Breakdown (Based on MMC Concepts)
Gold (XAU/USD) recently touched an All-Time High, followed by a sharp correction respecting a clean descending trendline — confirming strong selling pressure in the short term.
After price completed a Channel Supply zone (highlighted), it dropped significantly and created a 2x Supply Structure along with a QFL (Quasimodo Failure Level) — a strong indication of liquidity engineering by smart money.
Now, price has entered the Major Reversal Zone, which aligns with a key minor structural demand level. The reaction here becomes highly important, as it could mark the beginning of a new bullish leg.
📌 Technical Conditions
Trendline (Condition 1): Still active; breakout confirmation required for bullish entry.
Reversal Zone (Demand Area): Price currently reacting; signs of rejection forming.
Smart Money Behavior: Liquidity sweep + QFL zone = potential institutional accumulation.
Momentum Watch: Look for bullish engulfing or strong pin bar as confirmation.
🎯 Price Levels to Watch
Upside Targets:
🔹 TP1: 3,360 – 3,380
🔹 TP2: 3,420 – 3,440
Invalidation Zone:
🔻 Break and close below 3,300 = bearish continuation likely.
💡 Conclusion
Gold is approaching a decision point. If this reversal zone holds and we break the trendline, we could see a strong rally back toward previous supply zones. However, failure to hold could bring price lower for further liquidity grabs.
Stay patient. Let price confirm.
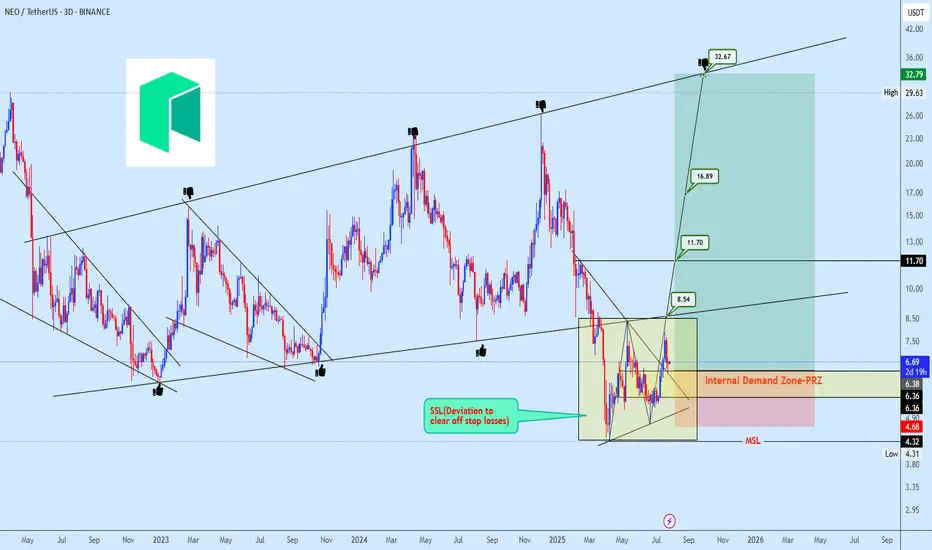
NEOUSDT Accumulation in Progress After Strategic Stop-Loss SweepNEOUSDT broke below its micro ascending broadening structure in what appears to be a strategic deviation to trigger stop-loss liquidity. Following this flush, price action has settled into a brief consolidation phase, often indicative of underlying bearish weakness losing momentum.
Our focus shifts to the internal demand zone, which is currently acting as a strong platform for accumulation. With price reclaiming the prior range low and reacting positively from the projected reversal zone (PRZ), we are positioning for a potential multi-leg bullish expansion.
Targets are projected at 8.54 → 11.70 → 16.89, with a final extension towards 32.67, aligning with the macro channel resistance.
Risk is clearly defined below 4.68, which serves as invalidation of this bullish view.
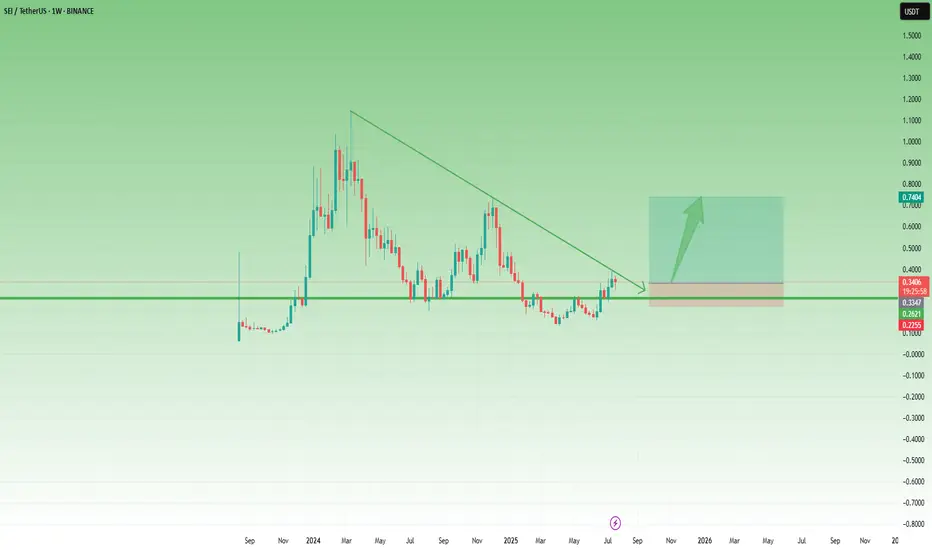
SEI Breakout Setup: Buy the Dip Before the Next Leg UpAfter the low around 0.13 in April, SEI started to recover, and although the first attempt to reclaim the 0.25–0.26 zone failed in mid-May, that key area—a former support from last year—was finally broken at the end of June.
Now, this previous resistance has turned into support, and even though gains have so far been capped by the falling trendline, price is consolidating above support – which could be a sign of bullish pressure building.
If we get a clean break above this descending trendline, momentum could accelerate, opening the way for a push toward the 0.75 resistance.
This is exactly the scenario I’m working with.
I'm looking to buy dips, with an ideal entry around 0.30, while keeping in mind that a move below 0.25 would invalidate the setup.
✅ Risk-reward? With a stop below 0.25, this setup offers a 1:4 R:R, and even a realistic chance at a 2x trade, which would be quite reasonable under current market conditions.